General Contracting Company
BUSINESS PLAN SMITH CONTRACTORS, INC.
123 Main Street, Suite H
Spokane, Washington 99204
Smith Contractors, Inc. specializes in national tenant improvements, retail market facilities, and commercial properties. Their primary goal of meeting customers' construction needs through quality workmanship and successful relationships with owner management teams is evidenced by their expanding base of repeat clients. This plan was provided by Ameriwest Business Consultants, Inc.
- EXECUTIVE SUMMARY
- OBJECTIVES & GOALS, AND STRATEGIES FOR ACHIEVING THEM
- BUSINESS DESCRIPTION, STATUS, & OUTLOOK
- MANAGEMENT AND OWNERSHIP
- MARKET ANALYSIS
- MARKETING STRATEGIES
- FINANCIAL PLANS
EXECUTIVE SUMMARY
BUSINESS DESCRIPTION
Smith Contractors, Inc. is a general contracting company founded in February 1990 by a select group of individuals with a high level of construction experience. The firm specializes in national tenant improvements, retail market facilities, and commercial properties. Smith Contractors' primary goal of meeting customers' construction needs through quality work-manship and successful relationships with owner management teams is evidenced by our expanding base of repeat clients. Smith Contractors offers national construction services, preconstruction services, job site and project management, administrative support, and document control. Smith Contractors evaluates projects for constructability, provides cost estimates, helps maintain project scheduling, and works with owners to meet quality and time objectives. Smith Contractors can suggest cost effective means of construction and help select the best subcontractors for each project. Once a project is begun, Smith Contractors maintains full-time superintendents who are responsible for all daily logs, reviewing quality and timeliness of subcontractors, conducting safety meetings and maintaining good communications with the owner. The client list includes many nationally known firms including Ross, Sears, Dockers, Fashion Bar, and Nike. Smith Contractors is licensed or authorized to pull building permits in all 50 states.
CURRENT POSITION AND FUTURE OUTLOOK
The business is in its seventh year of operation. Operations are conducted from facilities located at 123 Main Street in Spokane, Washington. Sales increased nearly fifty percent in 1998 and are expected to do the same in 2000. These healthy increases are expected to continue for another three years and then begin to level off. An area of opportunity in the future will be working on international projects. This will be on a limited basis and will be at the request of existing customers.
MANAGEMENT AND OWNERSHIP
The company is set up as a corporation with John Smith owning 85% of the stock and Bill Brown owning the remaining 15%. A "C" corporation type of entity was chosen for liability protection, tax considerations, growth plans, stock option plans, and the opportunity to raise capital from investors more easily. John Smith serves as President and C.E.O. John has over 18 years of contractor experience and has run the operations of two national firms. Other key employees include Bill Brown, Vice-President and Consultant; Mark Brown, Marketing Manager; and Ralph Brown, Director of Construction. Smith Contractors also employs nine other people in various capacities. When volume picks up, additional part-time or full-time employees will be hired as the workload requires. Smith Contractors will continue to utilize the services from consultants in areas such as planning, budgeting, accounting, general business advising, and law.
UNIQUENESS AND DIFFERENTIATION OF THE SERVICE
Smith Contractors, Inc. will continue to specialize in serving nationally known retailers. It is only one of twenty plus contractors that are trusted to handle projects for retailers on a national scale. The company utilizes the most current technology to enable it to not only provide competitive pricing but also for the monitoring of existing projects. Through the use of a digital camera, Smith Contractors can post pictures of current projects on its website. This allows customers to constantly monitor status of projects. Smith Contractors will continue to secure jobs in the booming West Coast region, but its focus will always be on the national marketplace. It will only occasionally compete with Washington contractors for business.
It is rare in today's business world to find a true market void. That is exactly what Smith Contractors has done. It has combined the latest in technology with an unfilled need and has promised to deliver a high quality new product at a competitive price. Our services have limited competition in Washington and even nationally. We have built an excellent reputation of bringing projects in on time and on budget. We are now considered contractor of first choice by many well known companies.
FUNDS REQUIRED AND USAGE
To continue to fund its growth, Smith Contractors will be seeking $100,000 to $350,000 in additional funding. This may come from either investors or from additional loans. Any additional funds obtained will be for working capital and advertising. By changing the way it pays subcontractors and suppliers and collects payments from customers, the amount of new funds specified above may be reduced dramatically. These changes are already in progress and will be ongoing. In the past, Smith Contractors often funded a major portion of a project until it was completed. From now on, this funding will be kept to a minimum.
Five-Year Income Statement Summary
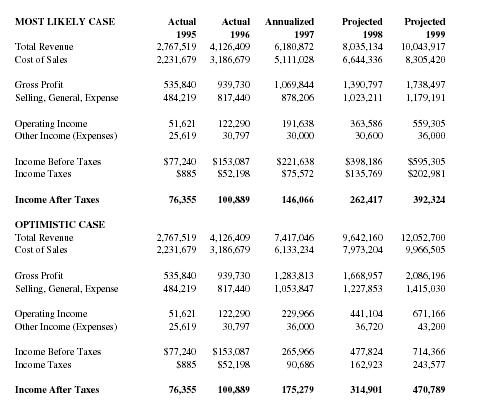
| MOST LIKELY CASE | Actual | Actual | Annualized | Projected | Projected |
| 1995 | 1996 | 1997 | 1998 | 1999 | |
| Total Revenue | 2,767,519 | 4,126,409 | 6,180,872 | 8,035,134 | 10,043,917 |
| Cost of Sales | 2,231,679 | 3,186,679 | 5,111,028 | 6,644,336 | 8,305,420 |
| Gross Profit | 535,840 | 939,730 | 1,069,844 | 1,390,797 | 1,738,497 |
| Selling, General, Expense | 484,219 | 817,440 | 878,206 | 1,023,211 | 1,179,191 |
| Operating Income | 51,621 | 122,290 | 191,638 | 363,586 | 559,305 |
| Other Income (Expenses) | 25,619 | 30,797 | 30,000 | 30,600 | 36,000 |
| Income Before Taxes | $77,240 | $153,087 | $221,638 | $398,186 | $595,305 |
| Income Taxes | $885 | $52,198 | $75,572 | $135,769 | $202,981 |
| Income After Taxes | 76,355 | 100,889 | 146,066 | 262,417 | 392,324 |
| OPTIMISTIC CASE | |||||
| Total Revenue | 2,767,519 | 4,126,409 | 7,417,046 | 9,642,160 | 12,052,700 |
| Cost of Sales | 2,231,679 | 3,186,679 | 6,133,234 | 7,973,204 | 9,966,505 |
| Gross Profit | 535,840 | 939,730 | 1,283,813 | 1,668,957 | 2,086,196 |
| Selling, General, Expense | 484,219 | 817,440 | 1,053,847 | 1,227,853 | 1,415,030 |
| Operating Income | 51,621 | 122,290 | 229,966 | 441,104 | 671,166 |
| Other Income (Expenses) | 25,619 | 30,797 | 36,000 | 36,720 | 43,200 |
| Income Before Taxes | $77,240 | $153,087 | 265,966 | 477,824 | 714,366 |
| Income Taxes | $885 | $52,198 | 90,686 | 162,923 | 243,577 |
| Income After Taxes | 76,355 | 100,889 | 175,279 | 314,901 | 470,789 |
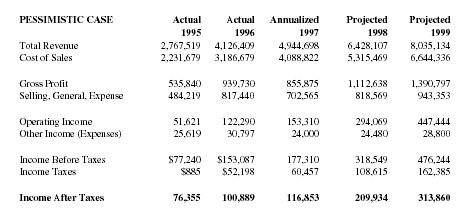
| PESSIMISTIC CASE | Actual | Actual | Annualized | Projected | Projected |
| 1995 | 1996 | 1997 | 1998 | 1999 | |
| Total Revenue | 2,767,519 | 4,126,409 | 4,944,698 | 6,428,107 | 8,035,134 |
| Cost of Sales | 2,231,679 | 3,186,679 | 4,088,822 | 5,315,469 | 6,644,336 |
| Gross Profit | 535,840 | 939,730 | 855,875 | 1,112,638 | 1,390,797 |
| Selling, General, Expense | 484,219 | 817,440 | 702,565 | 818,569 | 943,353 |
| Operating Income | 51,621 | 122,290 | 153,310 | 294,069 | 447,444 |
| Other Income (Expenses) | 25,619 | 30,797 | 24,000 | 24,480 | 28,800 |
| Income Before Taxes | $77,240 | $153,087 | 177,310 | 318,549 | 476,244 |
| Income Taxes | $885 | $52,198 | 60,457 | 108,615 | 162,385 |
| Income After Taxes | 76,355 | 100,889 | 116,853 | 209,934 | 313,860 |
OBJECTIVES & GOALS, AND STRATEGIES FOR ACHIEVING THEM
- To provide a high quality service so that customers will perceive great value.
- To obtain additional funding to fuel continued expansion.
- Our goal is to become one of the premier nationally known retail contractors in the country within three years.
- Smith Contractors plans to closely monitor changing technology to be certain that the company is using the latest and most cost effective equipment and that it keeps up with current trends in the marketplace.
- To provide Smith Contractors with at least $700,000 in retained earning over the next five years.
- Upon request from an existing customer we will become active in the international construction scene.
In addition to the above goals, we will survey our customers and make changes in our programs and add services to meet their changing ideas in the marketplace.
STRATEGIES FOR ACHIEVING GOALS
To achieve the above goals, we will concentrate on providing outstanding quality and continue to bring projects in on time and on budget. Obtaining repeat business is a key to continued success for any contractor serving national retailers. Smith Contractors currently serves nine customers. By the end of 2000 this is expected to increase to twenty. As the Washington economy continues to see rapid growth, Smith Contractors will take advantage of an even greater share of this marketplace than it has in the past. It will be able to capitalize on the reputation it has built on a national level for producing quality projects which come in on time and on budget.
Our major goals include maximizing sales and building our client/customer base with a close eye on profitability.
BUSINESS DESCRIPTION, STATUS, & OUTLOOK
Smith Contractors, Inc. will continue on its current path of growth. Its main office is fully staffed and equipped and able to handle nearly double the amount of sales with little additional expenses. Its first full year of business saw Smith Contractors equal industry averages. Over the next several years, if it meets the modest growth goals outlined in this plan, it will do much better than peer operations. According to the recent newsletter of Store Fixture Manufacturing , monthly retail construction spending has grown from $42 billion to $51 billion during the past year.
The biggest problem this venture will face will be creating customer awareness of our services and funding the growth. We will use a combination of advertising techniques and word of mouth to increase this awareness. Once a general awareness is present, the company has a virtually unlimited growth potential
Until May 1, 1999, subcontractors were paid 90% of their contract at completion of the project prior to or close to Smith Contractors, Inc. receiving its 50% draw minus retainage and prior to billing application two to the owner for 100% minus 10% retainage. The second draw to subcontractors was their 10% retainage plus approved change orders and was paid prior to Smith Contractors receiving 100% minus 10% retainage. This resulted in Smith Contractors financing the majority of its jobs. Effective May 1, 1997, Smith Contractors will pay subcontractors only after it has received 100% minus 10% retainage. The subcontractors then will receive 100% of their contracts minus 10% retainage. Smith Contractors is able to institute these new procedures due to different terms negotiated on new contracts with owners and subcontractors and because of its position and reputation in the industry.
With the implementation of the new billing and payment terms, Smith Contractors has changed dramatically its cash flow position from one of financing the majority of each project's expenses to financing only the 10% retainage and a much smaller percentage of change orders. Smith Contractors will only pay the subcontractors when the owner has paid Smith Contractors up to the final 10% retainage.
The future holds the promise for almost unlimited growth and income as the business matures and considers other markets and products. Complementary products such as international jobs will be considered in the future in response to customer requests.
MANAGEMENT AND OWNERSHIP
John Smith is the majority stockholder and serves as President and C.E.O. of Smith Contractors. He has 30 years' experience in the construction industry and has "hands-on, ground-up" knowledge of all facets of the construction business. He received a degree in home building construction from San Matino College. He completed over 96 additional hours in construction technology at the University of Washington. He has played a key role and functioned in a management capacity in most impact areas of the industry. His supervisory positions in the administrative, operational, technological, and fiscal areas of this discipline have afforded him the skills, experience, and talents necessary to lead Smith Contractors into the new century. John Smith is heavily involved in sales, public relations, banking, personnel, and planning.
Bill Brown is the minority stockholder and serves as Vice President and Consultant to Smith Contractors. He received a M.S. degree in civil engineering from the University of Florida in 1960. He is a licensed civil and structural engineer. He is a senior project manager for the El Martino Texas office. He has a total of more than 40 years of engineering experience. His investment in money and time in Smith Contractors has been critical to its success.
Ralph Brown serves as Director of Construction. He received a B.A. degree from Indiana University in 1990. He now has over ten years of experience in commercial tenant improvement project management in national and local markets. He has handled up to 17 projects at one time. Project experience includes military and government facilities, airports, hospitals, universities, offices, banks, and retail stores. He has managed a project that received a contractor AIA award for "Excellence in Construction." All of his projects have been completed on or ahead of schedule. He has hands-on experience in preparing bids, determination of subcontractor qualifications, and preparation of critical path schedules. He writes and awards all contracts. He is responsible for scheduling of all subcontractors and materials and conducts pre-construction meetings. He supervises all project progress meetings, training superintendents, and is responsible for the certification of all change orders. Ralph is involved in sales, public relations, personnel, operations, planning, purchasing, equipment, and labor.
Mark Brown has been recently hired as the Marketing Manager. He received a M.S. degree from Illinois Tech College, a B.B.A. and B.A. from the University of Oregon. He has over seven years of experience in a variety of high level management positions, working for both private industry and different levels of the United States government. Mark is involved in sales, public relations, advertising, marketing, and planning.
The business is set up as a "C" corporation. This form of legal entity was chosen primarily for liability reasons and makes it easier to secure investors. The company employs nine other highly trained employees in office management and project administration. As the business grows additional part-time or full-time employees may be added to handle the increased workload.
Smith Contractors maintains membership in the Better Business Bureau and the Association of Building Contractors.
MARKET ANALYSIS
MARKET OVERVIEW, SIZE, AND SEGMENTS
Currently, the national market distribution is shared by about fifty plus participants. They are located all over the country. This market segment has been relatively stable over the past five years.
The Washington economy is in the midst of a particularly strong growth period. Many new jobs are being added to the local community. Ever increasing numbers of Californians are coming to this area. All of these factors are cause for a much greater need for retail construction services. All of this activity can only help our kind of business.
Listed below are just some of the reasons that the Washington and the Washington area, in particular, is growing and why it is a good time for a business such as ours.
- The local economy is booming and virtually busting at the seams.• Washington has become a magnet for insurance organizations. More than 65 nationally based insurance organizations are headquartered here. The largest, Allstate, has over 1,200 employees and an operating budget of over $85 million.
- Washington has a new airport and a nearby free trade enterprise zone that should grow and attract even more new businesses.
- The Seattle airport adds an economic boost to the entire state.
- Every week, we see articles in the newspapers of Oregon residents and companies relocating here.
- The world-renowned Four Seasons Hotel is building a new convention facility.
- Sprint and Microsoft are undergoing large increases in their operations here that should add many hundreds of employees.
- Many experts predict King County to become the second fastest growing county in the state between now and the year 2000.
- The local economy is now more diversified than it was when troubles occurred in the local economy in the late 1980s and early 1990s.
The estimated population of King County in 1998 was 685,000 people. The number of households was 275,000. Currently, this market is growing at an annual rate of 3-5%. Projections see this trend continuing through the next decade.
The state of Washington has nearly five million people and is expanding at about 3% per year.
From the above figures it can readily be seen that the potential local market for our services is huge. We feel with our pricing and value we will become one of the premier retail construction companies in the country.
CUSTOMER PROFILE
Our customers are usually large nationally known firms in a variety of fields. Projects that Smith Contractors, Inc. and/or their personnel have managed over the past few years include:
- Roberts, Inc.
- Hodge Foundation
- J. W. Cook Landscaping
- Pugh Engineering
- Braunt Products Ltd.
COMPETITION
The following table summarizes some of the national firms we consider competition:
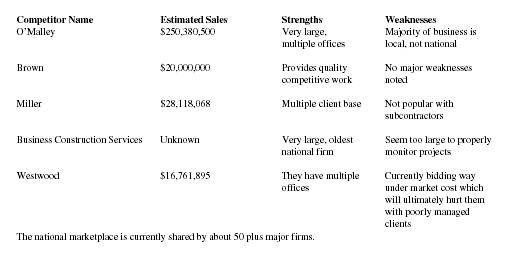
| Competitor Name | Estimated Sales | Strengths | Weaknesses |
| O'Malley | $250,380,500 | Very large, multiple offices | Majority of business is local, not national |
| Brown | $20,000,000 | Provides quality competitive work | No major weaknesses noted |
| Miller | $28,118,068 | Multiple client base | Not popular with subcontractors |
| Business Construction Services | Unknown | Very large, oldest national firm | Seem too large to properly monitor projects |
| Westwood | $16,761,895 | They have multiple offices | Currently bidding way under market cost which will ultimately hurt them with poorly managed clients |
| The national marketplace is currently shared by about 50 plus major firms. | |||
RISK ANALYSIS—STRENGTHS/WEAKNESSES
We feel we have strengths in administration, overall management, human resources, quality of service, operations, servicing, quality of service, company policies, service features, reliability, desirability, and pricing. We appear to be about average in finance/planning, sales force, and overhead. Our minor weaknesses are in the areas of marketing and advertising and finding lenders who will finance receivables. We have just begun to look at this area. We have recently hired a marketing manager to provide expertise and direction. We have obtained the services of a highly qualified business consultant to aid in financial projections, help put together a business plan, and develop strategies to fund future growth. Our staff is highly trained, well motivated and provided with an excellent benefit package. Client issues are given the highest priority. The business is highly competitive and has excellent facilities which are fully equipped. The business is ready for significant increases in sales with little additional need for staff or equipment.
We have low risk exposure in the areas of technology, inflation/interest rates, regulatory environment, local and national economies, management ability, dependence on other companies, location, facilities, and suppliers.
We perceive medium risk exposure in the competitive position, vulnerability to substitutes, financial performance, finance, and planning. We have or will soon retain the services of a full-time marketing manager, a full-time controller, and a business consultant to help in various areas such as marketing, financial controls, and general overall business operation advice. We do not perceive any high risks associated with our company.
Since we are still a relatively new business we will continue to obtain help when needed in areas necessary to complement our abilities.
MARKETING STRATEGIES
PRICING AND VALUE
Pricing is based upon subcontractors price plus overhead and profit. Prices are driven by competition. Current competition dictates a percent of mark-up. We currently win about one-third of the projects we bid on. We come in second on nearly seventy percent of the rest of the jobs we bid on.
At this point there is a certain amount of price inelasticity in this service. Customers are very sensitive to pricing changes. With the current level of competition we must be careful not to price ourselves out of the market. On the other hand, if we offer additional services we can open up other opportunities to increase income. Pricing will be reviewed on a monthly basis.
SELLING TACTICS
Our company's marketing strategy will incorporate plans to promote our line of services through several different channels and on different levels of use. We make use of referrals, cold calls, visits to customers and advertising. We plan to utilize our website as a selling tool.
Advertising tools we will utilize include brochures, catalogs, targeted advertisements, lead generation, lead referral and follow-up systems, information gathering, and dissemination. To better reach the local market we will meet with building owners and property managers to present our track record of success. In addition, we will advertise in Washington and Oregon newspapers, local trade journals, and business newspapers that target business clientele. We will join the local association for property managers.
Nationally, we will advertise by way of our brochure that will be sent to potential clients. We will advertise through the Internet. If any interest is shown, we will invite them to tour our facilities and meet our professional staff.
ADVERTISING, PROMOTION, AND DISTRIBUTION OF SERVICES
We recognize that the key to success at this time requires extensive promotion. Advertising goals include all of the following:
- Position the company to become one of the premier retail contractors in the country.
- Increase general awareness of our company both locally and nationally.
- Increase general awareness of our company and its outstanding track record.
- Maximize efficiency by continually monitoring media effectiveness.
- Maintain an ad in the Yellow Pages in Spokane and Seattle and consider an ad in the Internet Yellow Pages.
- Continually update our brochure to explain our service and company.
- Consider using a direct mail approach.
- Use a mix of media to saturate the marketplace.
PUBLIC RELATIONS
We will develop a public relations policy that will help increase awareness of our company and product. To achieve these goals we will consider some or all of the following:
Develop a press release and a company backgrounder as a public relations tool.
Develop a telephone script to handle customer and advertiser contacts.
Develop a survey to be completed by customers to help determine the following:
- How did they hear about us?
- What influenced them to use our service?
- How well did our service satisfy their needs?
- How efficient was our service?
- Did they have any problems getting through to us?
- Did they shop competitors before selecting us?
- How did they initially perceive our company and product?
- Where are most of our customers located?
- Do they have suggestions for improving our service or our approach to advertising?
- What additional services would they like us to offer?11.Would they recommend us to others?
SMITH CONTRACTORS, INC.
Throughout this business plan we have taken a very conservative approach to developing our financial projections.
ASSUMPTIONS, DEFINITIONS, AND NOTES
The following assumptions were used in preparing the projections in this business plan:
- Inflation rates to remain stable at 3-5%.
- Assume growth rates of 30% and 25% for 1998 and 1999 respectively.
- Robust national and local economies.
- Interest rates to remain flat and basically unchanged.
- Payroll taxes and benefits will equal 26.43% of total payroll expenses.
- Assumes outstanding debt of $800,000 will remain in place.
- Office supplies/postage expenses are set at .00327 of monthly income.
- Contingency and miscellaneous expenses are set at 5% of total income.
- Telephone and utilities expense are set at .0063285 of total sales.
- Assumes growth in sales of 30% and 25% for 1998 and 1999 respectively.
- Assumes cost of sales/subcontractors will remain at 82.69% of sales.
- In 1998 and 1999 the same seasonality will be maintained as was shown for 1997.
-
The following expenses will increase by 5% in 1998 and 1999:
—Salaries, Officer
—Salaries-Office
—Blueprint Supplies
—Gas and Oil
—Licenses
—Rent - Office maintenance and improvements will be .00083 of sales for 1997-1999.
- Computer expenses will be .00077 of sales.
- Vehicle expenses will be .002005 of sales.
- Vehicle leases will be .0034402 of sales.
- Entertainment will be maintained at .0009163 of sales.
- Freight will be .005096 of sales for 1997-1999.
- Travel will be .0040424 of sales.
- Employee business expenses will be .0026239.
- Insurance will be .0129505 of sales.
- Advertising/Public Relations will be .0032013 of sales for 1997-1999.
- Professional services will be .0122461.
- Equipment leases will be .0073654 of sales.
- Subscriptions and memberships will be .0001402 of sales.
- Income taxes for 1997-1999 will be .3409693 of gross income.
FINANCIAL PLANS
Five-Year Financial Summary —Financial Inputs & Summary
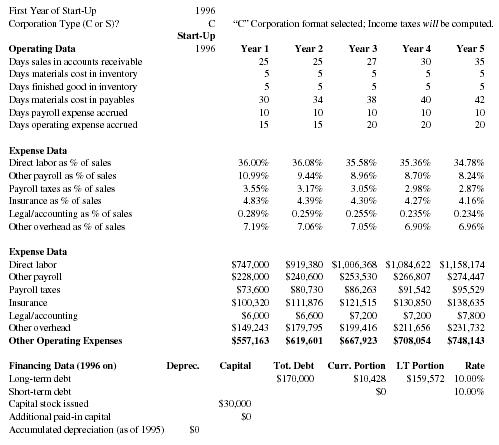
| First Year of Start-Up | 1996 | |||||
| Corporation Type (C or S)? | C | "C" Corporation format selected; Income taxes will be computed. | ||||
| Start-Up | ||||||
| Operating Data | 1996 | Year 1 | Year 2 | Year 3 | Year 4 | Year 5 |
| Days sales in accounts receivable | 25 | 25 | 27 | 30 | 35 | |
| Days materials cost in inventory | 5 | 5 | 5 | 5 | 5 | |
| Days finished good in inventory | 5 | 5 | 5 | 5 | 5 | |
| Days materials cost in payables | 30 | 34 | 38 | 40 | 42 | |
| Days payroll expense accrued | 10 | 10 | 10 | 10 | 10 | |
| Days operating expense accrued | 15 | 15 | 20 | 20 | 20 | |
| Expense Data | ||||||
| Direct labor as % of sales | 36.00% | 36.08% | 35.58% | 35.36% | 34.78% | |
| Other payroll as % of sales | 10.99% | 9.44% | 8.96% | 8.70% | 8.24% | |
| Payroll taxes as % of sales | 3.55% | 3.17% | 3.05% | 2.98% | 2.87% | |
| Insurance as % of sales | 4.83% | 4.39% | 4.30% | 4.27% | 4.16% | |
| Legal/accounting as % of sales | 0.289% | 0.259% | 0.255% | 0.235% | 0.234% | |
| Other overhead as % of sales | 7.19% | 7.06% | 7.05% | 6.90% | 6.96% | |
| Expense Data | ||||||
| Direct labor | $747,000 | $919,380 | $1,006,368 | $1,084,622 | $1,158,174 | |
| Other payroll | $228,000 | $240,600 | $253,530 | $266,807 | $274,447 | |
| Payroll taxes | $73,600 | $80,730 | $86,263 | $91,542 | $95,529 | |
| Insurance | $100,320 | $111,876 | $121,515 | $130,850 | $130,635 | |
| Legal/accounting | $6,000 | $6,600 | $7,200 | $7,200 | $7,800 | |
| Other overhead | $149,243 | $179,795 | $199,416 | $211,656 | $231,732 | |
| Other Operating Expenses | $557,163 | $619,601 | $667,923 | $708,054 | $748,143 | |
| Financing Data (1996 on) | Deprec. | Capital | Tot. Debt | Curr. Portion | LT Portion | Rate |
| Long-term debt | $170,000 | $10,428 | $159,572 | 10.00% | ||
| Short-term debt | $0 | 10.00% | ||||
| Capital stock issued | $30,000 | |||||
| Additional paid-in capital | $0 | |||||
| Accumulated depreciation (as of 1995) | $0 | |||||
Five-Year Financial Summary—Balance Sheet
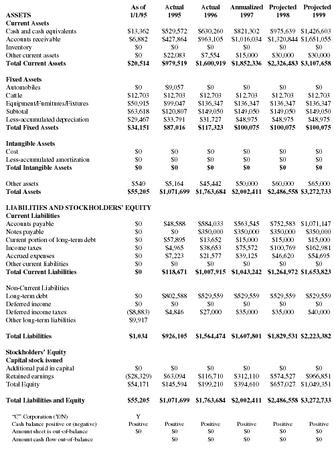
| ASSETS | As of 1/1/95 | Actual 1995 | Actual 1996 | Annualized 1997 | Projected 1998 | Projected 1999 |
| Current Assets | ||||||
| Cash and cash equivalents | $13,362 | $529,572 | $630,260 | $821,302 | $975,639 | $1,426,603 |
| Accounts receivable | $6,882 | $427,864 | $963,105 | $1,016,034 | $1,320,844 | $1,651,055 |
| Inventory | $0 | $0 | $0 | $0 | $0 | $0 |
| Other current assets | $0 | $22,083 | $7,554 | $15,000 | $30,000 | $30,000 |
| Total Current Assets | $20,514 | $979,519 | $1,600,919 | $1,852,336 | $2,326,483 | $3,107,658 |
| Fixed Assets | ||||||
| Automobiles | $0 | $9,057 | $0 | $0 | $0 | $0 |
| Cattle | $12,703 | $12,703 | $12,703 | $12,703 | $12,703 | $12,703 |
| Equipment/Furnitures/Fixtures | $50,915 | $99,047 | $136,347 | $136,347 | $136,347 | $136,347 |
| Subtotal | $63,618 | $120,807 | $149,050 | $149,050 | $149,050 | $149,050 |
| Less-accumulated depreciation | $29,467 | $33,791 | $31,727 | $48,975 | $48,975 | $48,975 |
| Total Fixed Assets | $34,151 | $87,016 | $117,323 | $100,075 | $100,075 | $100,075 |
| Intangible Assets | ||||||
| Cost | $0 | $0 | $0 | $0 | $0 | $0 |
| Less-accumulated amortization | $0 | $0 | $0 | $0 | $0 | $0 |
| Total Intangible Assets | $0 | $0 | $0 | $0 | $0 | $0 |
| Other assets | $540 | $5,164 | $45,442 | $50,000 | $60,000 | $65,000 |
| Total Assets | $55,205 | $1,071,699 | $1,763,684 | $2,002,411 | $2,486,558 | $3,272,733 |
| LIABILITIES AND STOCKHOLDERS 'EQUITY | ||||||
| Current Liabilities | ||||||
| Accounts payable | $0 | $48,588 | $584,033 | $563,545 | $752,583 | $1,071,147 |
| Notes payable | $0 | $0 | $350,000 | $350,000 | $350,000 | $350,000 |
| Current portion of long-term debt | $0 | $57,895 | $13,652 | $15,000 | $15,000 | $15,000 |
| Income taxes | $0 | $4,965 | $38,653 | $75,572 | $100,769 | $162,981 |
| Accrued expenses | $0 | $7,223 | $21,577 | $39,125 | $46,620 | $54,695 |
| Other current liabilities | $0 | $0 | $0 | $0 | $0 | $0 |
| Total Current Liabilities | $0 | $118,671 | $1,007,915 | $1,043,242 | $1,264,972 | $1,653,823 |
| Non-Current Liabilities | ||||||
| Long-term debt | $0 | $802,588 | $529,559 | $529,559 | $529,559 | $529,559 |
| Deferred income | $0 | $0 | $0 | $0 | $0 | $0 |
| Deferred income taxes | ($8,883) | $4,846 | $27,000 | $35,000 | $35,000 | $40,000 |
| Other long-term liabilities | $9,917 | |||||
| Total Liabilities | $1,034 | $926,105 | $1,564,474 | $1,607,801 | $1,829,531 | $2,223,382 |
| Stockholders' Equity Capital stock issued | ||||||
| Additional paid in capital | $0 | $0 | $0 | $0 | $0 | $0 |
| Retained earnings | ($28,329) | $63,094 | $116,710 | $312,110 | $574,527 | $966,851 |
| Total Equity | $54,171 | $145,594 | $199,210 | $394,610 | $657,027 | $1,049,351 |
| Total Liabilities and Equity | $55,205 | $1,071,699 | $1,763,684 | $2,002,411 | $2,486,558 | $3,272,733 |
| "C" Corporation (Y/N) | Y | |||||
| Cash balance positive or (negative) | Positive | Positive | Positive | Positive | Positive | Positive |
| Amount sheet is out-of-balance | $0 | $0 | $0 | $0 | $0 | $0 |
| Amount cash flow out-of-balance | $0 | $0 | $0 | $0 | $0 | |
Five-Year Financial Summary—Income Statement
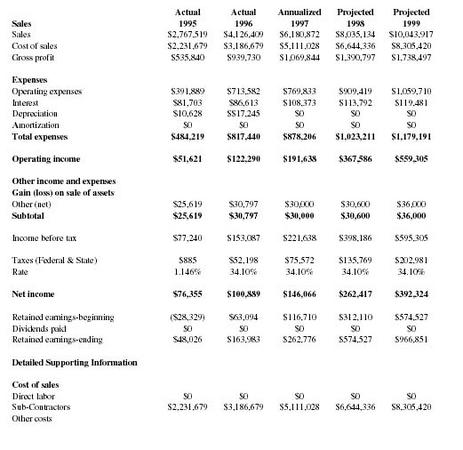
| Sales | Actual 1995 | Actual 1996 | Annualized 1997 | Projected 1998 | Projected 1999 |
| Sales | $2,767,519 | $4,126,409 | $6,180,872 | $8,035,134 | $10,043,917 |
| Cost of sales | $2,231,679 | $3,186,679 | $5,111,028 | $6,644,336 | $8,305,420 |
| Gross profit | $535,840 | $939,730 | $1,069,844 | $1,390,797 | $1,738,497 |
| Expenses | |||||
| Operating expenses | $391,889 | $713,582 | $769,833 | $909,419 | $1,059,710 |
| Interest | $81,703 | $86,613 | $108,373 | $113,792 | $119,481 |
| Depreciation | $10,628 | $$17,245 | $0 | $0 $0 | |
| Amortization | $0 | $0 | $0 | $0 | $0 |
| Total expenses | $484,219 | $817,440 | $878,206 | $1,023,211 | $1,179,191 |
| Operating income | $51,621 | $122,290 | $191,638 | $367,586 | $559,305 |
| Other income and expenses | |||||
| Gain (loss) on sale of assets | |||||
| Other (net) | $25,619 | $30,797 | $30,000 | $30,600 | $36,000 |
| Subtotal | $25,619 | $30,797 | $30,000 | $30,600 | $36,000 |
| Income before tax | $77,240 | $153,087 | $221,638 | $398,186 | $595,305 |
| Taxes (Federal & State) | $885 | $52,198 | $75,572 | $135,769 | $202,981 |
| Rate | 1.146% | 34.10% | 34.10% | 34.10% | 34.10% |
| Net income | $76,355 | $100,889 | $146,066 | $262,417 | $392,324 |
| Retained earnings-beginning | ($28,329) | $63,094 | $116,710 | $312,110 | $574,527 |
| Dividends paid | $0 | $0 | $0 | $0 | $0 |
| Retained earnings-ending | $48,026 | $163,983 | $262,776 | $574,527 | $966,851 |
| Detailed Supporting Information | |||||
| Cost of sales | |||||
| Direct labor | $0 | $0 | $0 | $0 | $0 |
| Sub-Contractors | $2,231,679 | $3,186,679 | $5,111,028 | $6,644,336 | $8,305,420 |
| Other costs | |||||
Five-Year Financial Summary—Cash Flow Sheet
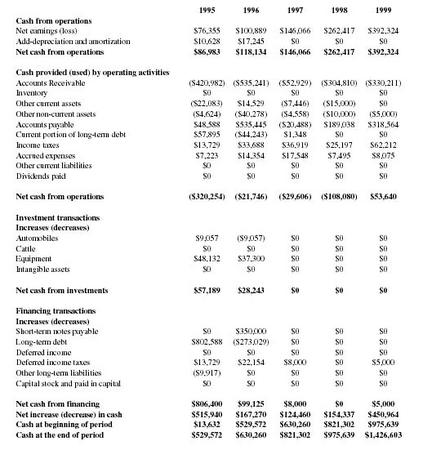
| 1995 | 1996 | 1997 | 1998 | 1999 | |
| Cash from operations | |||||
| Net earnings (loss) | $76,355 | $100,889 | $146,066 | $262,417 | $392,324 |
| Add-depreciation and amortization | $10,628 | $17,245 | $0 | $0 | $0 |
| Net cash from operations | $86,983 | $118,134 | $146,066 | $262,417 | $392,324 |
| Cash provided (used) by operating activities | |||||
| Accounts Receivable | ($420,982) | ($535,241) | ($52,929) | ($304,810) | ($330,211) |
| Inventory | $0 | $0 | $0 | $0 | $0 |
| Other current assets | ($22,083) | $14,529 | ($7,446) | ($15,000) | $0 |
| Other non-current assets | ($4,624) | ($40,278) | ($4,558) | ($10,000) | ($5,000) |
| Accounts payable | $48,588 | $535,445 | ($20,488) | $189,038 | $318,564 |
| Current portion of long-term debt | $57,895 | ($44,243) | $1,348 | $0 | $0 |
| Income taxes | $13,729 | $33,688 | $36,919 | $25,197 | $62,212 |
| Accrued expenses | $7,223 | $14,354 | $17,548 | $7,495 | $8,075 |
| Other current liabilities | $0 | $0 | $0 | $0 | $0 |
| Dividends paid | $0 | $0 | $0 | $0 | $0 |
| Net cash from operations | ($320,254) | ($21,746) | ($29,606) | ($108,080) | $53,640 |
| Investment transactions | |||||
| Increases (decreases) | |||||
| Automobiles | $9,057 | ($9,057) | $0 | $0 | $0 |
| Cattle | $0 | $0 | $0 | $0 | $0 |
| Equipment | $48,132 | $37,300 | $0 | $0 | $0 |
| Intangible assets | $0 | $0 | $0 | $0 | $0 |
| Net cash from investments | $57,189 | $28,243 | $0 | $0 | $0 |
| Financing transactions | |||||
| Increases (decreases) | |||||
| Short-term notes payable | $0 | $350,000 | $0 | $0 | $0 |
| Long-term debt | $802,588 | ($273,029) | $0 | $0 | $0 |
| Deferred income | $0 | $0 | $0 | $0 | $0 |
| Deferred income taxes | $13,729 | $22,154 | $8,000 | $0 | $5,000 |
| Other long-term liabilities | ($9,917) | $0 | $0 | $0 | $0 |
| Capital stock and paid in capital | $0 | $0 | $0 | $0 | $0 |
| Net cash from financing | $806,400 | $99,125 | $8,000 | $0 | $5,000 |
| Net increase (decrease) in cash | $515,940 | $167,270 | $124,460 | $154,337 | $450,964 |
| Cash at beginning of period | $13,632 | $529,572 | $630,260 | $821,302 | $975,639 |
| Cash at the end of period | $529,572 | $630,260 | $821,302 | $975,639 | $1,426,603 |
This page left intentionally blank to accommodate tabular matter following.
Cash Flow Projection - First Year
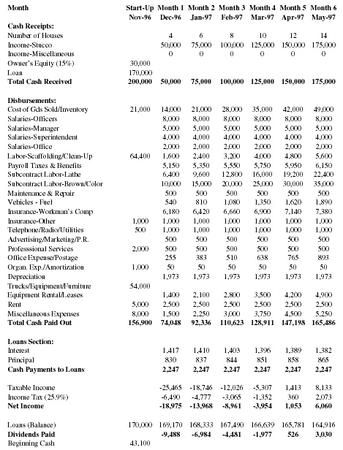
| Month | Start-Up | Month 1 | Month 2 | Month 3 | Month 4 | Month 5 | Month 6 |
| Nov-96 | Dec-96 | Jan-97 | Feb-97 | Mar-97 | Apr-97 | May-97 | |
| Cash Receipts: | |||||||
| Number of Houses | 4 | 6 | 8 | 10 | 12 | 14 | |
| Income-Stucco | 50,000 | 75,000 | 100,000 | 125,000 | 150,000 | 175,000 | |
| Income-Miscellaneous | 0 | 0 | 0 | 0 | 0 | 0 | |
| Owner's Equity (15%) | 30,000 | ||||||
| Loan | 170,000 | ||||||
| Total Cash Received | 200,000 | 50,000 | 75,000 | 100,000 | 125,000 | 150,000 | 175,000 |
| Disbursements: | |||||||
| Cost of Gds Sold/Inventory | 21,000 | 14,000 | 21,000 | 28,000 | 35,000 | 42,000 | 49,000 |
| Salaries-Officers | 8,000 | 8,000 | 8,000 | 8,000 | 8,000 | 8,000 | |
| Salaries-Manager | 5,000 | 5,000 | 5,000 | 5,000 | 5,000 | 5,000 | |
| Salaries-Superintendent | 4,000 | 4,000 | 4,000 | 4,000 | 4,000 | 4,000 | |
| Salaries-Office | 2,000 | 2,000 | 2,000 | 2,000 | 2,000 | 2,000 | |
| Labor-Scaffolding/Clean-Up | 64,400 | 1,600 | 2,400 | 3,200 | 4,000 | 4,800 | 5,600 |
| Payroll Taxes & Benefits | 5,150 | 5,350 | 5,550 | 5,750 | 5,950 | 6,150 | |
| Subcontract Labor-Lathe | 6,400 | 9,600 | 12,800 | 16,000 | 19,200 | 22,400 | |
| Subcontract Labor-Brown/Color | 10,000 | 15,000 | 20,000 | 25,000 | 30,000 | 35,000 | |
| Maintenance & Repair | 500 | 500 | 500 | 500 | 500 | 500 | |
| Vehicles - Fuel | 540 | 810 | 1,080 | 1,350 | 1,620 | 1,890 | |
| Insurance-Workman's Comp | 6,180 | 6,420 | 6,660 | 6,900 | 7,140 | 7,380 | |
| Insurance-Other | 1,000 | 1,000 | 1,000 | 1,000 | 1,000 | 1,000 | 1,000 |
| Telephone/Radio/Utilities | 500 | 1,000 | 1,000 | 1,000 | 1,000 | 1,000 | 1,000 |
| Advertising/Marketing/P.R. | 500 | 500 | 500 | 500 | 500 | 500 | |
| Professsional Services | 2,000 | 500 | 500 | 500 | 500 | 500 | 500 |
| Office Expense/Postage | 255 | 383 | 510 | 638 | 765 | 893 | |
| Organ. Exp./Amortization | 1,000 | 50 | 50 | 50 | 50 | 50 | 50 |
| Depreciation | 1,973 | 1,973 | 1,973 | 1,973 | 1,973 | 1,973 | |
| Trucks/Equipment/Furniture | 54,000 | ||||||
| Equipment Rental/Leases | 1,400 | 2,100 | 2,800 | 3,500 | 4,200 | 4,900 | |
| Rent | 5,000 | 2,500 | 2,500 | 2,500 | 2,500 | 2,500 | 2,500 |
| Miscellaneous Expenses | 8,000 | 1,500 | 2,250 | 3,000 | 3,750 | 4,500 | 5,250 |
| Total Cash Paid Out | 156,900 | 74,048 | 92,336 | 110,623 | 128,911 | 147,198 | 165,486 |
| Loans Section: | |||||||
| Interest | 1,417 | 1,410 | 1,403 | 1,396 | 1,389 | 1,382 | |
| Principal | 830 | 837 | 844 | 851 | 858 | 865 | |
| Cash Payments to Loans | 2,247 | 2,247 | 2,247 | 2,247 | 2,247 | 2,247 | |
| Taxable Income | -25,465 | -18,746 | -12,026 | -5,307 | 1,413 | 8,133 | |
| Income Tax (25.9%) | -6,490 | -4,777 | -3,065 | -1,352 | 360 | 2,073 | |
| Net Income | -18,975 | -13,968 | -8,961 | -3,954 | 1,053 | 6,060 | |
| Loans (Balance) | 170,000 | 169,170 | 168,333 | 167,490 | 166,639 | 165,781 | 164,916 |
| Dividends Paid | -9,488 | -6,984 | -4,481 | -1,977 | 526 | 3,030 | |
| Beginning Cash | 43,100 | ||||||
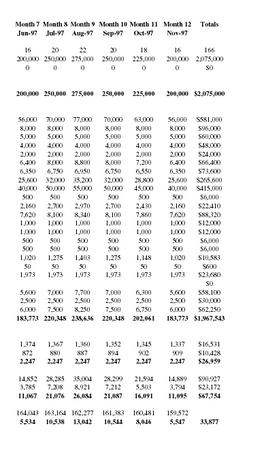
| Month 7 | Month 8 | Month 9 | Month 10 | Month 11 | Month 12 | Totals |
| Jun-97 | Jul-97 | Aug-97 | Sep-97 | Oct-97 | Nov-97 | |
| 16 | 20 | 22 | 20 | 18 | 16 | 166 |
| 200,000 | 250,000 | 275,000 | 250,000 | 225,000 | 200,000 | 2,075,000 |
| 0 | 0 | 0 | 0 | 0 | 0 | $0 |
| 200,000 | 250,000 | 275,000 | 250,000 | 225,000 | 200,000 | $2,075,000 |
| 56,000 | 70,000 | 77,000 | 70,000 | 63,000 | 56,000 | $581,000 |
| 8,000 | 8,000 | 8,000 | 8,000 | 8,000 | 8,000 | $96,000 |
| 5,000 | 5,000 | 5,000 | 5,000 | 5,000 | 5,000 | $60,000 |
| 4,000 | 4,000 | 4,000 | 4,000 | 4,000 | 4,000 | $48,000 |
| 2,000 | 2,000 | 2,000 | 2,000 | 2,000 | 2,000 | $24,000 |
| 6,400 | 8,000 | 8,800 | 8,000 | 7,200 | 6,400 | $66,400 |
| 6,350 | 6,750 | 6,950 | 6,750 | 6,550 | 6,350 | $73,600 |
| 25,600 | 32,000 | 35,200 | 32,000 | 28,800 | 25,600 | $265,600 |
| 40,000 | 50,000 | 55,000 | 50,000 | 45,000 | 40,000 | $415,000 |
| 500 | 500 | 500 | 500 | 500 | 500 | $6,000 |
| 2,160 | 2,700 | 2,970 | 2,700 | 2,430 | 2,160 | $22,410 |
| 7,620 | 8,100 | 8,340 | 8,100 | 7,860 | 7,620 | $88,320 |
| 1,000 | 1,000 | 1,000 | 1,000 | 1,000 | 1,000 | $12,000 |
| 1,000 | 1,000 | 1,000 | 1,000 | 1,000 | 1,000 | $12,000 |
| 500 | 500 | 500 | 500 | 500 | 500 | $6,000 |
| 500 | 500 | 500 | 500 | 500 | 500 | $6,000 |
| 1,020 | 1,275 | 1,403 | 1,275 | 1,148 | 1,020 | $10,583 |
| 50 | 50 | 50 | 50 | 50 | 50 | $600 |
| 1,973 | 1,973 | 1,973 | 1,973 | 1,973 | 1,973 | $23,680 |
| $0 | ||||||
| 5,600 | 7,000 | 7,700 | 7,000 | 6,300 | 5,600 | $58,100 |
| 2,500 | 2,500 | 2,500 | 2,500 | 2,500 | 2,500 | $30,000 |
| 6,000 | 7,500 | 8,250 | 7,500 | 6,750 | 6,000 | $62,250 |
| 183,773 | 220,348 | 238,636 | 220,348 | 202,061 | 183,773 | $1,967,543 |
| 1,374 | 1,367 | 1,360 | 1,352 | 1,345 | 1,337 | $16,531 |
| 872 | 880 | 887 | 894 | 902 | 909 | $10,428 |
| 2,247 | 2,247 | 2,247 | 2,247 | 2,247 | 2,247 | $26,959 |
| 14,852 | 28,285 | 35,004 | 28,299 | 21,594 | 14,889 | $90,927 |
| 3,785 | 7,208 | 8,921 | 7,212 | 5,503 | 3,794 | $23,172 |
| 11,067 | 21,076 | 26,084 | 21,087 | 16,091 | 11,095 | $67,754 |
| 164,043 | 163,164 | 162,277 | 161,383 | 160,481 | 159,572 | |
| 5,534 | 10,538 | 13,042 | 10,544 | 8,046 | 5,547 | 33,877 |
Cash Flow Projection - Second Year
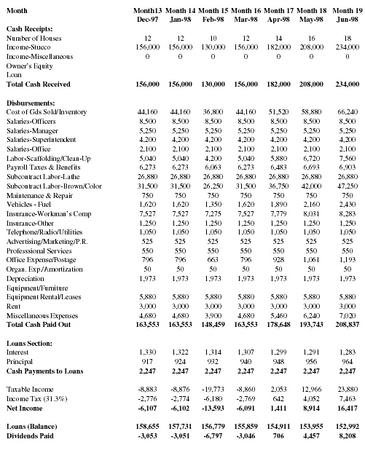
| Month | Month 13 | Month 14 | Month 15 | Month 16 | Month 17 | Month 18 | Month 19 |
| Dec-97 | Jan-98 | Feb-98 | Mar-98 | Apr-98 | May-98 | Jun-98 | |
| Cash Receipts: | |||||||
| Number of Houses | 12 | 12 | 10 | 12 | 14 | 16 | 18 |
| Income-Stucco | 156,000 | 156,000 | 130,000 | 156,000 | 182,000 | 208,000 | 234,000 |
| Income-Miscellaneous | 0 | 0 | 0 | 0 | 0 | 0 | 0 |
| Owner's Equity | |||||||
| Loan | |||||||
| Total Cash Received | 156,000 | 156,000 | 130,000 | 156,000 | 182,000 | 208,000 | 234,000 |
| Disbursements: | |||||||
| Cost of Gds Sold/Inventory | 44,160 | 44,160 | 36,800 | 44,160 | 51,520 | 58,880 | 66,240 |
| Salaries-Officers | 8,500 | 8,500 | 8,500 | 8,500 | 8,500 | 8,500 | 8,500 |
| Salaries-Manager | 5,250 | 5,250 | 5,250 | 5,250 | 5,250 | 5,250 | 5,250 |
| Salaries-Superintendent | 4,200 | 4,200 | 4,200 | 4,200 | 4,200 | 4,200 | 4,200 |
| Salaries-Office | 2,100 | 2,100 | 2,100 | 2,100 | 2,100 | 2,100 | 2,100 |
| Labor-Scaffolding/Clean-Up | 5,040 | 5,040 | 4,200 | 5,040 | 5,880 | 6,720 | 7,560 |
| Payroll Taxes & Benefits | 6,273 | 6,273 | 6,063 | 6,273 | 6,483 | 6,693 | 6,903 |
| Subcontract Labor-Lathe | 26,880 | 26,880 | 26,880 | 26,880 | 26,880 | 26,880 | 26,880 |
| Subcontract Labor-Brown/Color | 31,500 | 31,500 | 26,250 | 31,500 | 36,750 | 42,000 | 47,250 |
| Maintenance & Repair | 750 | 750 | 750 | 750 | 750 | 750 | 750 |
| Vehicles - Fuel | 1,620 | 1,620 | 1,350 | 1,620 | 1,890 | 2,160 | 2,430 |
| Insurance-Workman's Comp | 7,527 | 7,527 | 7,275 | 7,527 | 7,779 | 8,031 | 8,283 |
| Insurance-Other | 1,250 | 1,250 | 1,250 | 1,250 | 1,250 | 1,250 | 1,250 |
| Telephone/Radio/Utilities | 1,050 | 1,050 | 1,050 | 1,050 | 1,050 | 1,050 | 1,050 |
| Advertising/Marketing/P.R. | 525 | 525 | 525 | 525 | 525 | 525 | 525 |
| Professsional Services | 550 | 550 | 550 | 550 | 550 | 550 | 550 |
| Office Expense/Postage | 796 | 796 | 663 | 796 | 928 | 1,061 | 1,193 |
| Organ. Exp./Amortization | 50 | 50 | 50 | 50 | 50 | 50 | 50 |
| Depreciation | 1,973 | 1,973 | 1,973 | 1,973 | 1,973 | 1,973 | 1,973 |
| Equipment/Furniture | |||||||
| Equipment Rental/Leases | 5,880 | 5,880 | 5,880 | 5,880 | 5,880 | 5,880 | 5,880 |
| Rent | 3,000 | 3,000 | 3,000 | 3,000 | 3,000 | 3,000 | 3,000 |
| Miscellaneous Expenses | 4,680 | 4,680 | 3,900 | 4,680 | 5,460 | 6,240 | 7,020 |
| Total Cash Paid Out | 163,553 | 163,553 | 148,459 | 163,553 | 178,648 | 193,743 | 208,837 |
| Loans Section: | |||||||
| Interest | 1,330 | 1,322 | 1,314 | 1,307 | 1,299 | 1,291 | 1,283 |
| Principal | 917 | 924 | 932 | 940 | 948 | 956 | 964 |
| Cash Payments to Loans | 2,247 | 2,247 | 2,247 | 2,247 | 2,247 | 2,247 | 2,247 |
| Taxable Income | -8,883 | -8,876 | -19,773 | -8,860 | 2,053 | 12,966 | 23,880 |
| Income Tax (31.3%) | -2,776 | -2,774 | -6,180 | -2,769 | 642 | 4,052 | 7,463 |
| Net Income | -6,107 | -6,102 | -13,593 | -6,091 | 1,411 | 8,914 | 16,417 |
| Loans (Balance) | 158,655 | 157,731 | 156,779 | 155,859 | 154,911 | 153,955 | 152,992 |
| Dividends Paid | -3,053 | -3,051 | -6,797 | -3,046 | 706 | 4,457 | 8,208 |
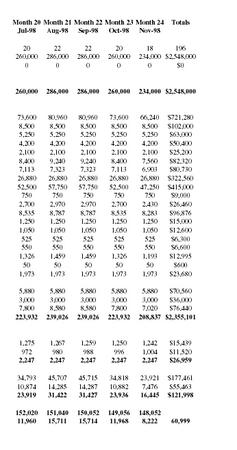
| Month 20 | Month 21 | Month 22 | Month 23 | Month 24 | Totals |
| Jul-98 | Aug-98 | Sep-98 | Oct-98 | Nov-98 | |
| 20 | 22 | 22 | 20 | 18 | 196 |
| 260,000 | 286,000 | 286,000 | 260,000 | 234,000 | $2,548,000 |
| 0 | 0 | 0 | 0 | 0 | $0 |
| 260,000 | 286,000 | 286,000 | 260,000 | 234,000 | $2,548,000 |
| 73,600 | 80,960 | 80,960 | 73,600 | 66,240 | $721,280 |
| 8,500 | 8,500 | 8,500 | 8,500 | 8,500 | $102,000 |
| 5,250 | 5,250 | 5,250 | 5,250 | 5,250 | $63,000 |
| 4,200 | 4,200 | 4,200 | 4,200 | 4,200 | $50,400 |
| 2,100 | 2,100 | 2,100 | 2,100 | 2,100 | $25,200 |
| 8,400 | 9,240 | 9,240 | 8,400 | 7,560 | $82,320 |
| 7,113 | 7,323 | 7,323 | 7,113 | 6,903 | $80,730 |
| 26,880 | 26,880 | 26,880 | 26,880 | 26,880 | $322,560 |
| 52,500 | 57,750 | 57,750 | 52,500 | 47,250 | $415,000 |
| 750 | 750 | 750 | 750 | 750 | $9,000 |
| 2,700 | 2,970 | 2,970 | 2,700 | 2,430 | $26,460 |
| 8,535 | 8,787 | 8,787 | 8,535 | 8,283 | $96,876 |
| 1,250 | 1,250 | 1,250 | 1,250 | 1,250 | $15,000 |
| 1,050 | 1,050 | 1,050 | 1,050 | 1,050 | $12,600 |
| 525 | 525 | 525 | 525 | 525 | $6,300 |
| 550 | 550 | 550 | 550 | 550 | $6,600 |
| 1,326 | 1,459 | 1,459 | 1,326 | 1,193 | $12,995 |
| 50 | 50 | 50 | 50 | 50 | $600 |
| 1,973 | 1,973 | 1,973 | 1,973 | 1,973 | $23,680 |
| 5,880 | 5,880 | 5,880 | 5,880 | 5,880 | $70,560 |
| 3,000 | 3,000 | 3,000 | 3,000 | 3,000 | $36,000 |
| 7,800 | 8,580 | 8,580 | 7,800 | 7,020 | $76,440 |
| 223,932 | 239,026 | 239,026 | 223,932 | 208,837 | $2,355,101 |
| 1,275 | 1,267 | 1,259 | 1,250 | 1,242 | $15,439 |
| 972 | 980 | 988 | 996 | 1,004 | $11,520 |
| 2,247 | 2,247 | 2,247 | 2,247 | 2,247 | $26,959 |
| 34,793 | 45,707 | 45,715 | 34,818 | 23,921 | $177,461 |
| 10,874 | 14,285 | 14,287 | 10,882 | 7,476 | $55,463 |
| 23,919 | 31,422 | 31,427 | 23,936 | 16,445 | $121,998 |
| 152,020 | 151,040 | 150,052 | 149,056 | 148,052 | |
| 11,960 | 15,711 | 15,714 | 11,968 | 8,222 | 60,999 |
Cash Flow Projection - Third Year
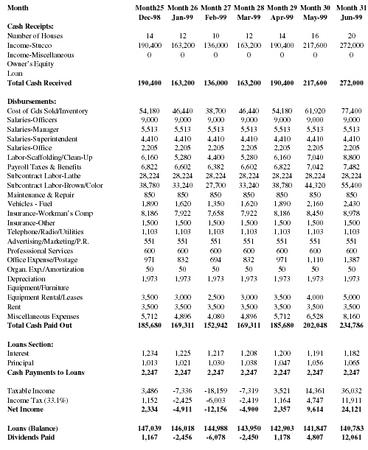
| Month | Month 25 | Month 26 | Month 27 | Month 28 | Month 29 | Month 30 | Month 31 |
| Dec-98 | Jan-99 | Feb-99 | Mar-99 | Apr-99 | May-99 | Jun-99 | |
| Cash Receipts: | |||||||
| Number of Houses | 14 | 12 | 10 | 12 | 14 | 16 | 20 |
| Income-Stucco | 190,400 | 163,200 | 136,000 | 163,200 | 190,400 | 217,600 | 272,000 |
| Income-Miscellaneous | 0 | 0 | 0 | 0 | 0 | 0 | 0 |
| Owner's Equity | |||||||
| Loan | |||||||
| Total Cash Received | 190,400 | 163,200 | 136,000 | 163,200 | 190,400 | 217,600 | 272,000 |
| Disbursements: | |||||||
| Cost of Gds Sold/Inventory | 54,180 | 46,440 | 38,700 | 46,440 | 54,180 | 61,920 | 77,400 |
| Salaries-Officers | 9,000 | 9,000 | 9,000 | 9,000 | 9,000 | 9,000 | 9,000 |
| Salaries-Manager | 5,513 | 5,513 | 5,513 | 5,513 | 5,513 | 5,513 | 5,513 |
| Salaries-Superintendent | 4,410 | 4,410 | 4,410 | 4,410 | 4,410 | 4,410 | 4,410 |
| Salaries-Office | 2,205 | 2,205 | 2,205 | 2,205 | 2,205 | 2,205 | 2,205 |
| Labor-Scaffolding/Clean-Up | 6,160 | 5,280 | 4,400 | 5,280 | 6,160 | 7,040 | 8,800 |
| Payroll Taxes & Benefits | 6,822 | 6,602 | 6,382 | 6,602 | 6,822 | 7,042 | 7,482 |
| Subcontract Labor-Lathe | 28,224 | 28,224 | 28,224 | 28,224 | 28,224 | 28,224 | 28,224 |
| Subcontract Labor-Brown/Color | 38,780 | 33,240 | 27,700 | 33,240 | 38,780 | 44,320 | 55,400 |
| Maintenance & Repair | 850 | 850 | 850 | 850 | 850 | 850 | 850 |
| Vehicles - Fuel | 1,890 | 1,620 | 1,350 | 1,620 | 1,890 | 2,160 | 2,430 |
| Insurance-Workman's Comp | 8,186 | 7,922 | 7,658 | 7,922 | 8,186 | 8,450 | 8,978 |
| Insurance-Other | 1,500 | 1,500 | 1,500 | 1,500 | 1,500 | 1,500 | 1,500 |
| Telephone/Radio/Utilities | 1,103 | 1,103 | 1,103 | 1,103 | 1,103 | 1,103 | 1,103 |
| Advertising/Marketing/P.R. | 551 | 551 | 551 | 551 | 551 | 551 | 551 |
| Professsional Services | 600 | 600 | 600 | 600 | 600 | 600 | 600 |
| Office Expense/Postage | 971 | 832 | 694 | 832 | 971 | 1,110 | 1,387 |
| Organ. Exp./Amortization | 50 | 50 | 50 | 50 | 50 | 50 | 50 |
| Depreciation | 1,973 | 1,973 | 1,973 | 1,973 | 1,973 | 1,973 | 1,973 |
| Equipment/Furniture | |||||||
| Equipment Rental/Leases | 3,500 | 3,000 | 2,500 | 3,000 | 3,500 | 4,000 | 5,000 |
| Rent | 3,500 | 3,500 | 3,500 | 3,500 | 3,500 | 3,500 | 3,500 |
| Miscellaneous Expenses | 5,712 | 4,896 | 4,080 | 4,896 | 5,712 | 6,528 | 8,160 |
| Total Cash Paid Out | 185,680 | 169,311 | 152,942 | 169,311 | 185,680 | 202,048 | 234,786 |
| Loans Section: | |||||||
| Interest | 1,234 | 1,225 | 1,217 | 1,208 | 1,200 | 1,191 | 1,182 |
| Principal | 1,013 | 1,021 | 1,030 | 1,038 | 1,047 | 1,056 | 1,065 |
| Cash Payments to Loans | 2,247 | 2,247 | 2,247 | 2,247 | 2,247 | 2,247 | 2,247 |
| Taxable Income | 3,486 | -7,336 | -18,159 | -7,319 | 3,521 | 14,361 | 36,032 |
| Income Tax (33.1%) | 1,152 | -2,425 | -6,003 | -2,419 | 1,164 | 4,747 | 11,911 |
| Net Income | 2,334 | -4,911 | -12,156 | -4,900 | 2,357 | 9,614 | 24,121 |
| Loans (Balance) | 147,039 | 146,018 | 144,988 | 143,950 | 142,903 | 141,847 | 140,783 |
| Dividends Paid | 1,167 | -2,456 | -6,078 | -2,450 | 1,178 | 4,807 | 12,061 |
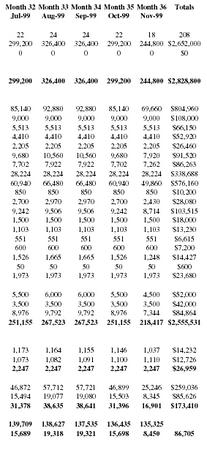
| Month 32 | Month 33 | Month 34 | Month 35 | Month 36 | Totals |
| Jul-99 | Aug-99 | Sep-99 | Oct-99 | Nov-99 | |
| 22 | 24 | 24 | 22 | 18 | 208 |
| 299,200 | 326,400 | 326,400 | 299,200 | 244,800 | $2,652,000 |
| 0 | 0 | 0 | 0 | 0 | $0 |
| 299,200 | 326,400 | 326,400 | 299,200 | 244,800 | $2,828,800 |
| 85,140 | 92,880 | 92,880 | 85,140 | 69,660 | $804,960 |
| 9,000 | 9,000 | 9,000 | 9,000 | 9,000 | $108,000 |
| 5,513 | 5,513 | 5,513 | 5,513 | 5,513 | $66,150 |
| 4,410 | 4,410 | 4,410 | 4,410 | 4,410 | $52,920 |
| 2,205 | 2,205 | 2,205 | 2,205 | 2,205 | $26,460 |
| 9,680 | 10,560 | 10,560 | 9,680 | 7,920 | $91,520 |
| 7,702 | 7,922 | 7,922 | 7,702 | 7,262 | $86,263 |
| 28,224 | 28,224 | 28,224 | 28,224 | 28,224 | $338,688 |
| 60,940 | 66,480 | 66,480 | 60,940 | 49,860 | $576,160 |
| 850 | 850 | 850 | 850 | 850 | $10,200 |
| 2,700 | 2,970 | 2,970 | 2,700 | 2,430 | $28,080 |
| 9,242 | 9,506 | 9,506 | 9,242 | 8,714 | $103,515 |
| 1,500 | 1,500 | 1,500 | 1,500 | 1,500 | $18,000 |
| 1,103 | 1,103 | 1,103 | 1,103 | 1,103 | $13,230 |
| 551 | 551 | 551 | 551 | 551 | $6,615 |
| 600 | 600 | 600 | 600 | 600 | $7,200 |
| 1,526 | 1,665 | 1,665 | 1,526 | 1,248 | $14,427 |
| 50 | 50 | 50 | 50 | 50 | $600 |
| 1,973 | 1,973 | 1,973 | 1,973 | 1,973 | $23,680 |
| 5,500 | 6,000 | 6,000 | 5,500 | 4,500 | $52,000 |
| 3,500 | 3,500 | 3,500 | 3,500 | 3,500 | $42,000 |
| 8,976 | 9,792 | 9,792 | 8,976 | 7,344 | $84,864 |
| 251,155 | 267,523 | 267,523 | 251,155 | 218,417 | $2,555,531 |
| 1,173 | 1,164 | 1,155 | 1,146 | 1,037 | $14,232 |
| 1,073 | 1,082 | 1,091 | 1,100 | 1,110 | $12,726 |
| 2,247 | 2,247 | 2,247 | 2,247 | 2,247 | $26,959 |
| 46,872 | 57,712 | 57,721 | 46,899 | 25,246 | $259,036 |
| 15,494 | 19,077 | 19,080 | 15,503 | 8,345 | $85,626 |
| 31,378 | 38,635 | 38,641 | 31,396 | 16,901 | $173,410 |
| 139,709 | 138,627 | 137,535 | 136,435 | 135,325 | |
| 15,689 | 19,318 | 19,321 | 15,698 | 8,450 | 86,705 |
Average Monthly Break-Even Analysis 1997
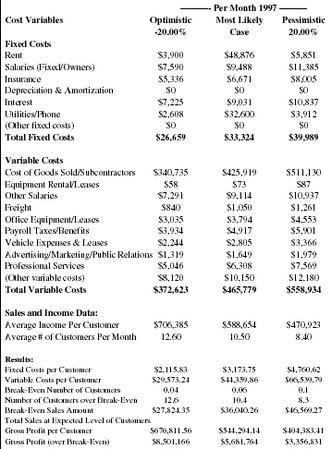
| ——— Per Month 1997——— | ||||
| Cost Variables | Optimistic | Most Likely | Pessimistic | |
| -20.00% | Case | 20.00% | ||
| Fixed Costs | ||||
| Rent | $3,900 | $48,876 | $5,851 | |
| Salaries (Fixed/Owners) | $7,590 | $9,488 | $11,385 | |
| Insurance | $5,336 | $6,671 | $8,005 | |
| Depreciation & Amortization | $0 | $0 | $0 | |
| Interest | $7,225 | $9,031 | $10,837 | |
| Utilities/Phone | $2,608 | $32,600 | $3,912 | |
| (Other fixed costs) | $0 | $0 | $0 | |
| Total Fixed Costs | $26,659 | $33,324 | $39,989 | |
| Variable Costs | ||||
| Cost of Goods Sold/Subcontractors | $340,735 | $425,919 | $511,130 | |
| Equipment Rental/Leases | $58 | $73 | $87 | |
| Other Salaries | $7,291 | $9,114 | $10,937 | |
| Freight | $840 | $1,050 | $1,261 | |
| Office Equipment/Leases | $3,035 | $3,794 | $4,553 | |
| Payroll Taxes/Benefits | $3,934 | $4,917 | $5,901 | |
| Vehicle Expenses & Leases | $2,244 | $2,805 | $3,366 | |
| Advertising/Marketing/Public Relations | $1,319 | $1,649 | $1,979 | |
| Professional Services | $5,046 | $6,308 | $7,569 | |
| (Other variable costs) | $8,120 | $10,150 | $12,180 | |
| Total Variable Costs | $372,623 | $465,779 | $558,934 | |
| Sales and Income Data: | ||||
| Average Income Per Customer | $706,385 | $588,654 | $470,923 | |
| Average # of Customers Per Month | 12.60 | 10.50 | 8.40 | |
| Fixed Costs per Customer | $2,115.83 | $3,173.75 | $4,760.62 | |
| Variable Costs per Customer | $29,573.24 | $44,359.86 | $66,539.79 | |
| Break-Even Number of Customers | 0.04 | 0.06 | 0.1 | |
| Number of Customers over Break-Even | 12.6 | 10.4 | 8.3 | |
| Break-Even Sales Amount | $27,824.35 | $36,040.26 | $46,569.27 | |
| Total Sales at Expected Level of Customers | ||||
| Gross Profit per Customer | $676,811.56 | $544,294.14 | $404,383.41 | |
| Gross Profit (over Break-Even) | $8,501,166 | $5,681,764 | $3,356,831 | |
Break-Even Analysis is a mathematical technique for analyzing the relationship between profits and fixed and variable costs. It is also a profit planning tool for calculating the point at which sales will equal costs. The above analysis indicates 1997 break-even number customers at .06 per month and break-even income at $36,040 per month. Anything over these amounts will be profit.
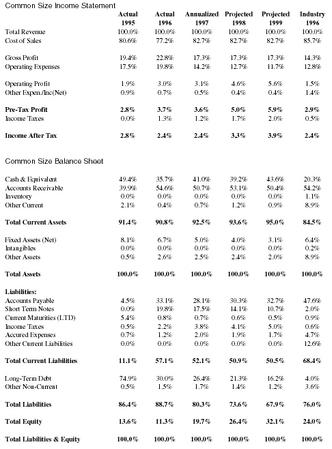
| Common Size Income Statement | ||||||
| Actual | Actual | Annualized | Projected | Projected | Industry | |
| 1995 | 1996 | 1997 | 1998 | 1999 | 1996 | |
| Total Revenue | 100.0% | 100.0% | 100.0% | 100.0% | 100.0% | 100.0% |
| Cost of Sales | 80.6% | 77.2% | 82.7% | 82.7% | 82.7% | 85.7% |
| Gross Profit | 19.4% | 22.8% | 17.3% | 17.3% | 17.3% | 14.3% |
| Operating Expenses | 17.5% | 19.8% | 14.2% | 12.7% | 11.7% | 12.8% |
| Operating Profit | 1.9% | 3.0% | 3.1% | 4.6% | 5.6% | 1.5% |
| Other Expen./Inc(Net) | 0.9% | 0.7% | 0.5% | 0.4% | 0.4% | 1.4% |
| Pre-Tax Profit | 2.8% | 3.7% | 3.6% | 5.0% | 5.9% | 2.9% |
| Income Taxes | 0.0% | 1.3% | 1.2% | 1.7% | 2.0% | 0.5% |
| Income After Tax | 2.8% | 2.4% | 2.4% | 3.3% | 3.9% | 2.4% |
| Common Size Balance Sheet | ||||||
| Cash & Equivalent | 49.4% | 35.7% | 41.0% | 39.2% | 43.6% | 20.3% |
| Accounts Receivable | 39.9% | 54.6% | 50.7% | 53.1% | 50.4% | 54.2% |
| Inventory | 0.0% | 0.0% | 0.0% | 0.0% | 0.0% | 1.1% |
| Other Current | 2.1% | 0.4% | 0.7% | 1.2% | 0.9% | 8.9% |
| Total Current Assets | 91.4% | 90.8% | 92.5% | 93.6% | 95.0% | 84.5% |
| Fixed Assets (Net) | 8.1% | 6.7% | 5.0% | 4.0% | 3.1% | 6.4% |
| Intangibles | 0.0% | 0.0% | 0.0% | 0.0% | 0.0% | 0.2% |
| Other Assets | 0.5% | 2.6% | 2.5% | 2.4% | 2.0% | 8.9% |
| Total Assets | 100.0% | 100.0% | 100.0% | 100.0% | 100.0% | 100.0% |
| Liabilities: | ||||||
| Accounts Payable | 4.5% | 33.1% | 28.1% | 30.3% | 32.7% | 47.6% |
| Short Term Notes | 0.0% | 19.8% | 17.5% | 14.1% | 10.7% | 2.0% |
| Current Maturities (LTD) | 5.4% | 0.8% | 0.7% | 0.6% | 0.5% | 0.9% |
| Income Taxes | 0.5% | 2.2% | 3.8% | 4.1% | 5.0% | 0.6% |
| Accured Expenses | 0.7% | 1.2% | 2.0% | 1.9% | 1.7% | 4.7% |
| Other Current Liabilities | 0.0% | 0.0% | 0.0% | 0.0% | 0.0% | 12.6% |
| Total Current Liabilities | 11.1% | 57.1% | 52.1% | 50.9% | 50.5% | 68.4% |
| Long-Term Debt | 74.9% | 30.0% | 26.4% | 21.3% | 16.2% | 4.0% |
| Other Non-Current | 0.5% | 1.5% | 1.7% | 1.4% | 1.2% | 3.6% |
| Total Liabilities | 86.4% | 88.7% | 80.3% | 73.6% | 67.9% | 76.0% |
| Total Equity | 13.6% | 11.3% | 19.7% | 26.4% | 32.1% | 24.0% |
| Total Liabilities & Equity | 100.0% | 100.0% | 100.0% | 100.0% | 100.0% | 100.0% |
RATIO COMPARISON
Ratio analysis can be one of the most useful financial management tools. It becomes important when you look at the trend of each ratio over time. It also becomes important when compared to averages of a particular industry.
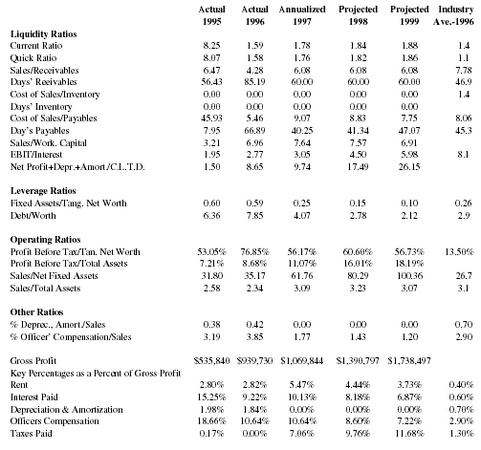
| Actual | Actual | Annualized | Projected | Projected | Industry | ||
| 1995 | 1996 | 1997 | 1998 | 1999 | Ave.-1996 | ||
| Liquidity Ratios | |||||||
| Current Ratio | 8.25 | 1.59 | 1.78 | 1.84 | 1.88 | 1.4 | |
| Quick Ratio | 8.07 | 1.58 | 1.76 | 1.82 | 1.86 | 1.1 | |
| Sales/Receivables | 6.47 | 4.28 | 6.08 | 6.08 | 6.08 | 7.78 | |
| Days' Reeivables | 56.43 | 85.19 | 60.00 | 60.00 | 60.00 | 46.9 | |
| Cost of Sales/Inventory | 0.00 | 0.00 | 0.00 | 0.00 | 0.00 | 1.4 | |
| Days' Inventory | 0.00 | 0.00 | 0.00 | 0.00 | 0.00 | ||
| Cost of Sales/Payables | 45.93 | 5.46 | 9.07 | 8.83 | 7.75 | 8.06 | |
| Day's Payables | 7.95 | 66.89 | 40.25 | 41.34 | 47.07 | 45.3 | |
| Sales/Work. Capital | 3.21 | 6.96 | 7.64 | 7.57 | 6.91 | ||
| EBIT/Interest | 1.95 | 2.77 | 3.05 | 4.50 | 5.98 | 8.1 | |
| Net Profit+Depr.+Amort./C.L.T.D. | 1.50 | 8.65 | 9.74 | 17.49 | 26.15 | ||
| Leverage Ratios | |||||||
| Fixed Assets/Tang. Net Worth | 0.60 | 0.59 | 0.25 | 0.15 | 0.10 | 0.26 | |
| Debt/Worth | 6.36 | 7.85 | 4.07 | 2.78 | 2.12 | 2.9 | |
| Operating Ratios | |||||||
| Profit Before Tax/Tan. Net Worth | 53.05% | 76.85% | 56.17% | 60.60% | 56.73% | 13.50% | |
| Profit Before Tax/Total Assets | 7.21% | 8.68% | 11.07% | 16.01% | 18.19% | ||
| Sales/Net Fixed Assets | 31.80 | 35.17 | 61.76 | 80.29 | 100.36 | 26.7 | |
| Sales/Total Assets | 2.58 | 2.34 | 3.09 | 3.23 | 3.07 | 3.1 | |
| Other Ratios | |||||||
| % Deprec., Amort./Sales | 0.38 | 0.42 | 0.00 | 0.00 | 0.00 | 0.70 | |
| % Officer' Compensation/Sales | 3.19 | 3.85 | 1.77 | 1.43 | 1.20 | 2.90 | |
| Gross Profit | $535,840 | $939,730 | $1,069,844 | $1,390,797 | $1,738,497 | ||
| Key Percentages as a Percent of Gross Profit | |||||||
| Rent | 2.80% | 2.82% | 5.47% | 4.44% | 3.73% | 0.40% | |
| Interest Paid | 15.25% | 9.22% | 10.13% | 8.18% | 6.87% | 0.60% | |
| Depreciation & Amortization | 1.98% | 1.84% | 0.00% | 0.00% | 0.00% | 0.70% | |
| Officers Compensation | 18.66% | 10.64% | 10.64% | 8.60% | 7.22% | 2.90% | |
| Taxes Paid | 0.17% | 0.00% | 7.06% | 9.76% | 11.68% | 1.30% | |
Note on Key Percentages as a percent of Gross Profit above:
Rent, Interest Paid, Officers' Compensation, and Taxes Paid are in large part attributable to Smith Contractors being a new company. It has spent the first three years building, staffing, and equipping the business. As the sales and income go up, these percentages will go down and become more in line with industry averages. The hiring of a new comptroller should help reduce the amount of taxes paid and allow the company to more closely monitor expenses. The important ratio of % of Officers' Compensation to Sales is well within line for 1997 and after.
RATIO COMPARISON
1. The Current Ratio is an approximate measure of a firm's ability to meet its current obligations and is calculated as Current Assets/Current Liabilities.
Smith Contractors, Inc.'s current ratio is on an upward trend. This would indicate that the amount of current assets is increasing steadily as is the "cushion" between current liabilities and the ability to pay them. It could suggest that Smith Contractors has a relatively more stable position than the industry and seems to suggest that there is an opportunity for expanded operations.
2. The Revenue to Receivables ratio measures the number of times trade receivables turn over in a year. It is calculated as the Net Revenue/Trade Receivables.
Smith Contractors, Inc.'s recent revenue to receivables ratio is on a downward trend. This indicates that collection methods need to be improved. (This has been done.)
3. The Cost of Goods to Payables ratio measures the number of times trade payables turn over in a year. It is calculated as Cost of Goods Sold/Trade Payables.
Smith Contractors, Inc.'s recent cost of goods to payables ratio is on a downward trend. This indicates that the company may be experiencing cash shortages due to the amount of time between the payment of supplies or subcontractors and receipt of payment for its billings. It might want to consider extending the time it takes to pay for supplies or subcontractors.
4. The Revenue to Working Capital ratio is a measure of the margin of protection for current creditors. It is calculated as Net Revenue/{Current Assets-Current Liabilities}. (This has been corrected with the change in payment policy to subcontractors.)
Smith Contractors, Inc.'s recent revenue to working capital ratio is on an upward trend. This indicates efficient use of working capital.
5. The EBIT to Interest ratio is a measure of ability to meet annual interest payments. It is calculated as Earnings before interest and taxes/Annual Interest Expense.
Smith Contractors, Inc.'s recent EBIT to interest ratio is on an upward trend. This indicates that the company should not have a problem servicing its debt. The figures for 1997-1999 is above industry median figures. This could indicate that the company is better able to make interest payments and could possibly handle more debt.
6. The Current Maturities Coverage ratio is a measure of ability to pay current maturities of short-term debt with cash flow from operations. It is calculated as {Net Income + Depreciation, Amortization, and Depletion}/Current Portion of Long-Term Debt.
Smith Contractors, Inc.'s recent Current Maturities Coverage ratio is on an upward trend. This indicates that the cash flow available to service debt are increasing relative to the level of debt. The figures for 1997-1999 is above industry median figures. This indicates that the company is better able to service debt and could possibly indicate additional debt capacity.
7. The Fixed Assets to Tangible Net Worth ratio measures the extent to which owners' equity has been invested in property, plant, and equipment. It is calculated as Net Fixed Assets/{Equity - Net Intangible Assets}.
Smith Contractors, Inc.'s fixed asset to tangible net worth ratio is on a downward trend. This indicates that the investment in fixed assets relative to net worth is decreasing and results in a larger "cushion" for creditors in the event of liquidation.
8. The Debt to Equity ratio expresses the relationship between capital contributed by creditors and capital contributed by owners. It is calculated as Total Liabilities/Net Worth.
Smith Contractors, Inc.'s recent debt to equity ratio is on a downward trend. This indicates the company is achieving greater short-term financial safety.
9. The Earnings Before Tax to Tangible Net Worth ratio expresses the rate of return on tangible capital employed. It is calculated as (Earnings Before Taxes/{Net Worth-Net Intangible Assets} * 100.
Smith Contractors, Inc.'s earnings before tax to tangible net worth ratio is on a downward trend. For the period 1997 to 1999 this ratio is above industry median earnings. This indicates that the company is out-performing the industry but can also indicate that the business is undercapitalized.
10. The Earning Before Tax to Total Assets ratio expresses the pre-tax return on total assets and measures the effectiveness of management in employing available resources. It is calculated as (Earnings Before Tax/Total Assets) * 100.
Smith Contractors, Inc.'s recent Earnings Before Tax to total assets ratio has been on an upward trend. This indicates an increasingly effective use of available resources.
11. The Officers', Directors', Owners' compensation to Sales ratio is a general measure of ability to compensate top employees. It is calculated as Officers' Salaries/Sales.
Smith Contractors, Inc.'s trend is downward. This can indicate an increasing effectiveness of management or that the business is becoming more service oriented and less capital intensive.
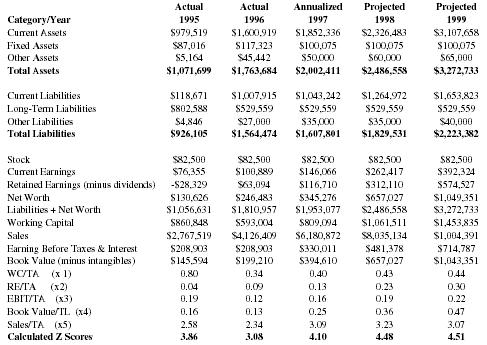
| Actual | Actual | Annualized | Projected | Projected | |
| Category/Year | 1995 | 1996 | 1997 | 1998 | 1999 |
| Current Assets | $979,519 | $1,600,919 | $1,852,336 | $2,326,483 | $3,107,658 |
| Fixed Assets | $87,016 | $117,323 | $100,075 | $100,075 | $100,075 |
| Other Assets | $5,164 | $45,442 | $50,000 | $60,000 | $65,000 |
| Total Assets | $1,071,699 | $1,763,684 | $2,002,411 | $2,486,558 | $3,272,733 |
| Current Liabilities | $118,671 | $1,007,915 | $1,043,242 | $1,264,972 | $1,653,823 |
| Long-Term Liabilities | $802,588 | $529,559 | $529,559 | $529,559 | $529,559 |
| Other Liabilities | $4,846 | $27,000 | $35,000 | $35,000 | $40,000 |
| Total Liabilities | $926,105 | $1,564,474 | $1,607,801 | $1,829,531 | $2,223,382 |
| Stock | $82,500 | $82,500 | $82,500 | $82,500 | $82,500 |
| Current Earnings | $76,355 | $100,889 | $146,066 | $262,417 | $392,324 |
| Retained Earnings (minus dividends) | -$28,329 | $63,094 | $116,710 | $312,110 | $574,527 |
| Net Worth | $130,626 | $246,483 | $345,276 | $657,027 | $1,049,351 |
| Liabilities + Net Worth | $1,056,631 | $1,810,957 | $1,953,077 | $2,486,558 | $3,272,733 |
| Working Capital | $860,848 | $593,004 | $809,094 | $1,061,511 | $1,453,835 |
| Sales | $2,767,519 | $4,126,409 | $6,180,872 | $8,035,134 | $1,004,391 |
| Earning Before Taxes & Interest | $208,903 | $208,903 | $330,011 | $481,378 | $714,787 |
| Book Value (minus intangibles) | $145,594 | $199,210 | $394,610 | $657,027 | $1,043,351 |
| WC/TA (x 1) | 0.80 | 0.34 | 0.40 | 0.43 | 0.44 |
| RE/TA (x2) | 0.04 | 0.09 | 0.13 | 0.23 | 0.30 |
| EBIT/TA (x3) | 0.19 | 0.12 | 0.16 | 0.19 | 0.22 |
| Book Value/TL (x4) | 0.16 | 0.13 | 0.25 | 0.36 | 0.47 |
| Sales/TA (x5) | 2.58 | 2.34 | 3.09 | 3.23 | 3.07 |
| Calculated Z Scores | 3.86 | 3.08 | 4.10 | 4.48 | 4.51 |
SCORES ABOVE 2.91 INDICATE THE FIRM IS SAFE FROM BANKRUPTCY THE HIGHER THE SCORES - THE SAFER THE COMPANY
The Z Score Formula = 0.717*(X1) + 0.847*(X2) + 3.107*(X3) + 0.420*(X4) +
If the Z Score is Greater than or Equal to 2.9 the subject firm is apparently safe from bankruptcy. If the Z Score is Less than or Equal to 1.2 the subject may be destined for bankruptcy. If the Z Score is between 1.23 and 2.9 the firm is in a gray area and steps could be taken by management to correct existing or potential problems in order to avoid bankruptcy.
Z Score analysis is a statistical method developed to forecast bankruptcy. It is over 90% accurate one year into the future and 80% accurate for the second year.
In this instance we used the 1995 and 1996 actual figures, Estimated 1997, Projected 1998, and 1999 figures to determine the above scores.
The Z Scores indicated above are all well over 2.91 which indicates that the company will not be a candidate for bankruptcy if it can achieve the goals outlined in this plan.
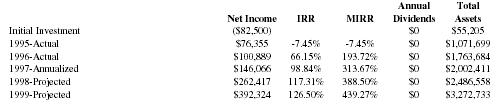
| Annual | Total | ||||
| Net Income | IRR | MIRR | Dividends | Assets | |
| Initial Investment | ($82,500) | $0 | $55,205 | ||
| 1995-Actual | $76,355 | -7.45% | -7.45% | $0 | $1,071,699 |
| 1996-Actual | $100,889 | 66.15% | 193.72% | $0 | $1,763,684 |
| 1997-Annualized | $146,066 | 98.84% | 313.67% | $0 | $2,002,411 |
| 1998-Projected | $262,417 | 117.31% | 388.50% | $0 | $2,486,558 |
| 1999-Projected | $392,324 | 126.50% | 439.27% | $0 | $3,272,733 |
Assumptions:
Income figures are after taxes Dividend Payout is currently zero Reinvestment rate = 7%
IRR = Internal Rate of Return MIRR = Modified Rate of Return ROI = Rate of Return on Owner's Investment ROA = Rate of Return on Total Assets
IRR= the interest rate received for an investment and income that occur at regular periods. MIRR=adds the cost of funds and interest received on reinvestment of cash to the IRR.
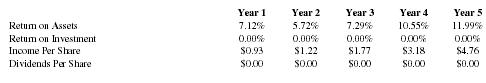
| Year 1 | Year 2 | Year 3 | Year 4 | Year 5 | |
| Return on Assets | 7.12% | 5.72% | 7.29% | 10.55% | 11.99% |
| Return on Investment | 0.00% | 0.00% | 0.00% | 0.00% | 0.00% |
| Income Per Share | $0.93 | $1.22 | $1.77 | $3.18 | $4.76 |
| Dividends Per Share | $0.00 | $0.00 | $0.00 | $0.00 | $0.00 |
CONCLUSIONS AND SUMMARY
A review of the first eight years of Smith Contractors' existence show that it has been immensely successful. Even in its first full year of operation, it reached industry standards of performance. This is unheard of for a start-up company. Each subsequent year has shown significant improvement in profitability and operational performance.
During the first eight years the company concentrated upon being profitable, building its staff and equipping its office. Smith Contractors is now ready to step up to the next level and utilize economies of scale to make the projected numbers even more striking.
Smith Contractors has also undertaken major changes in philosophy in billing and payment of subcontractors and suppliers which will dramatically increase cash flow. The company has also hired a full-time marketing manager and is in the process of hiring a full-time controller. It also utilizes the services of a professional business consultant to help analyze the financial information and make suggestions for the future. Smith Contractors will conduct a complete review of the actual figures and compare them to budgets and peers periodically throughout the year.
Comment about this article, ask questions, or add new information about this topic: