Mortgage Company
BUSINESS PLAN NATIONAL MORTGAGE, INC.
123 N. Main Blvd., Suite 201
Seattle, Washington 98108
This mortgage company specializes in lending money to people who have poor credit or who are self-employed and have problems qualifying for conventional loans. It plans to offer complementary credit cards and debit cards, as well as insurance, for this niche market. Future plans include national expansion. This plan was provided by Ameriwest Business Consultants, Inc.
- EXECUTIVE SUMMARY
- OBJECTIVES & GOALS
- STRATEGIES FOR ACHIEVING GOALS
- BUSINESS DESCRIPTION, STATUS, & OUTLOOK
- MANAGEMENT & OWNERSHIP
- MARKET ANALYSIS
- MARKETING STRATEGIES
- FIVE-YEAR PROJECTIONS
- RATIO COMPARISON
- CONCLUSIONS & SUMMARY
Confidentiality Statement
The information, data, and charts embodied in this business plan are strictly confidential and are supplied on the understanding that they will be held confidentially and not disclosed to third parties without the prior written consent of National Mortgage.
EXECUTIVE SUMMARY
BUSINESS DESCRIPTION
National Mortgage has developed a unique concept of lending to people who have less than perfect credit or self-employed people who have a hard time qualifying for conventional loans. The money loaned out is typically used by borrowers to consolidate debt and can provide a source of huge savings for our clients by paying off high interest credit card debt. We charge competitive interest rates. Our customers are very ready to work with us because they have usually been turned down by one or more lenders and we can provide them peace of mind and a way to solve their credit problems. The loans are secured with a second mortgage on their property. Hours of operation are Monday through Friday, 10:00 A.M. to 7:00 P.M., and Saturday, 8:00 A.M. to 3:00 P.M. The processing center is open 8:00 A.M to 8:00 P.M., Monday through Friday, and 8:00 A.M. to 6:00 P.M. on Saturday.
CURRENT POSITION AND FUTURE OUTLOOK
The business is in its third year of operation. Operations are conducted from facilities located at 123 North Main Boulevard in Seattle, Washington. The premises consist of approximately 1,600 square feet. The first several years were used to build the business, equip the office and hire a competent staff. Key employees are Jill Stone, Sue Brown, Helen Hunt, and Rachel Rosana. The company currently employs five people. National is now ready to move to a higher level and can handle a much greater volume. We are currently working with Merrill Lynch and ABC to franchise our unique concept on a national scale.
MANAGEMENT AND OWNERSHIP
The company is set up as a corporation with Jill Stone owning 100% of the stock. She initially helped set up the operations and even though she is now less active in the operations, she is available for consultation and advice. The corporation is an "S" corporation, but will be changed to a "C" corporation by the end of 1997 to satisfy requirements for becoming a franchiser. The corporation type of entity was chosen for liability protection, tax considerations, growth plans, stock option plans, and the opportunity to raise capital from investors more easily. Sue Brown serves as vice president. She has five years of experience in the mortgage business. Helen Hunt serves as operations manager. Rachel Rosana is the processing manager. National currently employs five additional people in various capacities. When volume picks up, additional part-time or full-time employees will be hired as the workload requires. National will continue to utilize the services from consultants in areas such as planning, budgeting, accounting, general business advising, and law.
UNIQUENESS AND DIFFERENTIATION OF THE SERVICE
National, Inc. will continue to specialize in serving individuals who have less than perfect credit or who are self-employed and cannot qualify for conventional loans. The company was formed to provide loans to this niche market. The company utilizes the most current technology to enable it to not only provide competitive pricing but also excellent service. In the future, we plan to offer complementary products such as secured credit cards and debit cards, insurance, and other investment tools.
It is rare in today's business world to find a true market void. That is exactly what National has done. It has combined the latest in technology with an unfilled need and promises to deliver a high quality product at a competitive price. Our services have limited competition in Washington and even nationally because of the nature of our clients. We have built an excellent reputation in the area and wish to capitalize on it to enter the national marketplace. To reach an even larger market we will develop and utilize a web page on the Internet.
FUNDS REQUIRED AND USAGE
To continue to fund its growth and provide the money for franchise operations, National Mortgage will be seeking $150,000 in additional funding. This may come from either investors or from additional loans. Any additional funds obtained will be for working capital, equipment purchases, advertising, and expenses associated with setting up franchise operations.
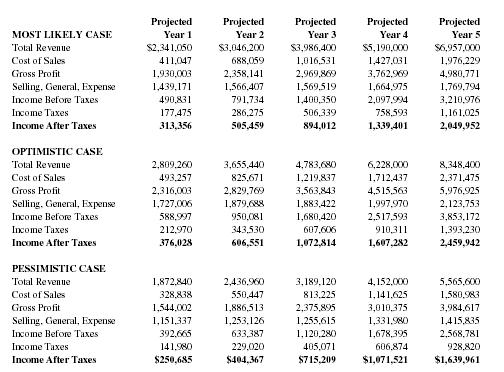
| Projected | Projected | Projected | Projected | Projected | |
| MOST LIKELY CASE | Year 1 | Year 2 | Year 3 | Year 4 | Year 5 |
| Total Revenue | $2,341,050 | $3,046,200 | $3,986,400 | $5,190,000 | $6,957,000 |
| Cost of Sales | 411,047 | 688,059 | 1,016,531 | 1,427,031 | 1,976,229 |
| Gross Profit | 1,930,003 | 2,358,141 | 2,969,869 | 3,762,969 | 4,980,771 |
| Selling, General, Expense | 1,439,171 | 1,566,407 | 1,569,519 | 1,664,975 | 1,769,794 |
| Income Before Taxes | 490,831 | 791,734 | 1,400,350 | 2,097,994 | 3,210,976 |
| Income Taxes | 177,475 | 286,275 | 506,339 | 758,593 | 1,161,025 |
| Income After Taxes | 313,356 | 505,459 | 894,012 | 1,339,401 | 2,049,952 |
| OPTIMISTIC CASE | |||||
| Total Revenue | 2,809,260 | 3,655,440 | 4,783,680 | 6,228,000 | 8,348,400 |
| Cost of Sales | 493,257 | 825,671 | 1,219,837 | 1,712,437 | 2,371,475 |
| Gross Profit | 2,316,003 | 2,829,769 | 3,563,843 | 4,515,563 | 5,976,925 |
| Selling, General, Expense | 1,727,006 | 1,879,688 | 1,883,422 | 1,997,970 | 2,123,753 |
| Income Before Taxes | 588,997 | 950,081 | 1,680,420 | 2,517,593 | 3,853,172 |
| Income Taxes | 212,970 | 343,530 | 607,606 | 910,311 | 1,393,230 |
| Income After Taxes | 376,028 | 606,551 | 1,072,814 | 1,607,282 | 2,459,942 |
| PESSIMISTIC CASE | |||||
| Total Revenue | 1,872,840 | 2,436,960 | 3,189,120 | 4,152,000 | 5,565,600 |
| Cost of Sales | 328,838 | 550,447 | 813,225 | 1,141,625 | 1,580,983 |
| Gross Profit | 1,544,002 | 1,886,513 | 2,375,895 | 3,010,375 | 3,984,617 |
| Selling, General, Expense | 1,151,337 | 1,253,126 | 1,255,615 | 1,331,980 | 1,415,835 |
| Income Before Taxes | 392,665 | 633,387 | 1,120,280 | 1,678,395 | 2,568,781 |
| Income Taxes | 141,980 | 229,020 | 405,071 | 606,874 | 928,820 |
| Income After Taxes | $250,685 | $404,367 | $715,209 | $1,071,521 | $1,639,961 |
OBJECTIVES & GOALS
- To provide a high quality service so that customers will perceive great value.
- To expand into the national market.
- To obtain additional funding to fuel the expansion.
- To become one of the premier nationally known equity lenders serving individuals with less than perfect credit or who are self-employed.
- National Mortgage plans to closely monitor changing technology to be certain that the company is using the latest and most cost-effective equipment to keep up with current trends in the marketplace.
- To provide National Mortgage with at least $700,000 in retained earning over the next five years.
In addition to the above goals, we will survey our customers and make changes in our programs and add services to meet their changing ideas in the marketplace.
STRATEGIES FOR ACHIEVING GOALS
To achieve the above goals, we will concentrate on providing outstanding quality and aggressively promote our franchises throughout the country. We will utilize the assistance of Merrill Lynch and ABC to make the franchising work. Both of these companies have achieved national recognition and do an excellent job in getting franchise operations off the ground. National Mortgage currently serves the Seattle and Spokane markets and their surrounding areas with its loan operations. By the end of first year of expansion, we expect to be serving up to 60 additional markets as a result of the franchise operations. As the Washington economy continues to see rapid growth, National Mortgage will take advantage of an even greater share of the local marketplace than it has in the past. It will be able to capitalize on the reputation it has built.
Our major goals include maximizing sales and building our client/customer base with a close eye on profitability. It is very important to continue to fill the market void for those borrowers that cannot obtain loans through conventional lenders. Our experience has shown that people with less than perfect credit or who are self-employed are very grateful for the professional manner in which their loans are processed.
BUSINESS DESCRIPTION, STATUS & OUTLOOK
National, Inc. will continue on its current path of growth. Its main office will be fully staffed and equipped and able to handle nearly double the amount of processing with little additional expenses.
The biggest problem this venture will face will be creating customer awareness of our services and funding the growth. We will use a combination of advertising techniques and word of mouth to increase this awareness. We will also utilize the services of Merrill Lynch and ABC, nationally recognized and respected companies, to help us in this area. Once a general awareness is present, the company has a virtually unlimited growth potential.
Through the franchise operations we will be able to handle large numbers of loans through our processing center.
Once the franchising operations are established, loans will be processed from each franchisee through our processing center. Loans will be processed for the franchisees as well as those generated by our company-owned office.
National Mortgage is a member of the Seattle Metro Chamber of Commerce and the Housing and Building Committee.
The future holds the promise of almost unlimited growth and income as the business matures and considers other markets and products. Complementary products such as secured credit cards and debit cards will be considered in the future in response to customer requests.
MANAGEMENT & OWNERSHIP
Jill Stone serves as the President and Chief Executive Officer. She worked several years for a nationally known equity lender. She spent nearly twenty years in the United States Army in a variety of top level management positions and attended the University of Kentucky. She is also fluent in reading, writing, and speaking Spanish. Jill is responsible for the overall operations of the loan processing area. She assists in processing files, understanding and adhering to lender's guidelines, ordering and follow-up on verifications. She attends on-going training conducted by lenders, title companies, and other outside agencies. She ensures Quality Control for each loan package prior to submission.
Sue Brown serves as Vice President of National Mortgage and has five years of experience in the mortgage industry and has "hands-on, ground-up" knowledge of all facets of the mortgage business. She has worked with a variety of nationally known equity lenders. She has played a key role and functioned in a management capacity in most impact areas of the industry. Her supervisory positions in the administrative, operational, technological, and fiscal areas of this discipline have afforded her the skills, experience, and talents necessary to lead National Mortgage through this new century. Sue is heavily involved in sales, advertising, banking, operation, planning, insurance, purchasing, and equipment. She also will be involved with locating, interviewing, qualifying, and training the initial franchisees. She will oversee the training of future area representatives and instructors.
Helen Hunt serves National Mortgage as its Operations Manager. She attended Seattle Business College and studied business management. Her duties include office management, insuring client satisfaction, resolving customer complaints, and client interviewing for prequalification. She also is involved in the hiring, firing, scheduling, and training of employees.
Rachel Rosana has worked with several nationally known mortgage lenders. Her main duties with National Mortgage are in the capacity of Processing Manager. She trains processors, funding representatives, and team leaders. She provides quality control for file processing and ensures files are maintained properly.
The business is set up as a "C" corporation. This form of legal entity was chosen primarily for liability reasons and makes it easier to secure investors. The company employs five highly trained employees in office management and loan administration. As the business grows, additional part-time or full-time employees may be added to handle the increased workload.
National Mortgage has applied for membership in the National Association of Mortgage Brokers and with local Associations of Mortgage Brokers. Memberships in these organizations help us monitor changes in the industry and government regulations.
MARKET ANALYSIS
MARKET OVERVIEW, SIZE, AND SEGMENTS
Listed below are just some of the reasons the industry is expanding and why it is a good time for a business such as ours:
- Personal debt is rising at record numbers.
- People are using credit cards to purchase daily items - such as food.
- The average person has 6 credit cards.
- The average person receives 7-10 credit cards solicitations per month.
- The baby boom generation accounts for the majority of bankruptcies filed.
- Downsizing has affected the middle management jobs that have been permanently eliminated and replaced with lower paying jobs.
CUSTOMER PROFILE
Typical characteristics of our customers include the following:
- 29 to 50 years old
- No sizable equity in their home
- Many times have less than perfect credit or are self-employed
- Married, with children
- Blue collar workers
- Middle- to low-income
- Have usually been turned down by one or more conventional lenders
- Include people who are looking for peace of mind and are trying to regain control of their finances
COMPETITION
In theory, the competitors National Mortgage faces in the marketplace include bankers, finance companies, and mortgage brokers. In reality, the concept of lending to people with less than perfect credit or who are self-employed, means that very few of the above mentioned competitors offer true competition. These competitors also have limitations as a result of their loan programs, higher interest rates, and lack of advertising dollars.
Risk Analysis— Strengths & Weaknesses
National Mortgage is strong in operations, production, quality of service, product mix, company policies, desirability, and facilities. National Mortgage is about average in management, marketing, distribution, servicing, product features, advertising, overhead, pricing, and delivery time. National Mortgage is weak in finance and planning, market leadership sales force, and location. In these areas of weakness we have hired professionals to supplement our management abilities.
We have low risk exposure in the areas of dependence upon other companies, vulnerability to substitutes, technology, suppliers, inflation, and interest rates.
We perceive medium risk exposure industry maturity, market position, competitive position, distribution, and strategy. We perceive high risk in the areas of financial performance and management performance. These are the areas we have specifically addressed when we hired business management, franchise, and marketing professionals to help us. It is also a major reason we are franchising our concept.
We will continue to obtain help when needed in areas we feel it is necessary to complement our abilities.
MARKETING STRATEGIES
PRICING AND VALUE
Our pricing strategy involves pricing at competitive rates. Our customers are people with either less than perfect credit or who are self-employed and have a difficult time obtaining an equity loan from conventional lenders. We do keep an eye on competition so we do not price ourselves out of the market. We will continue to review our pricing every six months or more often when the economy or competition dictates.
Currently, there is a certain amount of price inelasticity in this service due to government regulations. On the other hand, if we offer additional services we can open up other opportunities to increase revenues. Pricing will be reviewed on a semi-annual basis.
SELLING TACTICS
Our company's marketing strategy will incorporate plans to promote our line of services through several different channels and on different levels, along with the use of referrals, telemarketing, and advertising. We also plan to utilize a website as a selling tool.
Advertising tools we will utilize include brochures, catalogs, targeted advertisements, lead generation, lead referral and follow-up systems, information gathering, and dissemination. To better reach the local market we will network with groups that help people with credit problems. In addition, we will greater utilize local newspapers extensively.
Nationally, we will advertise through the use of a very extensive multi-level advertising campaign in conjunction with our franchises.
ADVERTISING, PROMOTION, AND DISTRIBUTION OF SERVICES
We recognize that the key to success at this time requires extensive promotion.
Advertising goals include all of the following:
- Position the company to become one of the premier mortgage brokers in the country.
- Increase general awareness of our company both locally and nationally.
- Increase general awareness of our company and its outstanding track record.
- Maximize efficiency by continually monitoring media effectiveness.
- Maintain an ad in the Yellow Pages and Business White Pages.
- Continually update our brochure to explain our company, service, and products.
- Use direct mail campaigns.
- Use a mix of media to saturate the marketplace.
PUBLIC RELATIONS
We will develop a public relations policy that will help increase awareness of our company and product. To achieve these goals we will consider some or all of the following:
- Develop a press release and a company backgrounder as a public relations tool.
- Develop a telephone script to handle customer and advertiser contacts.
- Develop a survey to be completed by customers to help determine the following:
- 1. How did they hear about us?
- 2. What influenced them to use our service?
- 3. How well did our service satisfy their needs?
- 4. How efficient was our service?
- 5. Did they have any problems getting through to us?
- 6. Did they shop competitors before selecting us?
- 7. How did they initially perceive our company and product?
- 8. Where are most of our customers located?
- 9. Are there suggestions for improving our service or our approach to advertising?
- 10.What additional services would they like us to offer?
- 11.Would they recommend us to others?
ASSUMPTIONS, DEFINITIONS, AND NOTES
Throughout this business plan we have taken a very conservative approach to developing our financial projections.
- Number of loans processed the first year will average 111.25.
- Franchises sold will gradually increase to 60 the first year.
- Inflation rates to remain stable at 3-5%.
- Robust local economy.
- Interest Rates to remain flat and basically unchanged.
- Local unemployment rates to remain low at approximately 4-5%.
- Assumes royalties of 8% of fees.
- Assumes processing fee of $570 per loan.
- Payroll taxes and benefits will equal 25% of total payroll expenses.
- Assumes $25,000 fee for each franchise sold.
- Assumes a loan of $150,000 at 10.00% amortized over five years and having monthly payments of $3,187 per month.
- Cost of unreimbursed expense of each loan will be $75.00.
- Assumes AdFund income of $60 per loan.
- Assumes 1 processor for each 15 loans processed. Each processor will make $1,500 per month. Salaries will increase 5% per year.
- Assumes 6 processors per team.
- Assumes 1 Team Leader for every 6 processors. Each Team Leader will earn $2,083 per month and this will increase by 5% per year.
- Assumes 1 Funding Representative for each team. Each Funding Representative will earn $1,387 per month. Salary increases will be 5% per year.
- Assumes 1 Customer Service Representative for every 50 loans. Each CSR will earn $1,387 per month. Salary to increase 5% per year.
- Assumes 1 General Office Worker for every 10 teams. Office Worker will earn $1,127 per month. Salary increased will be 5% per year per worker.
- Assumes 1 Area Representative for every 20 franchises. Each Area Rep will earn $2,333 per month and this amount will increase 5% per year.
- Depreciation will be computed using the straight line method over 60 months.
- Office supplies/postage expenses is set at 1% of monthly income.
- Contingency and miscellaneous expenses are set at 5% of total income.
- Telephone and utilities expenses are set at 2.0% of total sales.
- Franchise and loan operations each have unique expenses associated with its operation.
- Forty percent of general expenses will be directed to fund franchise operations.
FIVE-YEAR PROJECTIONS — Financial Inputs & Summary
First Year of Start-Up 1997 Corporation Type C—"C" Corporation format selected; income taxes WILL be computed.
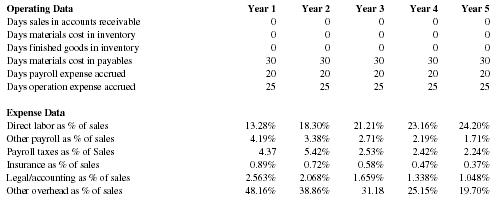
| Operating Data | Year 1 | Year 2 | Year 3 | Year 4 | Year 5 |
| Days sales in accounts receivable | 0 | 0 | 0 | 0 | 0 |
| Days materials cost in inventory | 0 | 0 | 0 | 0 | 0 |
| Days finished goods in inventory | 0 | 0 | 0 | 0 | 0 |
| Days materials cost in payables | 30 | 30 | 30 | 30 | 30 |
| Days payroll expense accrued | 20 | 20 | 20 | 20 | 20 |
| Days operation expense accrued | 25 | 25 | 25 | 25 | 25 |
| Expense Data | |||||
| Direct labor as % of sales | 13.28% | 18.30% | 21.21% | 23.16% | 24.20% |
| Other payroll as % of sales | 4.19% | 3.38% | 2.71% | 2.19% | 1.71% |
| Payroll taxes as % of Sales | 4.37 | 5.42% | 2.53% | 2.42% | 2.24% |
| Insurance as % of sales | 0.89% | 0.72% | 0.58% | 0.47% | 0.37% |
| Legal/accounting as % of sales | 2.563% | 2.068% | 1.659% | 1.338% | 1.048% |
| Other overhead as % of sales | 48.16% | 38.86% | 31.18 | 25.15% | 19.70% |
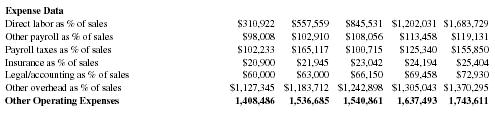
| Expense Data | |||||
| Direct labor as % of sales | $310,922 | $557,559 | $845,531 | $1,202,031 | $1,683,729 |
| Other payroll as % of sales | $98,008 | $102,910 | $108,056 | $113,458 | $119,131 |
| Payroll taxes as % of sales | $102,233 | $165,117 | $100,715 | $125,340 | $155,850 |
| Insurance as % of sales | $20,900 | $21,945 | $23,042 | $24,194 | $25,404 |
| Legal/accounting as % of sales | $60,000 | $63,000 | $66,150 | $69,458 | $72,930 |
| Other overhead as % of sales | $1,127,345 | $1,183,712 | $1,242,898 | $1,305,043 | $1,370,295 |
| Other Operating Expenses | 1,408,486 | 1,536,685 | 1,540,861 | 1,637,493 | 1,743,611 |
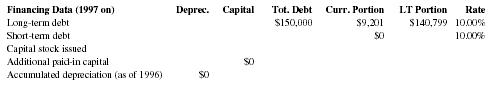
| Financing Data (1997 on) | Deprec. | Capital Tot. | Debt | Curr. Portion | LT Portion | Rate |
| Long-term debt | $150,000 | $9,201 | $140,799 | 10.00% | ||
| Short-term debt | $0 | 10.00% | ||||
| Capital stock issued | ||||||
| Additional paid-in capital | $0 | |||||
| Accumulated depreciation (as of 1996) | $0 | |||||
Five-Year Financial Summary—Balance Sheet
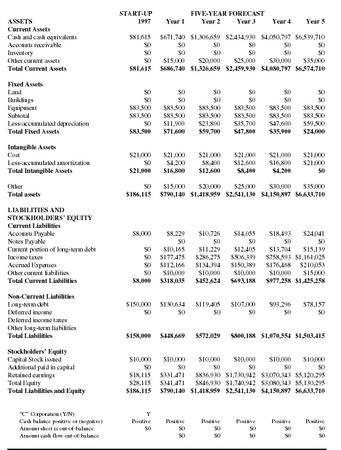
| START-UP | FIVE-YEAR FORECAST | ||||||
| ASSETS | 1997 | Year 1 | Year 2 | Year 3 | Year 4 | Year 5 | |
| "C" Corporation (Y/N) | Y | ||||||
| Cash balance positive or (negative) | Positive | Positive | Positive | Positive | Positive | Positive | |
| Amount sheet is out-of-balance | $0 | $0 | $0 | $0 | $0 | $0 | |
| Amount cash flow out-of-balance | $0 | $0 | $0 | $0 | $0 | ||
| Current Assets | |||||||
| Cash and cash equivalents | $81,615 | $671,740 | $1,306,659 | $2,434,930 | $4,050,797 | $6,539,710 | |
| Accounts receivable | $0 | $0 | $0 | $0 | $0 | $0 | |
| Inventory | $0 | $0 | $0 | $0 | $0 | $0 | |
| Other current assets | $0 | $15,000 | $20,000 | $25,000 | $30,000 | $35,000 | |
| Total Current Assets | $81,615 | $686,740 | $1,326,659 | $2,459,930 | $4,080,797 | $6,574,710 | |
| Fixed Assets | |||||||
| Land | $0 | $0 | $0 | $0 | $0 | $0 | |
| Buildings | $0 | $0 | $0 | $0 | $0 | $0 | |
| Equipment | $83,500 | $83,500 | $83,500 | $83,500 | $83,500 | $83,500 | |
| Subtotal | $83,500 | $83,500 | $83,500 | $83,500 | $83,500 | $83,500 | |
| Less-accumulated depreciation | $0 | $11,900 | $23,800 | $35,700 | $47,600 | $59,500 | |
| Total Fixed Assets | $83,500 | $71,600 | $59,700 | $47,800 | $35,900 | $24,000 | |
| Intangible Assets | |||||||
| Cost | $21,000 | $21,000 | $21,000 | $21,000 | $21,000 | $21,000 | |
| Less-accumulated amortization | $0 | $4,200 | $8,400 | $12,600 | $16,800 | $21,000 | |
| Total Intangible Assets | $21,000 | $16,800 | $12,600 | $8,400 | $4,200 | $0 | |
| Other | $0 | $15,000 | $20,000 | $25,000 | $30,000 | $35,000 | |
| Total assets | $186,115 | $790,140 | $1,418,959 | $2,541,130 | $4,150,897 | $6,633,710 | |
| LIABILITIES AND | |||||||
| STOCKHOLDERS' EQUITY | |||||||
| Current Liabilities | |||||||
| Accounts Payable | $8,000 | $8,229 | $10,726 | $14,055 | $18,493 | $24,041 | |
| Notes Payable | $0 | $0 | $0 | $0 | $0 | ||
| Current portion of long-term debt | $0 | $10,165 | $11,229 | $12,405 | $13,704 | $15,139 | |
| Income taxes | $0 | $177,475 | $286,275 | $506,339 | $758,593 | $1,161,025 | |
| Accrued Expenses | $0 | $112,166 | $134,394 | $150,389 | $176,468 | $210,053 | |
| Other current liabilities | $0 | $10,000 | $10,000 | $10,000 | $10,000 | $15,000 | |
| Total Current Liabilities | $8,000 | $318,035 | $452,624 | $693,188 | $977,258 | $1,425,258 | |
| Non-Current Liabilities | |||||||
| Long-term debt | $150,000 | $130,634 | $119,405 | $107,000 | $93,296 | $78,157 | |
| Deferred income | $0 | $0 | $0 | $0 | $0 | $0 | |
| Deferred income taxes | |||||||
| Other long-term liabilities | |||||||
| Total Liabilities | $158,000 | $448,669 | $572,029 | $800,188 | $1,070,554 | $1,503,415 | |
| Stockholders' Equity | |||||||
| Capital Stock issued | $10,000 | $10,000 | $10,000 | $10,000 | $10,000 | $10,000 | |
| Additional paid in capital | $0 | $0 | $0 | $0 | $0 | $0 | |
| Retained earnings | $18,115 | $331,471 | $836,930 | $1,730,942 | $3,070,343 | $5,120,295 | |
| Total Equity | $28,115 | $341,471 | $846,930 | $1,740,942 | $3,080,343 | $5,130,295 | |
| Total Liabilities and Equity | $186,115 | $790,140 | $1,418,959 | $2,541,130 | $4,150,897 | $6,633,710 | |
Five-Year Projections—Financial Inputs & Summary
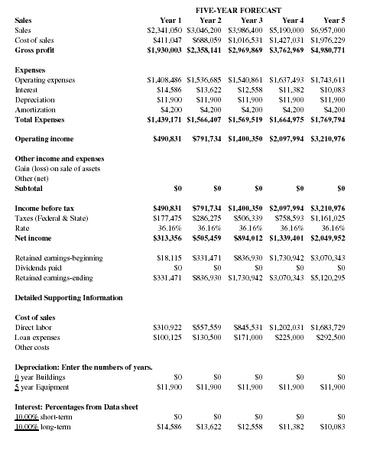
| FIVE-YEAR FORECAST | |||||
| Sales | Year 1 | Year 2 | Year 3 | Year 4 | Year 5 |
| Sales | $2,341,050 | $3,046,200 | $3,986,400 | $5,190,000 | $6,957,000 |
| Cost of sales | $411,047 | $688,059 | $1,016,531 | $1,427,031 | $1,976,229 |
| Gross profit | $1,930,003 | $2,358,141 | $2,969,869 | $3,762,969 | $4,980,771 |
| Expenses | |||||
| Operating expenses | $1,408,486 | $1,536,685 | $1,540,861 | $1,637,493 | $1,743,611 |
| Interest | $14,586 | $13,622 | $12,558 | $11,382 | $10,083 |
| Depreciation | $11,900 | $11,900 | $11,900 | $11,900 | $11,900 |
| Amortization | $4,200 | $4,200 | $4,200 | $4,200 | $4,200 |
| Total Expenses | $1,439,171 | $1,566,407 | $1,569,519 | $1,664,975 | $1,769,794 |
| Operating income | $490,831 | $791,734 | $1,400,350 | $2,097,994 | $3,210,976 |
| Other income and expenses | |||||
| Gain (loss) on sale of assets | |||||
| Other (net) | |||||
| Subtotal | $0 | $0 | $0 | $0 | $0 |
| Income before tax | $490,831 | $791,734 | $1,400,350 | $2,097,994 | $3,210,976 |
| Taxes (Federal & State) | $177,475 | $286,275 | $506,339 | $758,593 | $1,161,025 |
| Rate | 36.16% | 36.16% | 36.16% | 36.16% | 36.16% |
| Net income | $313,356 | $505,459 | $894,012 | $1,339,401 | $2,049,952 |
| Retained earnings-beginning | $18,115 | $331,471 | $836,930 | $1,730,942 | $3,070,343 |
| Dividends paid | $0 | $0 | $0 | $0 | $0 |
| Retained earnings-ending | $331,471 | $836,930 | $1,730,942 | $3,070,343 | $5,120,295 |
| Detailed Supporting Information | |||||
| Cost of sales | |||||
| Direct labor | $310,922 | $557,559 | $845,531 | $1,202,031 | $1,683,729 |
| Loan expenses | $100,125 | $130,500 | $171,000 | $225,000 | $292,500 |
| Other costs | |||||
| Depreciation: Enter the numbers of years. | |||||
| 0 year Buildings | $0 | $0 | $0 | $0 | $0 |
| 5 year Equipment | $11,900 | $11,900 | $11,900 | $11,900 | $11,900 |
| Interest: Percentages from Data sheet | |||||
| 10.00% short-term | $0 | $0 | $0 | $0 | $0 |
| 10.00% long-term | $14,586 | $13,622 | $12,558 | $11,382 | $10,083 |
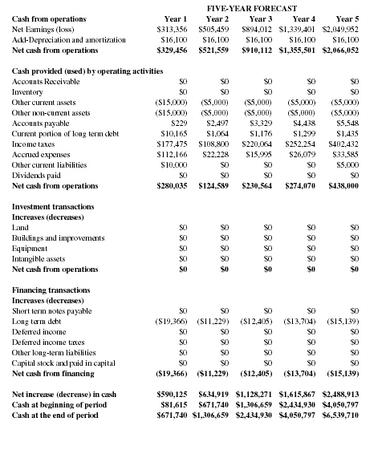
| FIVE-YEAR FORECAST | |||||
| Cash from operations | Year 1 | Year 2 | Year 3 | Year 4 | Year 5 |
| Net Earnings (loss) | $313,356 | $505,459 | $894,012 | $1,339,401 | $2,049,952 |
| Add-Depreciation and amortization | $16,100 | $16,100 | $16,100 | $16,100 | $16,100 |
| Net cash from operations | $329,456 | $521,559 | $910,112 | $1,355,501 | $2,066,052 |
| Cash provided (used) by operating activities | |||||
| Accounts Receivable | $0 | $0 | $0 | $0 | $0 |
| Inventory | $0 | $0 | $0 | $0 | $0 |
| Other current assets | ($15,000) | ($5,000) | ($5,000) | ($5,000) | ($5,000) |
| Other non-current assets | ($15,000) | ($5,000) | ($5,000) | ($5,000) | ($5,000) |
| Accounts payable | $229 | $2,497 | $3,329 | $4,438 | $5,548 |
| Current portion of long term debt | $10,165 | $1,064 | $1,176 | $1,299 | $1,435 |
| Income taxes | $177,475 | $108,800 | $220,064 | $252,254 | $402,432 |
| Accrued expenses | $112,166 | $22,228 | $15,995 | $26,079 | $33,585 |
| Other current liabilities | $10,000 | $0 | $0 | $0 | $5,000 |
| Dividends paid | $0 | $0 | $0 | $0 | $0 |
| Net cash from operations | 280,035 | $124,589 | $230,564 | $274,070 | $438,000 |
| Investment transactions Increases (decreases) | |||||
| Land | $0 | $0 | $0 | $0 | $0 |
| Buildings and improvements | $0 | $0 | $0 | $0 | $0 |
| Equipment | $0 | $0 | $0 | $0 | $0 |
| Intangible assets | $0 | $0 | $0 | $0 | $0 |
| Net cash from operations | $0 | $0 | $0 | $0 | $0 |
| Financing transactions Increases (decreases) | |||||
| Short term notes payable | $0 | $0 | $0 | $0 | $0 |
| Long term debt | ($19,366) | ($11,229) | ($12,405) | ($13,704) | ($15,139) |
| Deferred income | $0 | $0 | $0 | $0 | $0 |
| Deferred income taxes | $0 | $0 | $0 | $0 | $0 |
| Other long-term liabilities | $0 | $0 | $0 | $0 | $0 |
| Capital stock and paid in capital | $0 | $0 | $0 | $0 | $0 |
| Net cash from financing | ($19,366) | ($11,229) | ($12,405) | ($13,704) | ($15,139) |
| Net increase (decrease) in cash | $590,125 | $634,919 | $1,128,271 | $1,615,867 | $2,488,913 |
| Cash at beginning of period | $81,615 | $671,740 | $1,306,659 | $2,434,930 | $4,050,797 |
| Cash at the end of period | $671,740 | $1,306,659 | $2,434,930 | $4,050,797 | $6,539,710 |
Break-Even Analysis - Franchise Operations
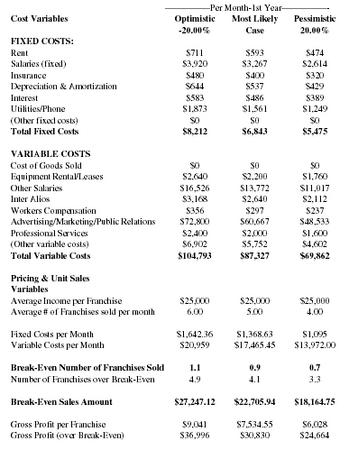
| —————Per Month-1st Year————— | |||
| Cost Variables |
Optimistic
-20.00% |
Most Likely
Case |
Pessimistic
20.00% |
| FIXED COSTS: | |||
| Rent | $711 | $593 | $474 |
| Salaries (fixed) | $3,920 | $3,267 | $2,614 |
| Insurance | $480 | $400 | $320 |
| Depreciation & Amortization | $644 | $537 | $429 |
| Interest | $583 | $486 | $389 |
| Utilities/Phone | $1,873 | $1,561 | $1,249 |
| (Other fixed costs) | $0 | $0 | $0 |
| Total Fixed Costs | $8,212 | $6,843 | $5,475 |
| VARIABLE COSTS | |||
| Cost of Goods Sold | $0 | $0 | $0 |
| Equipment Rental/Leases | $2,640 | $2,200 | $1,760 |
| Other Salaries | $16,526 | $13,772 | $11,017 |
| Inter Alios | $3,168 | $2,640 | $2,112 |
| Workers Compensation | $356 | $297 | $237 |
| Advertising/Marketing/Public Relations | $72,800 | $60,667 | $48,533 |
| Professional Services | $2,400 | $2,000 | $1,600 |
| (Other variable costs) | $6,902 | $5,752 | $4,602 |
| Total Variable Costs | $104,793 | $87,327 | $69,862 |
| Pricing & Unit Sales Variables | |||
| Average Income per Franchise | $25,000 | $25,000 | $25,000 |
| Average # of Franchises sold per month | 6.00 | 5.00 | 4.00 |
| Fixed Costs per Month | $1,642.36 | $1,368.63 | $1,095 |
| Variable Costs per Month | $20,959 | $17,465.45 | $13,972.00 |
| Break-Even Number of Franchises Sold | 1.1 | 0.9 | 0.7 |
| Number of Franchises over Break-Even | 4.9 | 4.1 | 3.3 |
| Break-Even Sales Amount | $27,247.12 | $22,705.94 | $18,164.75 |
| Gross Profit per Franchise | $9,041 | $7,534.55 | $6,028 |
| Gross Profit (over Break-Even) | $36,996 | $30,830 | $24,664 |
This break-even analysis includes as costs directly identified with the franchise operations and assumes 40% of all other expenses can be attributed to supporting franchise operations. This analysis show that the break-even number of franchises to be sold is 0.9 per month and the break-even sales is 22,706 per month.
Break-Even Analysis - Loan Operations
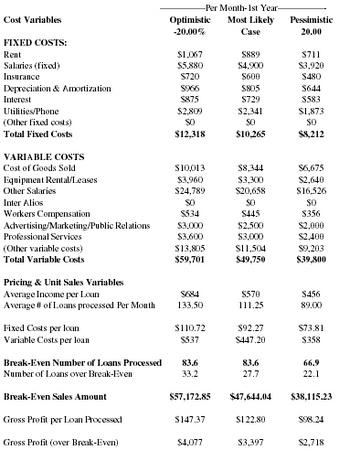
| —————Per Month-1st Year————— | |||
| Cost Variables |
Optimistic
-20.00% |
Most Likely
Case |
Pessimistic
20.00 |
| FIXED COSTS: | |||
| Rent | $1,067 | $889 | $711 |
| Salaries (fixed) | $5,880 | $4,900 | $3,920 |
| Insurance | $720 | $600 | $480 |
| Depreciation & Amortization | $966 | $805 | $644 |
| Interest | $875 | $729 | $583 |
| Utilities/Phone | $2,809 | $2,341 | $1,873 |
| (Other fixed costs) | $0 | $0 | $0 |
| Total Fixed Costs | $12,318 | $10,265 | $8,212 |
| VARIABLE COSTS | |||
| Cost of Goods Sold | $10,013 | $8,344 | $6,675 |
| Equipment Rental/Leases | $3,960 | $3,300 | $2,640 |
| Other Salaries | $24,789 | $20,658 | $16,526 |
| Inter Alios | $0 | $0 | $0 |
| Workers Compensation | $534 | $445 | $356 |
| Advertising/Marketing/Public Relations | $3,000 | $2,500 | $2,000 |
| Professional Services | $3,600 | $3,000 | $2,400 |
| (Other variable costs) | $13,805 | $11,504 | $9,203 |
| Total Variable Costs | $59,701 | $49,750 | $39,800 |
| Pricing & Unit Sales Variables | |||
| Average Income per Loan | $684 | $570 | $456 |
| Average # of Loans processed Per Month | 133.50 | 111.25 | 89.00 |
| Fixed Costs per loan | $110.72 | $92.27 | $73.81 |
| Variable Costs per loan | $537 | $447.20 | $358 |
| Break-Even Number of Loans Processed | 83.6 | 83.6 | 66.9 |
| Number of Loans over Break-Even | 33.2 | 27.7 | 22.1 |
| Break-Even Sales Amount | $57,172.85 | $47,644.04 | $38,115.23 |
| Gross Profit per Loan Processed | $147.37 | $122.80 | $98.24 |
| Gross Profit (over Break-Even) | $4,077 | $3,397 | $2,718 |
The break-even analysis for loan operations indicates that the break-even number of loans is 83.6 per month and the break-even sales is $47,644 per month.
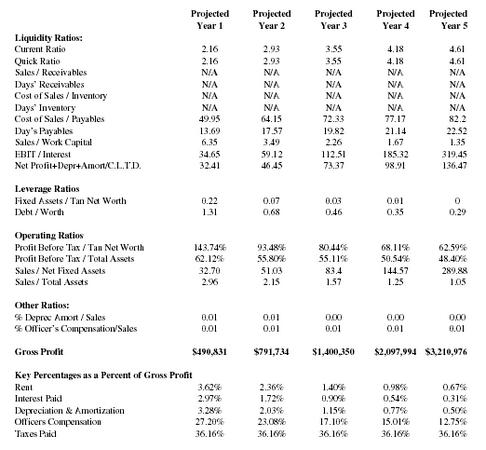
RATIO COMPARISON
Ratio analysis can be one of the most useful financial management tools. It becomes important when you look at the trend of each ratio over time. It also becomes important when compared to averages of a particular industry. Because of the unique nature of National Mortgage we are unable to find comparable industry figures for the combined operations of both loan operations and franchise operations. However, the review of the following ratios is still worthwhile.
|
Projected
Year 1 |
Projected
Year 2 |
Projected
Year 3 |
Projected
Year 4 |
Projected
Year 5 |
|
| Liquidity Ratios: | |||||
| Current Ratio | 2.16 | 2.93 | 3.55 | 4.18 | 4.61 |
| Quick Ratio | 2.16 | 2.93 | 3.55 | 4.18 | 4.61 |
| Sales / Receivables | N/A | N/A | N/A | N/A | N/A |
| Days' Receivables | N/A | N/A | N/A | N/A | N/A |
| Cost of Sales / Inventory | N/A | N/A | N/A | N/A | N/A |
| Days' Inventory | N/A | N/A | N/A | N/A | N/A |
| Cost of Sales / Payables | 49.95 | 64.15 | 72.33 | 77.17 | 82.2 |
| Day's Payables | 13.69 | 17.57 | 19.82 | 21.14 | 22.52 |
| Sales / Work Capital | 6.35 | 3.49 | 2.26 | 1.67 | 1.35 |
| EBIT / Interest | 34.65 | 59.12 | 112.51 | 185.32 | 319.45 |
| Net Profit+Depr+Amort/C.L.T.D. | 32.41 | 46.45 | 73.37 | 98.91 | 136.47 |
| Leverage Ratios | |||||
| Fixed Assets / Tan Net Worth | 0.22 | 0.07 | 0.03 | 0.01 | 0 |
| Debt / Worth | 1.31 | 0.68 | 0.46 | 0.35 | 0.29 |
| Operating Ratios | |||||
| Profit Before Tax / Tan Net Worth | 143.74% | 93.48% | 80.44% | 68.11% | 62.59% |
| Profit Before Tax / Total Assets | 62.12% | 55.80% | 55.11% | 50.54% | 48.40% |
| Sales / Net Fixed Assets | 32.70 | 51.03 | 83.4 | 144.57 | 289.88 |
| Sales / Total Assets | 2.96 | 2.15 | 1.57 | 1.25 | 1.05 |
| Other Ratios: | |||||
| % Deprec Amort / Sales | 0.01 | 0.01 | 0.00 | 0.00 | 0.00 |
| % Officer's Compensation/Sales | 0.01 | 0.01 | 0.01 | 0.01 | 0.01 |
| Gross Profit | $490,831 | $791,734 | $1,400,350 | $2,097,994 | $3,210,976 |
| Key Percentages as a Percent of Gross Profit | |||||
| Rent | 3.62% | 2.36% | 1.40% | 0.98% | 0.67% |
| Interest Paid | 2.97% | 1.72% | 0.90% | 0.54% | 0.31% |
| Depreciation & Amortization | 3.28% | 2.03% | 1.15% | 0.77% | 0.50% |
| Officers Compensation | 27.20% | 23.08% | 17.10% | 15.01% | 12.75% |
| Taxes Paid | 36.16% | 36.16% | 36.16% | 36.16% | 36.16% |
1. The Current Ratio is an approximate measure of a firm's ability to meet its current obligations and is calculated as Current Assets/Current Liabilities.
National's current ratio is on a upward trend. This would indicate that the amount of current assets is increasing steadily as is the "cushion" between current liabilities and the ability to pay them. It could suggest that National Mortgage has a relatively stable position and that there is an opportunity for expanded operations.
2. The Revenue to Working Capital ratio is a measure of the margin of protection for current creditors. It is calculated as Net Revenue/{Current Assets-Current Liabilities}.
National's recent revenue to working capital ratio is on a downward trend. This indicates the level of safety is increasing for creditors.
3. The EBIT to Interest ratio is a measure of ability to meet annual interest payments. It is calculated as Earnings before interest and taxes/Annual Interest Expense.
National's recent EBIT to interest ratio is on a upward trend. This indicates that the company should not have a problem servicing its debt. This could indicate that the company is better able to make interest payments and could possibly handle more debt.
4. The Current Maturities Coverage ratio is a measure of ability to pay current maturities of long-term debt with cash flow from operations. It is calculated as {Net Income + Depreciation, Amortization and Depletion}/Current Portion of Long-Term Debt.
National's recent EBIT to interest ratio is on a upward trend. This indicates that the cash flows available to service debt are increasing relative to the level of debt. This indicates that the company is able to service debt and could possibly indicate additional debt capacity.
5. The Fixed Assets to Tangible Net Worth ratio measures the extent to which owner's equity has been invested in property, plant, and equipment. It is calculated as Net Fixed Assets/ {Equity - Net Intangible Assets}.
National's fixed asset to tangible net worth ratio is on a downward trend. This indicates that the investment in fixed assets relative to net worth is decreasing and results in a larger "cushion" for creditors in the event of liquidation.
6. The Debt to Equity ratio expresses the relationship between capital contributed by creditors and capital contributed by owners. It is calculated as Total Liabilities/Net Worth.
National's recent debt to equity ratio is on a downward trend. This indicates the company is achieving greater long-term financial safety.
7. The Earnings Before Tax to Tangible Net Worth ratio expresses the rate of return on tangible capital employed. It is calculated as (Earnings Before Taxes/{Net Worth-Net Intangible Assets} * 100.
National's earnings Before Tax to Tangible Net Worth ratio is on a downward trend. This indicates that the company is performing well.
Common Size Income Statement
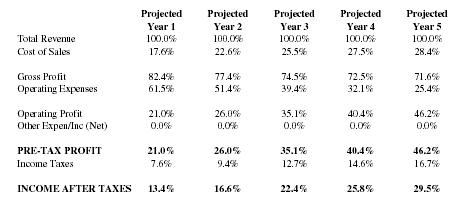
| Projected | Projected | Projected | Projected | Projected | |
| Year 1 | Year 2 | Year 3 | Year 4 | Year 5 | |
| Total Revenue | 100.0% | 100.0% | 100.0% | 100.0% | 100.0% |
| Cost of Sales | 17.6% | 22.6% | 25.5% | 27.5% | 28.4% |
| Gross Profit | 82.4% | 77.4% | 74.5% | 72.5% | 71.6% |
| Operating Expenses | 61.5% | 51.4% | 39.4% | 32.1% | 25.4% |
| Operating Profit | 21.0% | 26.0% | 35.1% | 40.4% | 46.2% |
| Other Expen/Inc (Net) | 0.0% | 0.0% | 0.0% | 0.0% | 0.0% |
| PRE-TAX PROFIT | 21.0% | 26.0% | 35.1% | 40.4% | 46.2% |
| Income Taxes | 7.6% | 9.4% | 12.7% | 14.6% | 16.7% |
| INCOME AFTER TAXES | 13.4% | 16.6% | 22.4% | 25.8% | 29.5% |
Common Size Balance Sheet
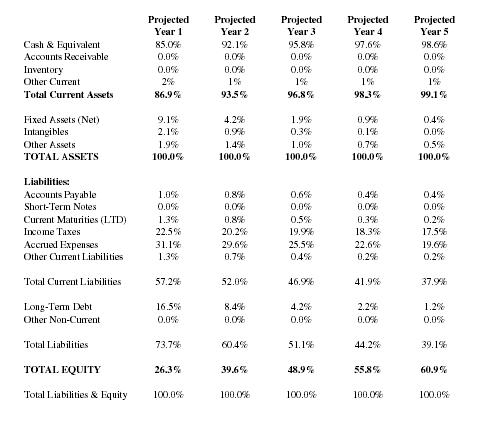
| Projected | Projected | Projected | Projected | Projected | |
| Year 1 | Year 2 | Year 3 | Year 4 | Year 5 | |
| Cash & Equivalent | 85.0% | 92.1% | 95.8% | 97.6% | 98.6% |
| Accounts Receivable | 0.0% | 0.0% | 0.0% | 0.0% | 0.0% |
| Inventory | 0.0% | 0.0% | 0.0% | 0.0% | 0.0% |
| Other Current | 2% | 1% | 1% | 1% | 1% |
| Total Current Assets | 86.9% | 93.5% | 96.8% | 98.3% | 99.1% |
| Fixed Assets (Net) | 9.1% | 4.2% | 1.9% | 0.9% | 0.4% |
| Intangibles | 2.1% | 0.9% | 0.3% | 0.1% | 0.0% |
| Other Assets | 1.9% | 1.4% | 1.0% | 0.7% | 0.5% |
| TOTAL ASSETS | 100.0% | 100.0% | 100.0% | 100.0% | 100.0% |
| Liabilities: | |||||
| Accounts Payable | 1.0% | 0.8% | 0.6% | 0.4% | 0.4% |
| Short-Term Notes | 0.0% | 0.0% | 0.0% | 0.0% | 0.0% |
| Current Maturities (LTD) | 1.3% | 0.8% | 0.5% | 0.3% | 0.2% |
| Income Taxes | 22.5% | 20.2% | 19.9% | 18.3% | 17.5% |
| Accrued Expenses | 31.1% | 29.6% | 25.5% | 22.6% | 19.6% |
| Other Current Liabilities | 1.3% | 0.7% | 0.4% | 0.2% | 0.2% |
| Total Current Liabilities | 57.2% | 52.0% | 46.9% | 41.9% | 37.9% |
| Long-Term Debt | 16.5% | 8.4% | 4.2% | 2.2% | 1.2% |
| Other Non-Current | 0.0% | 0.0% | 0.0% | 0.0% | 0.0% |
| Total Liabilities | 73.7% | 60.4% | 51.1% | 44.2% | 39.1% |
| TOTAL EQUITY | 26.3% | 39.6% | 48.9% | 55.8% | 60.9% |
| Total Liabilities & Equity | 100.0% | 100.0% | 100.0% | 100.0% | 100.0% |
Cash Flow Projection - First Year
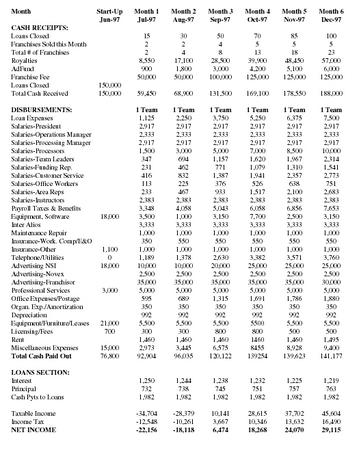
| Month | Start-Up | Month 1 | Month 2 | Month 3 | Month 4 | Month 5 | Month 6 |
| Jun-97 | Jul-97 | Aug-97 | Sep-97 | Oct-97 | Nov-97 | Dec-97 | |
| CASH RECEIPTS: | |||||||
| Loans Closed | 15 | 30 | 50 | 70 | 85 | 100 | |
| Franchises Sold this Month | 2 | 2 | 4 | 5 | 5 | 5 | |
| Total # of Franchises | 2 | 4 | 8 | 13 | 18 | 23 | |
| Royalties | 8,550 | 17,100 | 28,500 | 39,900 | 48,450 | 57,000 | |
| AdFund | 900 | 1,800 | 3,000 | 4,200 | 5,100 | 6,000 | |
| Franchise Fee | 50,000 | 50,000 | 100,000 | 125,000 | 125,000 | 125,000 | |
| Loans Closed | 150,000 | ||||||
| Total Cash Received | 150,000 | 59,450 | 68,900 | 131,500 | 169,100 | 178,550 | 188,000 |
| DISBURSEMENTS: | 1 Team | 1 Team | 1 Team | 1 Team | 1 Team | 1 Team | |
| Loan Expenses | 1,125 | 2,250 | 3,750 | 5,250 | 6,375 | 7,500 | |
| Salaries-President | 2,917 | 2,917 | 2,917 | 2,917 | 2,917 | 2,917 | |
| Salaries-Operations Manager | 2,333 | 2,333 | 2,333 | 2,333 | 2,333 | 2,333 | |
| Salaries-Processing Manager | 2,917 | 2,917 | 2,917 | 2,917 | 2,917 | 2,917 | |
| Salaries-Processors | 1,500 | 3,000 | 5,000 | 7,000 | 8,500 | 10,000 | |
| Salaries-Team Leaders | 347 | 694 | 1,157 | 1,620 | 1,967 | 2,314 | |
| Salaries-Funding Rep. | 231 | 462 | 771 | 1,079 | 1,310 | 1,541 | |
| Salaries-Customer Service | 416 | 832 | 1,387 | 1,941 | 2,357 | 2,773 | |
| Salaries-Office Workers | 113 | 225 | 376 | 526 | 638 | 751 | |
| Salaries-Area Reps | 233 | 467 | 933 | 1,517 | 2,100 | 2,683 | |
| Salaries-Instructors | 2,383 | 2,383 | 2,383 | 2,383 | 2,383 | 2,383 | |
| Payroll Taxes & Benefits | 3,348 | 4,058 | 5,043 | 6,058 | 6,856 | 7,653 | |
| Equipment, Software | 18,000 | 3,500 | 1,000 | 3,150 | 7,700 | 2,500 | 3,150 |
| Inter Alios | 3,333 | 3,333 | 3,333 | 3,333 | 3,333 | 3,333 | |
| Maintenance Repair | 1,000 | 1,000 | 1,000 | 1,000 | 1,000 | 1,000 | |
| Insurance-Work. Comp/E&O | 350 | 550 | 550 | 550 | 550 | 550 | |
| Insurance-Other | 1,100 | 1,000 | 1,000 | 1,000 | 1,000 | 1,000 | 1,000 |
| Telephone/Utilities | 0 | 1,189 | 1,378 | 2,630 | 3,382 | 3,571 | 3,760 |
| Advertising NSI | 18,000 | 10,000 | 10,000 | 20,000 | 25,000 | 25,000 | 25,000 |
| Advertising-Novex | 2,500 | 2,500 | 2,500 | 2,500 | 2,500 | 2,500 | |
| Advertising-Franchisor | 35,000 | 35,000 | 35,000 | 35,000 | 35,000 | 30,000 | |
| Professional Services | 3,000 | 5,000 | 5,000 | 5,000 | 5,000 | 5,000 | 5,000 |
| Office Expenses/Postage | 595 | 689 | 1,315 | 1,691 | 1,786 | 1,880 | |
| Organ. Exp./Amortization | 350 | 350 | 350 | 350 | 350 | 350 | |
| Depreciation | 992 | 992 | 992 | 992 | 992 | 992 | |
| Equipment/Furniture/Leases | 21,000 | 5,500 | 5,500 | 5,500 | 5500 | 5,500 | 5,500 |
| Licensing/Fees | 700 | 300 | 300 | 800 | 800 | 500 | 500 |
| Rent | 1,460 | 1,460 | 1,460 | 1460 | 1,460 | 1,495 | |
| Miscellaneous Expenses | 15,000 | 2,973 | 3,445 | 6,575 | 8455 | 8,928 | 9,400 |
| Total Cash Paid Out | 76,800 | 92,904 | 96,035 | 120,122 | 139254 | 139,623 | 141,177 |
| LOANS SECTION: | |||||||
| Interest | 1,250 | 1,244 | 1,238 | 1,232 | 1,225 | 1,219 | |
| Principal | 732 | 738 | 745 | 751 | 757 | 763 | |
| Cash Pyts to Loans | 1,982 | 1,982 | 1,982 | 1,982 | 1,982 | 1,982 | |
| Taxable Income | -34,704 | -28,379 | 10,141 | 28,615 | 37,702 | 45,604 | |
| Income Tax | -12,548 | -10,261 | 3,667 | 10,346 | 13,632 | 16,490 | |
| NET INCOME | -22,156 | -18,118 | 6,474 | 18,268 | 24,070 | 29,115 |
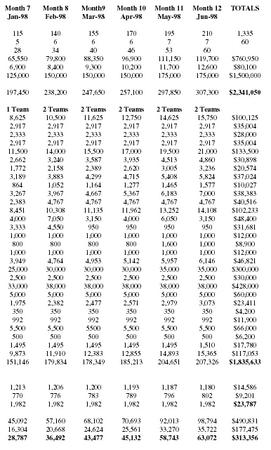
| Month 7 | Month 8 | Month9 | Month 10 | Month 11 | Month 12 | TOTALS |
| Jan-98 | Feb-98 | Mar-98 | Apr-98 | May-98 | Jun-98 | |
| 115 | 140 | 155 | 170 | 195 | 210 | 1,335 |
| 5 | 6 | 6 | 6 | 7 | 7 | 60 |
| 28 | 34 | 40 | 46 | 53 | 60 | |
| 65,550 | 79,800 | 88,350 | 96,900 | 111,150 | 119,700 | $760,950 |
| 6,900 | 8,400 | 9,300 | 10,200 | 11,700 | 12,600 | $80,100 |
| 125,000 | 150,000 | 150,000 | 150,000 | 175,000 | 175,000 | $1,500,000 |
| 197,450 | 238,200 | 247,650 | 257,100 | 297,850 | 307,300 | $2,341,050 |
| 1 Team | 2 Teams | 2 Teams | 2 Teams | 2 Teams | 2 Teams | |
| 8,625 | 10,500 | 11,625 | 12,750 | 14,625 | 15,750 | $100,125 |
| 2,917 | 2,917 | 2,917 | 2,917 | 2,917 | 2,917 | $35,004 |
| 2,333 | 2,333 | 2,333 | 2,333 | 2,333 | 2,333 | $28,000 |
| 2,917 | 2,917 | 2,917 | 2,917 | 2,917 | 2,917 | $35,004 |
| 11,500 | 14,000 | 15,500 | 17,000 | 19,500 | 21,000 | $133,500 |
| 2,662 | 3,240 | 3,587 | 3,935 | 4,513 | 4,860 | $30,898 |
| 1,772 | 2,158 | 2,389 | 2,620 | 3,005 | 3,236 | $20,574 |
| 3,189 | 3,883 | 4,299 | 4,715 | 5,408 | 5,824 | $37,024 |
| 864 | 1,052 | 1,164 | 1,277 | 1,465 | 1,577 | $10,027 |
| 3,267 | 3,967 | 4,667 | 5,367 | 6,183 | 7,000 | $38,383 |
| 2,383 | 4,767 | 4,767 | 4,767 | 4,767 | 4,767 | $40,516 |
| 8,451 | 10,308 | 11,135 | 11,962 | 13,252 | 14,108 | $102,233 |
| 4,000 | 7,050 | 3,150 | 4,000 | 6,050 | 3,150 | $48,400 |
| 3,333 | 4,550 | 950 | 950 | 950 | 950 | $31,681 |
| 1,000 | 1,000 | 1,000 | 1,000 | 1,000 | 1,000 | $12,000 |
| 800 | 800 | 800 | 800 | 1,600 | 1,000 | $8,900 |
| 1,000 | 1,000 | 1,000 | 1,000 | 1,000 | 1,000 | $12,000 |
| 3,949 | 4,764 | 4,953 | 5,142 | 5,957 | 6,146 | $46,821 |
| 25,000 | 30,000 | 30,000 | 30,000 | 35,000 | 35,000 | $300,000 |
| 2,500 | 2,500 | 2,500 | 2,500 | 2,500 | 2,500 | $30,000 |
| 33,000 | 38,000 | 38,000 | 38,000 | 38,000 | 38,000 | $428,000 |
| 5,000 | 5,000 | 5,000 | 5,000 | 5,000 | 5,000 | $60,000 |
| 1,975 | 2,382 | 2,477 | 2,571 | 2,979 | 3,073 | $23,411 |
| 350 | 350 | 350 | 350 | 350 | 350 | $4,200 |
| 992 | 992 | 992 | 992 | 992 | 992 | $11,900 |
| 5,500 | 5,500 | 5500 | 5,500 | 5,500 | 5,500 | $66,000 |
| 500 | 500 | 500 | 500 | 500 | 500 | $6,200 |
| 1,495 | 1,495 | 1,495 | 1,495 | 1,495 | 1,510 | $17,780 |
| 9,873 | 11,910 | 12,383 | 12,855 | 14,893 | 15,365 | $117,053 |
| 151,146 | 179,834 | 178,349 | 185,213 | 204,651 | 207,326 | $1,835,633 |
| 1,213 | 1,206 | 1,200 | 1,193 | 1,187 | 1,180 | $14,586 |
| 770 | 776 | 783 | 789 | 796 | 802 | $9,201 |
| 1,982 | 1,982 | 1,982 | 1,982 | 1,982 | 1,982 | $23,787 |
| 45,092 | 57,160 | 68,102 | 70,693 | 92,013 | 98,794 | $490,831 |
| 16,304 | 20,668 | 24,624 | 25,561 | 33,270 | 35,722 | $177,475 |
| 28,787 | 36,492 | 43,477 | 45,132 | 58,743 | 63,072 | $313,356 |
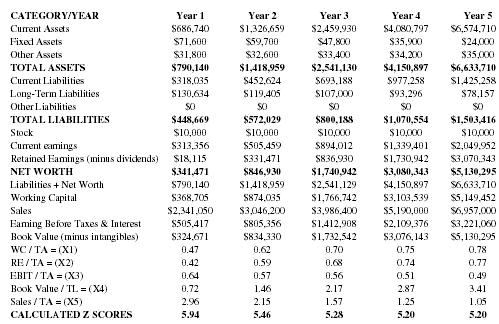
| CATEGORY/YEAR | Year 1 | Year 2 | Year 3 | Year 4 | Year 5 |
| Current Assets | $686,740 | $1,326,659 | $2,459,930 | $4,080,797 | $6,574,710 |
| Fixed Assets | $71,600 | $59,700 | $47,800 | $35,900 | $24,000 |
| Other Assets | $31,800 | $32,600 | $33,400 | $34,200 | $35,000 |
| TOTAL ASSETS | $790,140 | $1,418,959 | $2,541,130 | $4,150,897 | $6,633,710 |
| Current Liabilities | $318,035 | $452,624 | $693,188 | $977,258 | $1,425,258 |
| Long-Term Liabilities | $130,634 | $119,405 | $107,000 | $93,296 | $78,157 |
| Other Liabilities | $0 | $0 | $0 | $0 | $0 |
| TOTAL LIABILITIES | $448,669 | $572,029 | $800,188 | $1,070,554 | $1,503,416 |
| Stock | $10,000 | $10,000 | $10,000 | $10,000 | $10,000 |
| Current earnings | $313,356 | $505,459 | $894,012 | $1,339,401 | $2,049,952 |
| Retained Earnings (minus dividends) | $18,115 | $331,471 | $836,930 | $1,730,942 | $3,070,343 |
| NET WORTH | $341,471 | $846,930 | $1,740,942 | $3,080,343 | $5,130,295 |
| Liabilities + Net Worth | $790,140 | $1,418,959 | $2,541,129 | $4,150,897 | $6,633,710 |
| Working Capital | $368,705 | $874,035 | $1,766,742 | $3,103,539 | $5,149,452 |
| Sales | $2,341,050 | $3,046,200 | $3,986,400 | $5,190,000 | $6,957,000 |
| Earning Before Taxes & Interest | $505,417 | $805,356 | $1,412,908 | $2,109,376 | $3,221,060 |
| Book Value (minus intangibles) | $324,671 | $834,330 | $1,732,542 | $3,076,143 | $5,130,295 |
| WC / TA = (X1) | 0.47 | 0.62 | 0.70 | 0.75 | 0.78 |
| RE / TA = (X2) | 0.42 | 0.59 | 0.68 | 0.74 | 0.77 |
| EBIT / TA = (X3) | 0.64 | 0.57 | 0.56 | 0.51 | 0.49 |
| Book Value / TL = (X4) | 0.72 | 1.46 | 2.17 | 2.87 | 3.41 |
| Sales / TA = (X5) | 2.96 | 2.15 | 1.57 | 1.25 | 1.05 |
| CALCULATED Z SCORES | 5.94 | 5.46 | 5.28 | 5.20 | 5.20 |
The Z Score Formula = 0.717*(X1) + 0.847*(X2) + 3.107*(X3) + 0.420*(X4) + 0.998*(X5)
If the Z Score is Greater than or Equal to 2.9 the subject firm is apparently safe from bankruptcy.
If the Z Score is Less than or Equal to 1.2 the subject firm may be destined for bankruptcy.
If the Z Score is between 1.23 and 2.9 the firm is in a gray area and steps could be taken by management to correct existing or potential problems in order to avoid bankruptcy.
Z Score analysis is a statistical method developed to forecast bankruptcy.
It is over 90% accurate one year into the future and 80% accurate for the second year.
In this instance we used the projected figures to determine the above scores.
The Z scores indicated above are all well over 2.91 which indicates that the company will not be a candidate for bankruptcy if it can achieve the goals outlined in this plan.
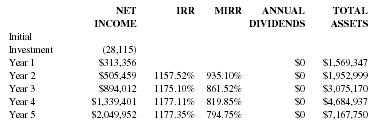
| NET INCOME | IRR | MIRR | ANNUAL DIVIDENDS | TOTAL ASSETS | |
| Initial Investment | (28,115) | ||||
| Year 1 | $313,356 | $0 | $1,569,347 | ||
| Year 2 | $505,459 | 1157.52% | 935.10% | $0 | $1,952,999 |
| Year 3 | $894,012 | 1175.10% | 861.52% | $0 | $3,075,170 |
| Year 4 | $1,339,401 | 1177.11% | 819.85% | $0 | $4,684,937 |
| Year 5 | $2,049,952 | 1177.35% | 794.75% | $0 | $7,167,750 |
ASSUMPTIONS:
Income figures are after taxes
Dividend Payout = 50% of After Tax Income
Reinvestment rate = 7%
IRR = INTERNAL RATE OF RETURN
MIRR = MODIFIED RATE OF RETURN
ROI = RATE OF RETURN ON OWNER'S INVESTMENT
ROA = RATE OF RETURN ON TOTAL ASSETS
IRR = the interest rate received for an investment and income that occur at regular periods.
MIRR = adds the cost of funds and interest received on reinvestment of cash to the IRR.
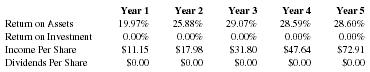
| Year 1 | Year 2 | Year 3 | Year 4 | Year 5 | |
| Return on Assets | 19.97% | 25.88% | 29.07% | 28.59% | 28.60% |
| Return on Investment | 0.00% | 0.00% | 0.00% | 0.00% | 0.00% |
| Income Per Share | $11.15 | $17.98 | $31.80 | $47.64 | $72.91 |
| Dividends Per Share | $0.00 | $0.00 | $0.00 | $0.00 | $0.00 |
CONCLUSIONS & SUMMARY
A review of the first several years of National's existence show that it has been very successful in serving customers with less than perfect credit in the Seattle and Spokane markets. Each subsequent year has shown significant improvement in profitability and operational performance.
During the first two years, the company concentrated upon being profitable, building its staff, and equipping its office. National Mortgage is now ready to step up to the next level and utilize economies of scale to make the projected numbers even more striking. It wishes to take its unique concept to a national level by selling franchises to people throughout the country. These franchises would generate loans which would be processed by the main processing center in Seattle.
The projections in this business plan are extremely conservative according to Merrill Lynch and ABC. With their help the chances for continued growth are excellent. Once franchise applicants are qualified, they will join the growing network of brokers, under National Mortgage, who specialize in helping people with less than perfect credit.
To achieve our goals, we must be able to raise $150,000 in new funding. This may come from investors, lenders, or a guaranteed loan through the Small Business Administration.
Comment about this article, ask questions, or add new information about this topic: