Specialty Car Wash
BUSINESS PLAN A.B.C., INC.
1004 East Towne Square
Madison, Wisconsin 53705
The purpose of A.B.C., Inc. is to provide the area with a unique facility that combines both a full service car wash with a quality restaurant. People will be able to get their cars cleaned and/or detailed while they have a pleasant, quality meal. This plan was provided by Ameriwest Business Consultants, Inc.
- EXECUTIVE SUMMARY
- OBJECTIVES & GOALS, AND STRATEGIES FOR ACHIEVING THEM
- BUSINESS DESCRIPTION, STATUS, & OUTLOOK
- MANAGEMENT & OWNERSHIP
- THE SERVICE (AN UNFILLED NEED)
- UNIQUENESS OF THE SERVICE
- MARKET ANALYSIS
- MARKETING STRATEGIES
- FINANCIAL PLANS
- CONCLUSIONS & SUMMARY
EXECUTIVE SUMMARY
BUSINESS DESCRIPTION
Americans began a love affair with their cars as soon as the first one rolled off the assembly line. An integral part of this affair is keeping the family automobile clean and looking good. It didn't take long for "car laundries" to develop to make it easier to keep our cars looking great. Since these early car washes, we have seen a variety of different types of car washes develop around the country. We have seen automated, coin-operated, and brushless car washes come and go. We have seen car wash boutiques that combine one or more other businesses with the convenience of a car wash.
The purpose of A.B.C., Inc. is to provide the area with a unique facility that combines both a full service car wash with a quality restaurant. People will be able to get their cars cleaned and/or detailed while they have a pleasant, quality meal. This type of operation is unique to southern Wisconsin. The atmosphere will be friendly and open. The business will display a new attitude. It will treat customers like first-class citizens and try to make them feel like they are at home. We will also offer a variety of gift-related items. The services will be offered at a competitive price and pricing will be reviewed periodically.
The operating hours will be Monday through Sunday from 7:00 A.M. through 7:00 P.M. We will review our hours periodically and extend them to meet demand, when necessary.
CURRENT POSITION AND FUTURE OUTLOOK
The business is in a start-up mode. It is a Wisconsin for profit "C" corporation. Operations will be conducted in a 10,000-square-foot building located on a 5-acre site on East Towne Square, which is just a half-block south of Plymouth Road. It is approximately one half mile west of I-90. We estimate we will serve 80,000 restaurant and gift shop customers and 98,550 car wash customers the first year. This is a conservative estimate and our projections do reflect the seasonal nature of each. More customers of the car wash will be served during months with bad weather and more customers in the restaurant and gift shop will be served during the summer. To attain these goals we will use a combination of media advertising, flyers, and word-of-mouth. The customers are there, the experience and ability are there and, with a proper funding, we are convinced the profit will be there.
MANAGEMENT AND OWNERSHIP
The company is set up as a corporation with David Odle and his wife, Sally, owning 100% of all outstanding stock. David will serve as president. Sally Odle will serve as vice president and manager of the restaurant. Kirt Lansing will serve as secretary, treasurer, and manager of the car wash. David will be involved in sales, public relations, advertising, planning, and equipment purchases, and will provide the function as general contractor for the project. Sally will oversee the restaurant operation and will be involved in sales, public relations, advertising, planning, insurance, purchasing, labor, and equipment purchases. Kirt Lansing will manage the day-to-day operations of the car wash and will be involved in sales, public relations, advertising, office management, personnel, operations, planning, purchasing, labor and equipment purchases, and maintenance. The business will employ additional employees who will be involved in cooking and waiting on tables in the restaurant, and as laborers on the car wash line and for additional support. They will be a combination of part-time and full-time. When volume picks up, additional part-time or full-time employees will be hired, as the workload requires. Ameriwest Business Consultants, Inc. will provide help in additional areas such as planning and general business advising when necessary and to supplement the Odles' overall business knowledge. The services of an accountant, attorney, and a qualified insurance agent will be retained.
UNIQUENESS AND DIFFERENTIATION OF THE SERVICE
A.B.C., Inc. will be unique in this part of Wisconsin. The combination of a car wash and a full-service restaurant will provide the ultimate in service to our customers. We will appeal to a wide spectrum of clientele. Nowhere else in southern Wisconsin does an operation combine the services of a car wash and detailing center along with those of a full-service restaurant.
The idea of combining a car wash and restaurant is to provide customers with an informal, social setting and atmosphere and to couple that with a level of convenience that cannot be found elsewhere. It also will prolong their stay by providing food or limited drink while their cars are being cleaned and detailed. In addition, on a limited basis, we may cater to private parties and special groups in the restaurant throughout the year, especially after normal closing hours.
The growth potential is virtually unlimited for the greater Madison area. The population is growing at an accelerated rate. It is rare in today's business world to find a true market void. That is exactly what A.B.C., Inc. has done. Our facility will have little true competition in southern Madison.
FUNDS REQUIRED AND USAGE
To finalize the project, A.B.C. will need to obtain new funding of approximately $1,400,000. This coupled with the $295,000 investment by the owners will provide the funding to acquire the land, build the improvements, purchase the machinery and equipment, and provide furnishings for the restaurant and initial inventory, supplies, and working capital for the restaurant, gift shop, and car wash.
Projected Five-Year Income Statement
| (MOST LIKELY CASE) |
Projected
2000 |
Projected
2001 |
Projected
2002 |
Projected
2003 |
Projected
2004 |
| Total Revenue | 1,960,830 | 2,058,872 | 2,182,404 | 2,335,172 | 2,521,986 |
| Cost of Sales | 282,649 | 296,781 | 314,588 | 336,609 | 363,538 |
| Gross Profit | 1,678,181 | 1,762,091 | 1,867,816 | 1,998,563 | 2,158,448 |
| Selling, General Expense | 1,426,404 | 1,479,208 | 1,537,450 | 1,601,664 | 1,672,454 |
| Income Before Taxes | 251,777 | 282,883 | 330,366 | 396,899 | 485,994 |
| Income Taxes | 82,907 | 94,417 | 111,985 | 136,603 | 169,568 |
| INCOME AFTER TAXES | 168,870 | 188,466 | 218,381 | 260,296 | 316,426 |
| (OPTIMISTIC CASE) | |||||
| Total Revenue | 2,352,996 | 2,470,646 | 2,618,885 | 2,802,206 | 3,026,383 |
| Cost of Sales | 339,179 | 356,137 | 377,506 | 403,931 | 436,246 |
| Gross Profit | 2,013,817 | 2,114,509 | 2,241,379 | 2,398,276 | 2,590,138 |
| Selling, General Expense | 1,711,685 | 1,775,050 | 1,844,940 | 1,921,997 | 2,006,945 |
| Income Before Taxes | 302,132 | 339,460 | 396,439 | 476,279 | 583,193 |
| Income Taxes | 99,488 | 113,300 | 134,382 | 163,924 | 203,482 |
| INCOME AFTER TAXES | 202,644 | 226,159 | 262,057 | 312,355 | 379,711 |
| (PESSIMISTIC CASE) |
Projected
2000 |
Projected
2001 |
Projected
2002 |
Projected
2003 |
Projected
2004 |
| Total Revenue | 1,568,664 | 1,647,098 | 1,745,923 | 1,868,138 | 2,017,589 |
| Cost of Sales | 226,119 | 237,425 | 251,670 | 269,287 | 290,830 |
| Gross Profit | 1,342,545 | 1,409,673 | 1,494,253 | 1,598,850 | 1,726,758 |
| Selling, General Expense | 1,141,123 | 1,183,366 | 1,229,960 | 1,281,331 | 1,337,963 |
| Income Before Taxes | 201,422 | 226,306 | 264,293 | 317,519 | 388,795 |
| Income Taxes | 66,326 | 75,534 | 89,588 | 109,282 | 135,654 |
| INCOME AFTER TAXES | 135,096 | 150,773 | 174,705 | 208,237 | 253,141 |
Notes:
- The most likely case assumes 90,000 customers the first year for the restaurant and gift shop and 105,550 customers for the car wash. The optimistic case assumes revenues and expenses will increase 15% over the most likely case. The pessimistic case assumes revenues and expenses will decrease 15% below the most likely case above.
- Cost of goods sold for the car wash will equal 6.44% of sales, 40% for the restaurant, and 53.33% for the gift shop.
OBJECTIVES & GOALS, AND STRATEGIES FOR ACHIEVING THEM
- To provide a high quality, full-service car wash which will include complete car detailing, restaurant, and gift shop so that customers will perceive great value and give them the opportunity to have an enjoyable meal while their car is being washed or detailed.
- Service an average of 80,000 customers in 1999 for the restaurant and gift shop and 98,550 customers the first year for the car wash. We have projected a conservative increase of 5%, 6%, 7%, and 8% for years 2-5.
- To repay the entire loan amount by the end of the fifteenth year and to provide the shareholders with an exceptionally stable income.
- Our goal is to become the premier car wash destination in Madison during the next two years.
- A.B.C., Inc. plans to closely monitor changing technology to be certain that the company is using the latest and most cost effective equipment and that it keeps up with current trends in the marketplace.
When growth has stabilized we plan to add extra services for customer convenience such as delivery, Internet order taking, greater selection of products (especially seasonal), and continued growth of the food operations. In addition to the above goals we will survey our customers and make changes in our programs and add services to meet their changing ideas in the marketplace.
To obtain the first two sets of goals we will try to maximize sales with an extensive campaign to promote our service. We will utilize the radio stations and newspapers along with brochures, media advertising, pamphlets, use of coupons, referrals, and a variety of other advertising and marketing tools to reach the customer base of southern Madison. We expect to flood the market with advertising until consumers become aware of us and more comfortable with our company. As we grow, word-of-mouth referrals will bring in increasing numbers of customers and we will reduce our reliance on advertising.
The dominant driving force behind our company will be profit and income and to provide the best possible related products and service.
To become the premier car wash and detailing center in southern Madison, we will offer outstanding quality, good hours, exceptional service, and reasonable pricing. We will listen to our customers and conduct surveys.
BUSINESS DESCRIPTION, STATUS, & OUTLOOK
Both cars and car washes have come a long way since the days of cranks and pails and sponges. The first car wash was opened in Detroit in 1914 when two young fellows opened the world's first car wash: the Automated Laundry. It was basically a pail and sponge type of operation. These early "Automobile Laundries" have evolved into sophisticated operations today.
Back in 1914 the cars had to be left all day, since they were pushed through the system manually, and even brass parts were removed for polishing by hand. Twenty-five years later, the first crude "automatic" conveyor car wash was opened in Hollywood, California. On busy days, as many as forty men splashed in the tunnel, soaping, scrubbing, wiping, and drying cars as they were pulled through.
Today, there are over 20,000 automatic car washes, many of which can completely wash and dry a car in less than thirty seconds, without it being touched by human hands. Some car washes handle 20,000 cars per month and net over $200,000 a year before income taxes. Net profits of $50,000 to $75,000 are common.
What happens when it rains? That seems to be the first question that prospective car wash owners ask. If your part of the country has 250 rain free days a year, you're in a good position to do business. Madison has 310 days of sunshine a year. We get just enough rain and snow to make it necessary to frequently wash the car. And remember that night or morning rains don't necessarily hurt business. In fact, the day after a heavy rain, business is usually better than normal in car washes because autos get muddy and sloppy driving around.
Car washes in northern climates do much more business during the winter because car owners are concerned with keeping their cars free of the corrosive road salts used for melting snow and ice.
One thing is certain: car washes are more popular than ever. Like so many other household chores, washing the car is becoming just too much work for busy professionals. Given a choice between spending a Saturday afternoon relaxing or being up to their armpits in soap, most working people will opt for a day of rest. And that spells good news for the car wash industry— both currently and for the future.
A successful car wash business is dependent on 3 factors:
- location
- vehicle flow
- producing a good wash
Our goal is to not have one dissatisfied customer leave our business. With this business we will have to sell and resell our services over and over again. The National Restaurant Association estimates that satisfied customers tell an average of .7 (seven-tenths) other people they have had a positive experience. Unhappy customers tell 7 to 11 other people of their bad experience.
Ongoing decisions in car wash management include: maintenance of equipment, financial management, control of waste, personnel management, front man and managers, wash line crew, cashier, training programs, and establishing rules (hours of work, appearance, penalties, etc.). All of these areas will all be supervised by Kirt Lansing who has had experience in car washes and in other management situations.
Ongoing decision-making in the restaurant will include design of the menu, set-up, layout, server stations, dishwashing, furnishings, cashier station, rest rooms, traffic flow of employees, order taking procedures, error handling, supplies, inventory control, staffing, training, and cleanup. Sally Odle has previously owned and successfully run two restaurants and has the experience to supervise this operation.
We are selling cleanliness. We also realize that first impressions are of utmost importance and will always put our best foot forward.
There are nearly 500,000 restaurant units in the United States. However, there are very few that have been combined with full service car washes. The match seems perfect. People need their cars cleaned and they also need to eat. In today's busy world, it seems only natural to combine the two into one operation.
To maintain operations, the business will require sales tax licenses, health department permits, liquor license, and occupational use license.
The future holds the promise for almost unlimited growth and income as the business matures and considers other markets and products. Complementary products such as fleet service, additional seasonal products, and other functions at the restaurant also will be considered in the future in response to customer surveys indicating customer's wants and needs. Enhanced food services will be offered in the future as the needs are demonstrated. Future plans include additional locations and perhaps some limited franchising of this new concept.
MANAGEMENT & OWNERSHIP
David Odle graduated from Dane County Community College in 1970 with an Associate Degree in Food Service. He also received a Certificate in Business from the Mid-Central Business College. David served as a police officer for the city of Madison from 1960-1990. From 1981 to present, David founded Blue Mound Builders, which specializes in home construction. David also is licensed for commercial construction and is clearly competent to serve as general contractor for the proposed project. His 18 years' experience as a successful builder and business owner has demonstrated David's supervision and leadership skills.
Sally Odle has owned and managed several business operations. Between 1978-1980 she started and managed a pig litter operation. From 1980-1984 she owned and managed two restaurants named Black Feet and Fancy Food in Mauston. She designed and managed these restaurants. She was involved with menu design and built both into popular restaurants that earned reputations for high quality and affordable pricing. From 1986 to 1988 she owned her own real estate business, the Elite Real Estate Group, which has now merged with Monmouth and Associates. Sally's 30 years' experience in all areas of responsibility obviously makes her highly qualified to start and manage the proposed restaurant. Sally has strong leadership and people skills and has developed strong creative instincts, which she has often transformed into successful operations.
A.B.C., Inc. will supplement its employees' skills by using outside consultants in areas such as legal work, income tax preparation, insurance, and general business advising. The business was set up as a corporation primarily for liability reasons and makes it easier to secure investors. To continue operation, a mix of full-and part-time employees will be utilized to help in areas such as cooking, waiting on tables, and for labor. As the business grows, additional part-time or full-time employees may be added to handle the increased workload.
THE SERVICE—AN UNFILLED NEED
Wisconsin growth in families is the ninth greatest in the country. The past decade has seen this segment of the population grow by more than thirty percent. It is growing five and a half times as fast as the general population. This trend will also help our proposed venture.
The few existing car washes and restaurants that cater to our clientele are not nearly as convenient or service oriented as our operation. Nowhere else are these two types of operations combined on one site. Competitors seem to pay little attention to detail and seeing that the customer is satisfied. A.B.C., Inc. and its ownership will embrace the concept of trying to become a focal point for our clientele and never having a dissatisfied customer leave our property.
The timing for such a business is perfect. A significant window of opportunity exists for A.B.C., Inc. to take advantage of the huge growth of the area and start this kind of business. This business will be providing the "Right Service at the Right Time to the right clientele."
UNIQUENESS OF THE SERVICE
It is rare in today's world that a true market void exists. Our service will meet the "unfilled need" described above by providing customers with competitively priced, high service car wash and detailing facility combined with the services of a full-service restaurant on the premises. We will be unique to Madison area and indeed all of Wisconsin.
Customers will be attracted because of our atmosphere, pricing, and facilities. They will be made to feel welcome and as part of the family.
Some major advantages A.B.C., Inc. will have over potential competition and conventional car washes are:
- Larger and newer facility
- Lower operating expenses than most
- Full service restaurant on site (new concept)
- Location, location, location
- We will offer carryout
- We will offer limited liquor (beer and wine)
MARKET ANALYSIS
MARKET OVERVIEW, SIZE, AND SEGMENTS
The market area we will concentrate on is central, northern, and western Madison. This area has been growing rapidly for the past several years and should continue for the foreseeable future. According to Inc. Magazine , Madison is ranked eleventh in the nation for start-up businesses. This means that the economic climate is extremely favorable for virtually any type of new business. In 1998, Madison recorded 5,414 start-up companies to its 400,000 population or 1.36 per 100 citizens. With Madison's exploding growth in population that has occurred during the last decade, local car wash sales should continue to be well in excess of national averages. Once the concept catches on locally, we feel the potential is unlimited. As we grow we will have the financial capacity to carry on an advertising campaign on a regional basis.
The economy is in the midst of a particularly strong growth period. Many new jobs are being added to the local community. Within a five-mile radius of A.B.C., Inc., 12,000 new homes are projected within the next few years. All of these factors are cause for a much greater need in car washes in the area. All of this activity can only help our attempts to begin this car wash.
Listed below are just some of the reasons that the Madison area is growing and why it is a good time to be running any kind of business that caters to this growth:
- The local economy is booming and virtually busting at the seams.
- More than 65 nationally based insurance companies are headquartered here. The largest is Allstate. It has over 1,200 employees) and an operating budget of over $85 million.
- Madison has a new airport that should grow and attract even more new businesses.
- The new Milwaukee Airport is open and provides an economic boost to the entire state, including Madison.
- Gambling in nearby Baraboo continues to draw many visitors and some new businesses.
- Every week, we see articles in the newspapers of Michigan residents and companies relocating here.
- The world-renowned Four Seasons Hotel has completed an extensive remodeling.
- MCI and Quantum Electronics are undergoing large increases in their operations here that should add many hundreds of employees.
- Milwaukee is only 50 minutes away and is another good market for businesses in the area.
- Many experts predict Madison to become the second fastest growing city in the state between now and the year 2007.
- Dane County is predicted to become the largest county in the state by the year 2003.
- The local economy is now more diversified than it was when troubles occurred in the local economy in the late 1980s and early 1990s.
The estimated population of Dane County in 1999 is 500,000 people. The number of households are approaching 200,000. Currently, this market is growing at an annual rate of 3-5%. Projections see this trend continuing for the balance of this decade.
From the above figures it can readily be seen that the potential market for our services is huge. We feel with our pricing and value we will become a price and industry leader within two years.
CUSTOMER PROFILE
Our surveys have shown the following potential mix of patrons for our facilities:
- We will cater to both blue collar and white collar people
- Income of typical customers is in the $20,000 and up range
- Large numbers of young professionals
- Wide range of age of clientele is 18-80
- Large numbers of electronics workers in the various plants within a five-minute drive
Beyond the local market we could eventually tap into a more regional market. The advantage of our service is that it could appeal to all segments of the community. By expanding the role of the restaurant, we can continue to become an even greater focal point for the local community.
Competition Analysis
| Competitor Name | Strengths | Weaknesses |
| Waterwashes | Good Location | Dated building |
| 123 South Lincoln | Fully Automated | Poor design |
| Not customer friendly | ||
| Car wash and detailing only | ||
| Badger Car Wash | Good Location | Poor at managing problems |
| 1115 N. Main | New Building | Was sold and reclaimed |
| Trying to rebuild reputation | ||
| Car wash and detailing only |
| Competitor Name | Strengths | Weaknesses |
| The Waves | Location | Small lot |
| 5500 Lapeer | Handwash | Not automated |
| Labor intensive | ||
| Not customer friendly | ||
| Poor design | ||
| Water Works | Newer design | Not customer friendly |
| 123 N. Washington | Fully automated | Car wash and detailing only |
| The Clean Place | Good Location | Converted building |
| 1108 N. Drummond | Nice building | Poor design |
| Small lot | ||
| Not customer friendly | ||
| Car wash and detail only |
The marketplace is currently shared by 3 major car washes. Most of the existing facilities have one or more significant waeknesses and are not really in the same market as us. They cannot be considered competitors, especially when you add our restaurant into the mix.
Risk Analysis
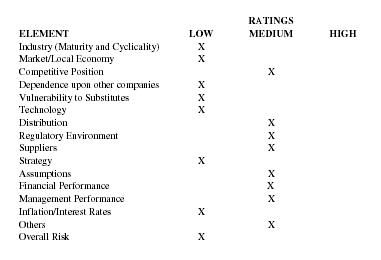
| RATINGS | |||
| ELEMENT | LOW | MEDIUM | HIGH |
| Industry (Maturity and Cyclicality) | X | ||
| Market/Local Economy | X | ||
| Competitive Position | X | ||
| Dependence upon other companies | X | ||
| Vulnerability to Substitutes | X | ||
| Technology | X | ||
| Distribution | X | ||
| Regulatory Environment | X | ||
| Suppliers | X | ||
| Strategy | X | ||
| Assumptions | X | ||
| Financial Performance | X | ||
| Management Performance | X | ||
| Inflation/Interest Rates | X | ||
| Others | X | ||
| Overall Risk | X | ||
Identification of Strengths & Weaknesses
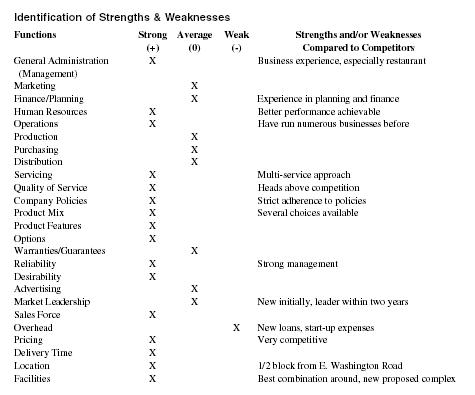
| Identification of Strengths & Weaknesses | ||||
| Functions |
Strong
(+) |
Average
(0) |
Weak
(-) |
Strengths and/or Weaknesses
Compared to Competitors |
| General Administration (Management) | X | Business experience, especially restaurant | ||
| Marketing | X | |||
| Finance/Planning | X | Experience in planning and finance | ||
| Human Resources | X | Better performance achievable | ||
| Operations | X | Have run numerous businesses before | ||
| Production | X | |||
| Purchasing | X | |||
| Distribution | X | |||
| Servicing | X | Multi-service approach | ||
| Quality of Service | X | Heads above competition | ||
| Company Policies | X | Strict adherence to policies | ||
| Product Mix | X | Several choices available | ||
| Product Features | X | |||
| Options | X | |||
| Warranties/Guarantees | X | |||
| Reliability | X | Strong management | ||
| Desirability | X | |||
| Advertising | X | |||
| Market Leadership | X | New initially, leader within two years | ||
| Sales Force | X | |||
| Overhead | X | New loans, start-up expenses | ||
| Pricing | X | Very competitive | ||
| Delivery Time | X | |||
| Location | X | 1/2 block from E. Washington Road | ||
| Facilities | X | Best combination around, new proposed complex | ||
We feel we will have strengths in product features, management, operations, quality of service, product mix, company policies, reliability, desirability, highly trained sales force, pricing, location, and facilities.
We will have low risk exposure in the areas of industry maturity, market, dependence upon other companies, vulnerability to substitutes, technology, inflation/interest rates, regulatory environment, management ability, location, facilities, and suppliers.
We perceive medium risk exposure in competitive position (we are new) suppliers, finance, and planning. We have retained the services of specialists to help in various areas such as marketing, accounting, legal, and general overall business operation advice.
We do not feel we have any high-risk exposure situations or major inherent weaknesses.
MARKETING STRATEGIES
PRICING AND VALUE
Our intention is to raise the public's awareness of our company. We plan to review our prices and those of our competitors every six months. We will review direct material costs, direct labor costs, and total overhead expenses. We will continually monitor the cost of providing our service to each customer. We will offer various free or reduced rate programs to get customers acquainted with us.
Numerous package deals may be offered to customers. Examples of various marketing strategies we may try include the following:
- Discounts for larger or repeat purchases
- Special party rates for the restaurant
- Ladies day (brings in women and reduces weekend congestion in the car wash—may give ladies a plant, hosiery, household item, etc.)
- Free car wash on your birthday
- Free car wash with a certain mileage on your auto as announced over the radio
- Free meal after so many car washes
- Free car wash after so many meals at the restaurant
- Fleet discounts to larger customers such as automobile dealers
- Special detailing and wash packages
SELLING TACTICS
Our company's marketing strategy will incorporate plans to promote our line of services through several different channels and on different levels of use. We will advertise heavily on the popular local radio stations and newspapers.
We will flood the market with advertising and try to go after our specific targets. We will try to capture their attention, pique their interest, and make them feel that they must have our services.
We will offer continuous promotional rates. The results sell themselves. We will offer discounts to frequent users. The more a customer uses our services the cheaper it will become for them.
We will also be a MasterCard and Visa charge card merchant which enables us to more readily service our customers.
In order to sell our facility we shall consider a variety of promotions including:
- Reserve certain hours or sections of the restaurant for unique groups such as children's birthday parties, senior citizens, service clubs, adults, etc.
- Conduct special theme nights, use ethnic holidays, family night, charity promotion night, classes, etc.
- Cultivate local churches and women's organizations for the restaurant.
- Promote private parties using entire facility, especially after normal closing hours.
- Early bird specials.
ADVERTISING, PROMOTION, AND DISTRIBUTION OF SERVICES
We recognize that the key to success at this time requires extensive promotion. Advertising goals include all of the following:
- Position the company as the premier car wash in Madison
- Increase public awareness of A.B.C. and its benefits
- Increase public awareness of our company and establish a professional image
- Maximize efficiency by continually monitoring media effectiveness
- Consider a possible credit coupon in some of the advertisements
- Develop a brochure or pamphlet to explain our service and company
- Continue use of a distinctive business card and company letterhead
- Use a mix of media to saturate the marketplace
PUBLIC RELATIONS
We will develop a public relations policy that will help increase awareness of our company and product. To achieve these goals we will consider some or all of the following:
- Develop a press release and a company backgrounder as a public relations tool.
- Develop a telephone script to handle customer and advertiser contact.
- We will attempt to never have a customer leave dissatisfied.
- Develop a survey to be completed by customers to help determine the following:
- How did they hear about us?
- What influenced them to use our service?
- How well did our service satisfy their needs?
- How efficient was our service?
- Did they have any problems getting through to us?
- Did they shop competitors before selecting us?
- How did they initially perceive our company and product?
- Where are most of our customers located?
- Do they have suggestions for improving our service or our approach to advertising?
- What additional services would they like us to offer?
- Would they recommend us to others?
We will join trade organizations and subscribe to trade journals to keep abreast of trends, management techniques etc. This organizations may include, National Restaurant Association, Auto Laundry News, and the International Car wash Association
FINANCIAL PLANS
Data Sheet #1
GENERAL:
Fiscal Year in which Projections/Calculations are to start ................................................................................... 2000
Number of Months in which Projections/Calculations are to start............................................................................. 5
The purpose for this Analysis is Business Start-Up, Expansion, or Review.............................................START-UP
Owner's contribution to business (include both cash and time in dollar equivalency) ............................ $295,000.00
Indicate below if the figures are actual, annualized, or projected for each year in the analysis:

| 2000 | Projected |
| 2001 | Projected |
| 2002 | Projected |
| 2003 | Projected |
| 2004 | Projected |
Indicate the type of business entity you have to the right: C
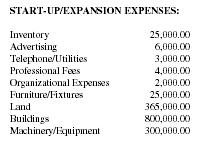
| START-UP/EXPANSION EXPENSES: | |
| Inventory | 25,000.00 |
| Advertising | 6,000.00 |
| Telephone/Utilities | 3,000.00 |
| Professional Fees | 4,000.00 |
| Organizational Expenses | 2,000.00 |
| Furniture/Fixtures | 25,000.00 |
| Land | 365,000.00 |
| Buildings | 800,000.00 |
| Machinery/Equipment | 300,000.00 |
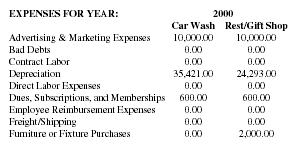
| EXPENSES FOR YEAR: | 2000 | |
| Car Wash | Rest/Gift Shop | |
| Advertising & Marketing Expenses | 10,000.00 | 10,000.00 |
| Bad Debts | 0.00 | 0.00 |
| Contract Labor | 0.00 | 0.00 |
| Depreciation | 35,421.00 | 24,293.00 |
| Direct Labor Expenses | 0.00 | 0.00 |
| Dues, Subscriptions, and Memberships | 600.00 | 600.00 |
| Employee Reimbursement Expenses | 0.00 | 0.00 |
| Freight/Shipping | 0.00 | 0.00 |
| Furniture or Fixture Purchases | 0.00 | 2,000.00 |
| START-UP/EXPANSION EXPENSES: | |
| Rent Deposits | 0.00 |
| Insurance | 4,000.00 |
| Leasehold Improvements | 0.00 |
| Licenses/Fees/Permits | 2,500.00 |
| Miscellaneous | 80,000.00 |
| Real Estate Taxes | 0.00 |
| Other #2 | 0.00 |
| Other #3 | 0.00 |
| Other #4 | 0.00 |
| Total | 1,616,500.00 |
| LOAN DATA: (If Needed) | |
| Amount of Loan 1 | 1,400,000 |
| Term of Loan 1 (Months) | 240 |
| Interest Rate for Loan 1 | 10.00% |
| First Year of Loan 1 | 1999 |
| First Payment Month | 8 |
| Amount of Loan 2 | $0.00 |
| Term of Loan 2 (Months) | 60 |
| Interest Rate for Loan 2 | 0.00% |
| First Year of Loan 2 | 1999 |
| First Payment Month | 1 |
| EXPENSES FOR YEAR: | 2000 | |
| Car Wash | Rest/Gift Shop | |
| Insurance | 5,000.00 | 2,000.00 |
| Lease Expenses | 0.00 | 0.00 |
| Leasehold Expenses | 0.00 | 0.00 |
| Machinery & Equipment Purchases | 3,000.00 | 500.00 |
| Office Supplies and Postage | 1,200.00 | 1,200.00 |
| Professional Fees | 8,000.00 | 2,000.00 |
| Permits/Licenses | 1,000.00 | 1,000.00 |
| Rent | 0.00 | 0.00 |
| Repair & Maintenance | 12,000.00 | 6,000.00 |
| Salaries-Officer's | 0.00 | 0.00 |
| Salaries-Administrative | 28,700.00 | 19,680.00 |
| Salaries and Wages-Other | 590,040.00 | 205,000.00 |
| Salaries-Manager | 41,000.00 | 41,000.00 |
| Telephone/Utilities | 57,000.00 | 12,000.00 |
| Real Estate Taxes | 15,000.00 | 5,000.00 |
| Other #2 | 0.00 | 0.00 |
| Other #3 | 0.00 | 0.00 |
| Other #4 | 0.00 | 0.00 |
| Miscellaneous/Contingency Expenses | 4,000.00 | 4,000.00 |
| Total First-Year Expenses Including Interest Paid and Cost of Goods Sold: | 811,961 | 336,273 |
| PERCENTAGE OF TOTAL PAYROLL ALLOTTED TO PAYROLL TAXES AND BENEFITS | 15.00% | |
| PERCENTAGE OF NET SALES—COST OF GOODS SOLD: | Car Wash | 3.44% |
| PERCENTAGE OF NET SALES—COST OF GOODS SOLD: | Restaurant | 30.00% |
| PERCENTAGE OF NET SALES—COST OF GOODS SOLD: | Gift Shop | 33.33% |
| PERCENTAGE OF NET SALES—COST OF GOODS SOLD: | Income Source #4 | 0.00% |
Data Sheet #2
|
SOURCES/AMOUNTS
OF INCOME FOR YEAR |
INCOME OPTION ONE
2000 |
| Car Wash | $1,162,000.00 |
| Restaurant | $708,830.00 |
| Gift Shop | $90,000.00 |
| Income Source #4 | $0.00 |
| Other Income/Exp (Net) | $0.00 |
| TOTAL INCOME | $1,960,830.00 |
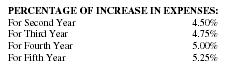
| PERCENTAGE OF INCREASE IN EXPENSES: | |
| For Second Year | 4.50% |
| For Third Year | 4.75% |
| For Fourth Year | 5.00% |
| For Fifth Year | 5.25% |
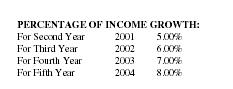
| PERCENTAGE OF INCOME GROWTH: | ||
| For Second Year | 2001 | 5.00% |
| For Third Year | 2002 | 6.00% |
| For Fourth Year | 2003 | 7.00% |
| For Fifth Year | 2004 | 8.00% |
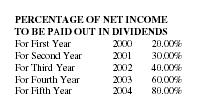
| PERCENTAGE OF NET INCOME TO BE PAID OUT IN DIVIDENDS | ||
| For First Year | 2000 | 20.00% |
| For Second Year | 2001 | 30.00% |
| For Third Year | 2002 | 40.00% |
| For Fourth Year | 2003 | 60.00% |
| For Fifth Year | 2004 | 80.00% |
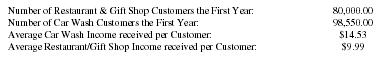
| Number of Restaurant & Gift Shop Customers the First Year: | 80,000.00 |
| Number of Car Wash Customers the First Year: | 98,550.00 |
| Average Car Wash Income received per Customer: | $14.53 |
| Average Restaurant/Gift Shop Income received per Customer: | $9.99 |
| Operating Data | 2000 | 2001 | 2002 | 2003 | 2004 |
| Days Sales in Accounts Receivable | 10.0 | 10.0 | 10.0 | 10.0 | 10.0 |
| Days Materials Cost in Inventory | 45.0 | 45.0 | 45.0 | 45.0 | 45.0 |
| Days Finished Goods in Inventory | 45.0 | 45.0 | 45.0 | 45.0 | 45.0 |
| Days Materials Cost in Payables | 25.0 | 25.0 | 25.0 | 25.0 | 25.0 |
| Days Payroll Expenses accrued | 25.0 | 25.0 | 25.0 | 25.0 | 25.0 |
| Days Operating Expenses accrued | 15.0 | 15.0 | 15.0 | 15.0 | 15.0 |
| MONTH | Percentage of Sales | Car Wash |
| JANUARY | 10.50% | |
| FEBRUARY | 10.50% | |
| MARCH | 11.00% | |
| APRIL | 11.50% | |
| MAY | 9.00% | |
| JUNE | 5.00% | |
| JULY | 5.00% | |
| AUGUST | 6.50% | |
| SEPTEMBER | 6.50% | |
| OCTOBER | 7.50% | |
| NOVEMBER | 8.00% | |
| DECEMBER | 9.00% |
| MONTH | Percentage of Sales | Restaurant & Gift Shop |
| JANUARY | 7.00% | |
| FEBRUARY | 7.00% | |
| MARCH | 7.00% | |
| APRIL | 7.00% | |
| MAY | 8.50% | |
| JUNE | 10.00% | |
| JULY | 11.00% | |
| AUGUST | 10.50% | |
| SEPTEMBER | 7.00% | |
| OCTOBER | 7.00% | |
| NOVEMBER | 9.00% | |
| DECEMBER | 9.00% |
| Start-up Expenses | |
| Category | Amount |
| Cash and Working Capital | $78,500 |
| Material-Supplies-Inventory | $25,000 |
| Advertising | $6,000 |
| Telephone and Utilities | $3,000 |
| Professional Fees | $4,000 |
| Organizational Expenses | $2,000 |
| Furniture and Fixtures | $25,000 |
| Land | $365,000 |
| Building | $800,000 |
| Machinery and Equipment | $300,000 |
| Insurance | $4,000 |
| Licenses, Fees, and Permits | $2,500 |
| Miscellaneous | $80,000 |
| TOTAL PROJECT COST | $1,695,000 |
New investments or loans totaling $1,400,000 must be obtained. This added to owner's investment of $295,000 will complete the project.
Owner's contribution breakdown is as follows:
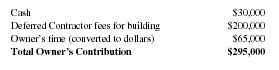
| Cash | $30,000 |
| Deferred Contractor fees for building | $200,000 |
| Owner's time (converted to dollars) | $65,000 |
| Total Owner's Contribution | $295,000 |
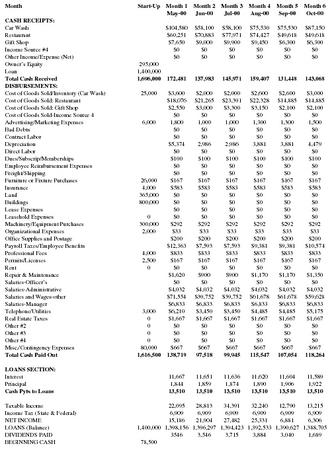
Cash Flow Projection - 2000
| Month | Start-Up |
Month 1
May-00 |
Month 2
Jun-00 |
Month 3
Jul-00 |
Month 4
Aug-00 |
Month 5
Sep-00 |
Month 6
Oct-00 |
| CASH RECEIPTS: | |||||||
| Car Wash | $104,580 | $58,100 | $58,100 | $75,530 | $75,530 | $87,150 | |
| Restaurant | $60,251 | $70,883 | $77,971 | $74,427 | $49,618 | $49,618 | |
| Gift Shop | $7,650 | $9,000 | $9,900 | $9,450 | $6,300 | $6,300 | |
| Income Source #4 | $0 | $0 | $0 | $0 | $0 | $0 | |
| Other Income/Expense (Net) | $0 | $0 | $0 | $0 | $0 | $0 | |
| Owner's Equity | 295,000 | ||||||
| Loan | 1,400,000 | ||||||
| Total Cash Received | 1,696,000 | 172,481 | 137,983 | 145,971 | 159,407 | 131,448 | 143,068 |
| DISBURSEMENTS: | |||||||
| Cost of Goods Sold/Inventory (Car Wash) | 25,000 | $3,600 | $2,000 | $2,000 | $2,600 | $2,600 | $3,000 |
| Cost of Goods Sold: Restaurant | $18,076 | $21,265 | $23,391 | $22,328 | $14,885 | $14,885 | |
| Cost of Goods Sold: Gift Shop | $2,550 | $3,000 | $3,300 | $3,150 | $2,100 | $2,100 | |
| Cost of Goods Sold-Income Source 4 | $0 | $0 | $0 | $0 | $0 | $0 | |
| Advertising/Marketing Expenses | 6,000 | 1,800 | 1,000 | 1,000 | 1,300 | 1,300 | 1,500 |
| Bad Debts | $0 | $0 | $0 | $0 | $0 | $0 | |
| Contract Labor | $0 | $0 | $0 | $0 | $0 | $0 | |
| Depreciation | $5,374 | 2,986 | 2,986 | 3,881 | 3,881 | 4,479 | |
| Direct Labor | $0 | $0 | $0 | $0 | $0 | $0 | |
| Dues/Subscrip/Memberships | $100 | $100 | $100 | $100 | $100 | $100 | |
| Employee Reimbursement Expenses | $0 | $0 | $0 | $0 | $0 | $0 | |
| Freight/Shipping | $0 | $0 | $0 | $0 | $0 | $0 | |
| Furniture or Fixture Purchases | 26,000 | $167 | $167 | $167 | $167 | $167 | $167 |
| Insurance | 4,000 | $583 | $583 | $583 | $583 | $583 | $583 |
| Land | 365,000 | $0 | $0 | $0 | $0 | $0 | $0 |
| Buildings | 800,000 | $0 | $0 | $0 | $0 | $0 | $0 |
| Lease Expenses | $0 | $0 | $0 | $0 | $0 | $0 | |
| Leasehold Expenses | 0 | $0 | $0 | $0 | $0 | $0 | $0 |
| Machinery/Equipment Purchases | 300,000 | $292 | $292 | $292 | $292 | $292 | $292 |
| Organizational Expenses | 2,000 | $33 | $33 | $33 | $33 | $33 | $33 |
| Office Supplies and Postage | $200 | $200 | $200 | $200 | $200 | $200 | |
| Payroll Taxes/Employee Benefits | $12,363 | $7,593 | $7,593 | $9,381 | $9,381 | $10,574 | |
| Professional Fees | 4,000 | $833 | $833 | $833 | $833 | $833 | $833 |
| Permits/Licenses | 2,500 | $167 | $167 | $167 | $167 | $167 | $167 |
| Rent | 0 | $0 | $0 | $0 | $0 | $0 | $0 |
| Repair & Maintenance | $1,620 | $900 | $900 | $1,170 | $1,170 | $1,350 | |
| Salaries-Officer's | $0 | $0 | $0 | $0 | $0 | $0 | |
| Salaries-Administrative | $4,032 | $4,032 | $4,032 | $4,032 | $4,032 | $4,032 | |
| Salaries and Wages-other | $71,554 | $39,752 | $39,752 | $61,678 | $61,678 | $59,628 | |
| Salaries-Manager | $6,833 | $6,833 | $6,833 | $6,833 | $6,833 | $6,833 | |
| Telephone/Utilities | 3,000 | $6,210 | $3,450 | $3,450 | $4,485 | $4,485 | $5,175 |
| Real Estate Taxes | 0 | $1,667 | $1,667 | $1,667 | $1,667 | $1,667 | $1,667 |
| Other #2 | 0 | $0 | $0 | $0 | $0 | $0 | $0 |
| Other #3 | 0 | $0 | $0 | $0 | $0 | $0 | $0 |
| Other #4 | 0 | $0 | $0 | $0 | $0 | $0 | $0 |
| Misc./Contingency Expenses | 80,000 | $667 | $667 | $667 | $667 | $667 | $667 |
| Total Cash Paid Out | 1,616,500 | 138,719 | 97,518 | 99,945 | 115,547 | 107,054 | 118,264 |
| LOANS SECTION: | |||||||
| Interest | 11,667 | 11,651 | 11,636 | 11,620 | 11,604 | 11,589 | |
| Principal | 1,844 | 1,859 | 1,874 | 1,890 | 1,906 | 1,922 | |
| Cash Pyts to Loans | 13,510 | 13,510 | 13,510 | 13,510 | 13,510 | 13,510 | |
| Taxable Income | 22,095 | 28,813 | 34,391 | 32,240 | 12,790 | 13,215 | |
| Income Tax (State & Federal) | 6,909 | 6,909 | 6,909 | 6,909 | 6,909 | 6,909 | |
| NET INCOME | 15,186 | 21,904 | 27,482 | 25,331 | 6,881 | 6,306 | |
| LOANS (Balance) | 1,400,000 | 1,398,156 | 1,396,297 | 1,394,423 | 1,392,533 | 1,390,627 | 1,388,705 |
| DIVIDENDS PAID | 3546 | 3,546 | 3,715 | 3,884 | 3,040 | 1,689 | |
| BEGINNING CASH | 78,500 |
|
Month 7
Nov-00 |
Month 8
Dec-00 |
Month 9
Jan-01 |
Month 10
Feb-01 |
Month 11
Mar-01 |
Month 12
Apr-01 |
Totals |
| $92,960 | $10,580 | $122,010 | $122,010 | $127,820 | $133,630 | $1,162,000 |
| $63,795 | $63,795 | $63,795 | $49,618 | $49,618 | $49,618 | $708,830 |
| $8,100 | $8,100 | $6,300 | $5,300 | $6,300 | $6,300 | $90,000 |
| $0 | $0 | $0 | $0 | $0 | $0 | $0 |
| $0 | $0 | $0 | $0 | $0 | $0 | $0 |
| 164,855 | 176,475 | 177,928 | 177,928 | 183,738 | 189,548 | $1,960,830 |
| $3,200 | $3,600 | $4,200 | $4,200 | $4,400 | $4,600 | $40,000 |
| $19,138 | $19,138 | $19,138 | $14,886 | $14,885 | $14,885 | $212,649 |
| $2,700 | $2,700 | $2,100 | $2,100 | $2,100 | $2,100 | $30,000 |
| $0 | $0 | $0 | $0 | $0 | $0 | $0 |
| 1,60 | 1,800 | 2,100 | 2,100 | 2,200 | 2,300 | $20,000 |
| $0 | $0 | $0 | $0 | $0 | $0 | $0 |
| $0 | $0 | $0 | $0 | $0 | $0 | $0 |
| 4,777 | 5,374 | 6,270 | 6,270 | 6,569 | 6,867 | $59,714 |
| $0 | $0 | $0 | $0 | $0 | $0 | $0 |
| $100 | $100 | $100 | $100 | $100 | $100 | $1,200 |
| $0 | $0 | $0 | $0 | $0 | $0 | $0 |
| $0 | $0 | $0 | $0 | $0 | $0 | $0 |
| $167 | $167 | $167 | $167 | $167 | $167 | $2,000 |
| $583 | $583 | $583 | $583 | $583 | $583 | $7,000 |
| $0 | $0 | $0 | $0 | $0 | $0 | $0 |
| $0 | $0 | $0 | $0 | $0 | $0 | $0 |
| $0 | $0 | $0 | $0 | $0 | $0 | $0 |
| $0 | $0 | $0 | $0 | $0 | $0 | $0 |
| $292 | $292 | $292 | $292 | $292 | $292 | $3,500 |
| $33 | $33 | $33 | $33 | $33 | $33 | $400 |
| $200 | $200 | $200 | $200 | $200 | $200 | $2,400 |
| $11,170 | $12,363 | $14,152 | $14,152 | $14,748 | $15,344 | $138,813 |
| $833 | $833 | $833 | $833 | $833 | $833 | $10,000 |
| $167 | $167 | $167 | $167 | $167 | $167 | $2,000 |
| $0 | $0 | $0 | $0 | $0 | $0 | $0 |
| $1,440 | $1,620 | $1,890 | $1,890 | $1,980 | $2,070 | $18,000 |
| $0 | $0 | $0 | $0 | $0 | $0 | $0 |
| $4,032 | $4,032 | $4,032 | $4,032 | $4,032 | $4,032 | $48,380 |
| $63,603 | $71,654 | $83,479 | $83,479 | $87,464 | $91,430 | $795,040 |
| $6,833 | $6,833 | $6,833 | $6,833 | $6,833 | $6,833 | $82,000 |
| $5,520 | $6,210 | $7,245 | $7,245 | $7,590 | $7,935 | $69,000 |
| $1,667 | $1,667 | $1,667 | $1,667 | $1,667 | $1,667 | $20,000 |
| $0 | $0 | $0 | $0 | $0 | $0 | $0 |
| $0 | $0 | $0 | $0 | $0 | $0 | $0 |
| $0 | $0 | $0 | $0 | $0 | $0 | $0 |
| $667 | $667 | $667 | $667 | $667 | $667 | $8,000 |
| 128,722 | 139,932 | 151,995 | 151,895 | 157,500 | 163,105 | $1,570,096 |
| 11,573 | 11,556 | 11,640 | 11,524 | 11,507 | 11,490 | $138,957 |
| 1,938 | 1,954 | 1,970 | 1,987 | 2,003 | 2,020 | $23,166 |
| 13,510 | 13,510 | 13,510 | 13,510 | 13,510 | 13,510 | $162,124 |
| 24,560 | 24,986 | 14,493 | 14,510 | 14,731 | 14,953 | $251,777 |
| 6,909 | 6,909 | 6,909 | 6,909 | 6,909 | 6,909 | $82,907 |
| 17,651 | 18,077 | 7,686 | 7,601 | 7,822 | 8,044 | $168,870 |
| 1,386,767 | 1,384,813 | 1,382,843 | 1,380,857 | 1,378,854 | 1,376,834 | |
| 1,689 | 2,195 | 2,195 | 2,533 | 2,702 | 3,040 | 33,774 |
Cash Flow Projection - 2001
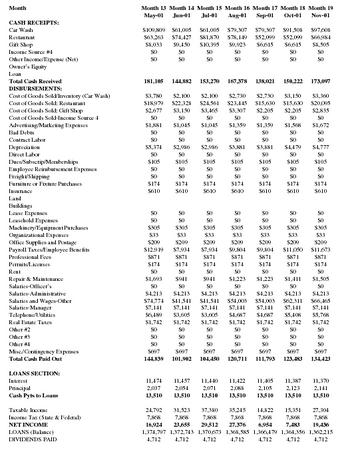
| Month |
Month 13
May-01 |
Month 14
Jun-01 |
Month 15
Jul-01 |
Month 16
Aug-01 |
Month 17
Sep-01 |
Month 18
Oct-01 |
Month 19
Nov-01 |
| CASH RECEIPTS: | |||||||
| Car Wash | $109,809 | $61,005 | $61,005 | $79,307 | $79,307 | $91,508 | $97,608 |
| Restaurant | $63,263 | $74,427 | $81,870 | $78,149 | $52,099 | $52,099 | $66,984 |
| Gift Shop | $8,033 | $9,450 | $10,395 | $9,923 | $6,615 | $6,615 | $8,505 |
| Income Source #4 | $0 | $0 | $0 | $0 | $0 | $0 | $0 |
| Other Income/Expense (Net) | $0 | $0 | $0 | $0 | $0 | $0 | $0 |
| Owner's Equity | |||||||
| Loan | |||||||
| Total Cash Received | 181,105 | 144,882 | 153,270 | 167,378 | 138,021 | 150,222 | 173,097 |
| DISBURSEMENTS: | |||||||
| Cost of Goods Sold/Inventory (Car Wash) | $3,780 | $2,100 | $2,100 | $2,730 | $2,730 | $3,150 | $3,360 |
| Cost of Goods Sold: Restaurant | $18,979 | $22,328 | $24,561 | $23,445 | $15,630 | $15,630 | $20,095 |
| Cost of Goods Sold: Gift Shop | $2,677 | $3,150 | $3,465 | $3,307 | $2,205 | $2,205 | $2,835 |
| Cost of Goods Sold-Income Source 4 | $0 | $0 | $0 | $0 | $0 | $0 | $0 |
| Advertising/Marketing Expenses | $1,881 | $1,045 | $1,045 | $1,359 | $1,359 | $1,568 | $1,672 |
| Bad Debts | $0 | $0 | $0 | $0 | $0 | $0 | $0 |
| Contract Labor | $0 | $0 | $0 | $0 | $0 | $0 | $0 |
| Depreciation | $5,374 | $2,986 | $2,986 | $3,881 | $3,881 | $4,479 | $4,777 |
| Direct Labor | $0 | $0 | $0 | $0 | $0 | $0 | $0 |
| Dues/Subscrip/Memberships | $105 | $105 | $105 | $105 | $105 | $105 | $105 |
| Employee Reimbursement Expenses | $0 | $0 | $0 | $0 | $0 | $0 | $0 |
| Freight/Shipping | $0 | $0 | $0 | $0 | $0 | $0 | $0 |
| Furniture or Fixture Purchases | $174 | $174 | $174 | $174 | $174 | $174 | $174 |
| Insurance | $610 | $610 | $610 | $610 | $610 | $610 | $610 |
| Land | |||||||
| Buildings | |||||||
| Lease Expenses | $0 | $0 | $0 | $0 | $0 | $0 | $0 |
| Leasehold Expenses | $0 | $0 | $0 | $0 | $0 | $0 | $0 |
| Machinery/Equipment Purchases | $305 | $305 | $305 | $305 | $305 | $305 | $305 |
| Organizational Expenses | $33 | $33 | $33 | $33 | $33 | $33 | $33 |
| Office Supplies and Postage | $209 | $209 | $209 | $209 | $209 | $209 | $209 |
| Payroll Taxes/Employee Benefits | $12,919 | $7,934 | $7,934 | $9,804 | $9,804 | $11,050 | $11,673 |
| Professional Fees | $871 | $871 | $871 | $871 | $871 | $871 | $871 |
| Permits/Licenses | $174 | $174 | $174 | $174 | $174 | $174 | $174 |
| Rent | $0 | $0 | $0 | $0 | $0 | $0 | $0 |
| Repair & Maintenance | $1,693 | $941 | $941 | $1,223 | $1,223 | $1,411 | $1,505 |
| Salaries-Officer's | $0 | $0 | $0 | $0 | $0 | $0 | $0 |
| Salaries-Administrative | $4,213 | $4,213 | $4,213 | $4,213 | $4,213 | $4,213 | $4,213 |
| Salaries and Wages-Other | $74,774 | $41,541 | $41,541 | $54,003 | $54,003 | $62,311 | $66,465 |
| Salaries-Manager | $7,141 | $7,141 | $7,141 | $7,141 | $7,141 | $7,141 | $7,141 |
| Telephone/Utilities | $6,489 | $3,605 | $3,605 | $4,687 | $4,687 | $5,408 | $5,768 |
| Real Estate Taxes | $1,742 | $1,742 | $1,742 | $1,742 | $1,742 | $1,742 | $1,742 |
| Other #2 | $0 | $0 | $0 | $0 | $0 | $0 | $0 |
| Other #3 | $0 | $0 | $0 | $0 | $0 | $0 | $0 |
| Other #4 | $0 | $0 | $0 | $0 | $0 | $0 | $0 |
| Misc./Contingency Expenses | $697 | $697 | $697 | $697 | $697 | $697 | $697 |
| Total Cash Paid Out | 144,839 | 101,902 | 104,450 | 120,711 | 111,793 | 123,483 | 134,423 |
| LOANS SECTION: | |||||||
| Interest | 11,474 | 11,457 | 11,440 | 11,422 | 11,405 | 11,387 | 11,370 |
| Principal | 2,037 | 2,054 | 2,071 | 2,088 | 2,105 | 2,123 | 2,141 |
| Cash Pyts to Loans | 13,510 | 13,510 | 13,510 | 13,510 | 13,510 | 13,510 | 13,510 |
| Taxable Income | 24,792 | 31,523 | 37,380 | 35,245 | 14,822 | 15,351 | 27,304 |
| Income Tax (State & Federal) | 7,868 | 7,868 | 7,868 | 7,868 | 7,868 | 7,868 | 7,868 |
| NET INCOME | 16,924 | 23,655 | 29,512 | 27,376 | 6,954 | 7,483 | 19,436 |
| LOANS (Balance) | 1,374,797 | 1,372,743 | 1,370,673 | 1,368,585 | 1,366,479 | 1,364,356 | 1,362,215 |
| DIVIDENDS PAID | 4,712 | 4,712 | 4,712 | 4,712 | 4,712 | 4,712 | 4,712 |
|
Month 20
Dec-01 |
Month 21
Jan-02 |
Month 22
Feb-02 |
Month 23
Mar-02 |
Month 24
Apr-02 |
Totals |
| $109,809 | $128,111 | $128,111 | $134,211 | $140,312 | $1,220,100 |
| $66,984 | $52,099 | $52,099 | $52,099 | $52,099 | $744,272 |
| $8,505 | $6,615 | $6,615 | $6,615 | $6,615 | $94,500 |
| $0 | $0 | $0 | $0 | $0 | $0 |
| $0 | $0 | $0 | $0 | $0 | $0 |
| 185,298 | 186,825 | 186,825 | 192,925 | 199,026 | $2,058,872 |
| $3,780 | $4,410 | $4,410 | $4,620 | $4,830 | $42,000 |
| $20,095 | $15,630 | $15,630 | $15,630 | $15,630 | $223,281 |
| $2,835 | $2,205 | $2,205 | $2,205 | $2,205 | $31,500 |
| $0 | $0 | $0 | $0 | $0 | $0 |
| $1,881 | $2,195 | $2,195 | $2,299 | $2,404 | $20,900 |
| $0 | $0 | $0 | $0 | $0 | $0 |
| $0 | $0 | $0 | $0 | $0 | $0 |
| $5,374 | $6,270 | $6,270 | $6,569 | $6,867 | $59,714 |
| $0 | $0 | $0 | $0 | $0 | $0 |
| $105 | $105 | $105 | $105 | $105 | $1,254 |
| $0 | $0 | $0 | $0 | $0 | $0 |
| $0 | $0 | $0 | $0 | $0 | $0 |
| $174 | $174 | $174 | $174 | $174 | $2,090 |
| $610 | $610 | $610 | $610 | $610 | $7,315 |
| $0 | |||||
| $0 | |||||
| $0 | $0 | $0 | $0 | $0 | $0 |
| $0 | $0 | $0 | $0 | $0 | $0 |
| $305 | $305 | $305 | $305 | $305 | $3,658 |
| $33 | $33 | $33 | $33 | $33 | $400 |
| $209 | $209 | $209 | $209 | $209 | $2,508 |
| $12,919 | $14,788 | $14,788 | $15,412 | $16,035 | $145,060 |
| $871 | $871 | $871 | $871 | $871 | $10,450 |
| $174 | $174 | $174 | $174 | $174 | $2,090 |
| $0 | $0 | $0 | $0 | $0 | $0 |
| $1,693 | $1,975 | $1,975 | $2,069 | $2,163 | $18,810 |
| $0 | $0 | $0 | $0 | $0 | $0 |
| $4,213 | $4,213 | $4,213 | $4,213 | $4,213 | $50,557 |
| $74,774 | $87,236 | $87,236 | $91,390 | $95,544 | $830,817 |
| $7,141 | $7,141 | $7,141 | $7,141 | $7,141 | $85,690 |
| $6,489 | $7,571 | $7,571 | $7,932 | $8,292 | $72,105 |
| $1,742 | $1,742 | $1,742 | $1,742 | $1,742 | $20,900 |
| $0 | $0 | $0 | $0 | $0 | $0 |
| $0 | $0 | $0 | $0 | $0 | $0 |
| $0 | $0 | $0 | $0 | $0 | $0 |
| $697 | $697 | $697 | $697 | $697 | $8,360 |
| 146,113 | 158,552 | 158,552 | 164,397 | 170,242 | $1,639,458 |
| 11,352 | 11,334 | 11,316 | 11,297 | 11,279 | $136,531 |
| 2,159 | 2,176 | 2,195 | 2,213 | 2,231 | $25,592 |
| 13,510 | 13,510 | 13,510 | 13,510 | 13,510 | $162,124 |
| 27,833 | 16,939 | 16,957 | 17,231 | 17,505 | $282,883 |
| 7,868 | 7,868 | 7,868 | 7,868 | 7,868 | $94,417 |
| 19,965 | 9,071 | 9,089 | 9,363 | 9,637 | $188,466 |
| 1,360,057 | 1,357,880 | 1,355,686 | 1,353,473 | 1,351,242 | |
| 4,712 | 4,712 | 4,712 | 4,712 | 4,712 | 56,540 |
Cash Flow Projection - 2002
| Month |
Month 25
May-02 |
Month 26
Jun-02 |
Month 27
Jul-02 |
Month 28
Aug-02 |
Month 29
Sep-02 |
Month 30
Oct-02 |
Month 31
Nov-02 |
| CASH RECEIPTS: | |||||||
| Car Wash | $116,398 | $64,665 | $64,665 | $84,065 | $84,065 | $96,998 | $103,464 |
| Restaurant | $67,059 | $78,893 | $86,782 | $82,837 | $55,225 | $55,225 | $71,004 |
| Gift Shop | $8,514 | $10,017 | $11,019 | $10,518 | $7,012 | $7,012 | $9,015 |
| Income Source #4 | $0 | $0 | $0 | $0 | $0 | $0 | $0 |
| Other Income/Expense (Net) | $0 | $0 | $0 | $0 | $0 | $0 | $0 |
| Owner's Equity | |||||||
| Loan | |||||||
| Total Cash Received | 191,971 | 153,575 | 162,466 | 177,420 | 146,302 | 159,235 | 183,483 |
| DISBURSEMENTS: | |||||||
| Cost of Goods Sold/Inventory (Car Wash) | $4,007 | $2,226 | $2,226 | $2,894 | $2,894 | $3,339 | $3,562 |
| Cost of Goods Sold: Restaurant | $20,118 | $23,668 | $26,035 | $24,851 | $16,567 | $16,567 | $21,301 |
| Cost of Goods Sold: Gift Shop | $2,838 | $3,339 | $3,673 | $3,506 | $2,337 | $2,337 | $3,005 |
| Cost of Goods Sold-Income Source 4 | $0 | $0 | $0 | $0 | $0 | $0 | $0 |
| Advertising/Marketing Expenses | $1,970 | $1,095 | $1,095 | $1,423 | $1,423 | $1,642 | $1,751 |
| Bad Debts | $0 | $0 | $0 | $0 | $0 | $0 | $0 |
| Contract Labor | $0 | $0 | $0 | $0 | $0 | $0 | $0 |
| Depreciation | $5,374 | $2,986 | $2,986 | $3,881 | $3,881 | $4,479 | $4,777 |
| Direct Labor | $0 | $0 | $0 | $0 | $0 | $0 | $0 |
| Dues/Subscrip/Memberships | $109 | $109 | $109 | $109 | $109 | $109 | $109 |
| Employee Reimbursement Expenses | $0 | $0 | $0 | $0 | $0 | $0 | $0 |
| Freight/Shipping | $0 | $0 | $0 | $0 | $0 | $0 | $0 |
| Furniture or Fixture Purchases | $182 | $182 | $182 | $182 | $182 | $182 | $182 |
| Insurance | $639 | $639 | $639 | $639 | $639 | $639 | $639 |
| Land | |||||||
| Buildings | |||||||
| Lease Expenses | $0 | $0 | $0 | $0 | $0 | $0 | $0 |
| Leasehold Expenses | $0 | $0 | $0 | $0 | $0 | $0 | $0 |
| Machinery/Equipment Purchases | $319 | $319 | $319 | $319 | $319 | $319 | $319 |
| Organizational Expenses | $33 | $33 | $33 | $33 | $33 | $33 | $33 |
| Office Supplies and Postage | $219 | $219 | $219 | $219 | $219 | $219 | $219 |
| Payroll Taxes/Employee Benefits | $13,533 | $8,311 | $8,311 | $10,269 | $10,269 | $11,575 | $12,227 |
| Professional Fees | $912 | $912 | $912 | $912 | $912 | $912 | $912 |
| Permits/Licenses | $182 | $182 | $182 | $182 | $182 | $182 | $182 |
| Rent | $0 | $0 | $0 | $0 | $0 | $0 | $0 |
| Repair & Maintenance | $1,773 | $985 | $985 | $1,281 | $1,281 | $1,478 | $1,576 |
| Salaries-Officer's | $0 | $0 | $0 | $0 | $0 | $0 | $0 |
| Salaries-Administrative | $4,413 | $4,413 | $4,413 | $4,413 | $4,413 | $4,413 | $4,413 |
| Salaries and Wages-Other | $78,325 | $43,514 | $43,514 | $56,568 | $56,568 | $65,271 | $69,622 |
| Salaries-Manager | $7,480 | $7,480 | $7,480 | $7,480 | $7,480 | $7,480 | $7,480 |
| Telephone/Utilities | $6,798 | $3,776 | $3,776 | $4,909 | $4,909 | $5,665 | $6,042 |
| Real Estate Taxes | $1,824 | $1,824 | $1,824 | $1,824 | $1,824 | $1,824 | $1,824 |
| Other #2 | $0 | $0 | $0 | $0 | $0 | $0 | $0 |
| Other #3 | $0 | $0 | $0 | $0 | $0 | $0 | $0 |
| Other#4 | $0 | $0 | $0 | $0 | $0 | $0 | $0 |
| Misc./Contingency Expenses | $730 | $730 | $730 | $730 | $730 | $730 | $730 |
| Total Cash Paid Out | 151,780 | 106,944 | 109,645 | 126,627 | 117,175 | 129,396 | 140,909 |
| LOANS SECTION: | |||||||
| Interest | 11,260 | 11,242 | 11,223 | 11,204 | 11,184 | 11,165 | 11,145 |
| Principal | 2,250 | 2,269 | 2,288 | 2,307 | 2,326 | 2,345 | 2,365 |
| Cash Pyts to Loans | 13,510 | 13,510 | 13,510 | 13,510 | 13,510 | 13,510 | 13,510 |
| Taxable Income | 28,931 | 35,390 | 41,599 | 39,590 | 17,943 | 18,673 | 31,429 |
| Income Tax (State & Federal) | 9,332 | 9,332 | 9,332 | 9,332 | 9,332 | 9,332 | 9,332 |
| NET INCOME | 19,599 | 26,057 | 32,267 | 30,257 | 8,611 | 9,341 | 22,097 |
| LOANS (Balance) | 1,348,992 | 1,346,723 | 1,344,435 | 1,342,129 | 1,339,803 | 1,337,457 | 1,335,093 |
| DIVIDENDS PAID | 7,279 | 7,279 | 7,279 | 7,279 | 7,279 | 7,279 | 7,279 |
|
Month 32
Dec-02 |
Month 33
Jan-03 |
Month 34
Feb-03 |
Month 35
Mar-03 |
Month 36
Apr-03 |
Totals |
| $116,398 | $135,797 | $135,797 | $142,264 | $148,730 | $1,293,306 |
| $71,004 | $55,225 | $55,225 | $55,225 | $55,225 | $788,928 |
| $9,015 | $7,012 | $7,012 | $7,012 | $7,012 | $100,170 |
| $0 | $0 | $0 | $0 | $0 | $0 |
| $0 | $0 | $0 | $0 | $0 | $0 |
| 196,416 | 198,034 | 198,034 | 204,501 | 210,967 | $2,182,404 |
| $4,007 | $4,675 | $4,675 | $4,897 | $5,120 | $44,520 |
| $21,301 | $16,567 | $16,567 | $16,567 | $16,567 | $236,678 |
| $3,005 | $2,337 | $2,337 | $2,337 | $2,337 | $33,390 |
| $0 | $0 | $0 | $0 | $0 | $0 |
| $1,970 | $2,299 | $2,299 | $2,408 | $2,518 | $21,893 |
| $0 | $0 | $0 | $0 | $0 | $0 |
| $0 | $0 | $0 | $0 | $0 | $0 |
| $5,374 | $6,270 | $6,270 | $6,569 | $6,867 | $59,714 |
| $0 | $0 | $0 | $0 | $0 | $0 |
| $109 | $109 | $109 | $109 | $109 | $1,314 |
| $0 | $0 | $0 | $0 | $0 | $0 |
| $0 | $0 | $0 | $0 | $0 | $0 |
| $182 | $182 | $182 | $182 | $182 | $2,189 |
| $639 | $639 | $639 | $639 | $639 | $7,662 |
| $0 | |||||
| $0 | |||||
| $0 | $0 | $0 | $0 | $0 | $0 |
| $0 | $0 | $0 | $0 | $0 | $0 |
| $319 | $319 | $319 | $319 | $319 | $3,831 |
| $33 | $33 | $33 | $33 | $33 | $400 |
| $219 | $219 | $219 | $219 | $219 | $2,627 |
| $13,533 | $15,491 | $15,491 | $16,144 | $16,796 | $151,950 |
| $912 | $912 | $912 | $912 | $912 | $10,946 |
| $182 | $182 | $182 | $182 | $182 | $2,189 |
| $0 | $0 | $0 | $0 | $0 | $0 |
| $1,773 | $2,069 | $2,069 | $2,167 | $2,266 | $19,703 |
| $0 | $0 | $0 | $0 | $0 | $0 |
| $4,413 | $4,413 | $4,413 | $4,413 | $4,413 | $52,959 |
| $78,325 | $91,379 | $91,379 | $95,731 | $100,082 | $870,281 |
| $7,480 | $7,480 | $7,480 | $7,480 | $7,480 | $89,760 |
| $6,798 | $7,931 | $7,931 | $8,308 | $8,686 | $75,530 |
| $1,824 | $1,824 | $1,824 | $1,824 | $1,824 | $21,893 |
| $0 | $0 | $0 | $0 | $0 | $0 |
| $0 | $0 | $0 | $0 | $0 | $0 |
| $0 | $0 | $0 | $0 | $0 | $0 |
| $730 | $730 | $730 | $730 | $730 | $8,757 |
| 153,131 | 166,062 | 166,062 | 172,173 | 178,824 | $1,718,187 |
| 11,126 | 11,106 | 11,086 | 11,066 | 11,045 | $133,851 |
| 2,385 | 2,404 | 2,424 | 2,445 | 2,465 | $28,272 |
| 13,510 | 13,510 | 13,510 | 13,510 | 13,510 | $162,124 |
| 32,160 | 20,866 | 20,886 | 21,262 | 21,638 | $330,366 |
| 9,332 | 9,332 | 9,332 | 9,332 | 9,332 | $111,985 |
| 22,828 | 11,534 | 11,554 | 11,930 | 12,306 | $218,381 |
| 1,332,708 | 1,330,304 | 1,327,879 | 1,325,435 | 1,322,970 | |
| 7,279 | 7,279 | 7,279 | 7,279 | 7,279 | 87,352 |
Five-Year Income Statement (Restaurant & Gift Shop)
| FIVE-YEAR ANALYSIS | |||||
|
Projected
2000 |
Projected
2001 |
Projected
2002 |
Projected
2003 |
Projected
2004 |
|
| Sales: | |||||
| Sales | $798,830 | $838,772 | $889,098 | $951,335 | $1,027,441 |
| Cost of Sales | $242,649 | $254,781 | $270,068 | $288,973 | $312,091 |
| Gross Profit | $556,181 | $583,991 | $619,030 | $662,362 | $715,350 |
| Expenses: | |||||
| Operating expenses | $373,271 | $390,068 | $408,596 | $429,026 | $451,550 |
| Interest | $56,555 | $55,568 | $54,477 | $53,273 | $51,942 |
| Depreciation | $24,304 | $24,304 | $24,304 | $24,304 | $24,304 |
| Amortization | $163 | $163 | $163 | $163 | $163 |
| Total expenses | $454,293 | $470,103 | $487,541 | $506,766 | $527,959 |
| Operating income | $101,888 | $113,888 | $131,489 | $155,596 | $187,391 |
| Other income and expenses: | |||||
| Gain (loss) on sale of assets | $0 | $0 | $0 | $0 | $0 |
| Other (net) | $0 | $0 | $0 | $0 | $0 |
| Subtotal | $0 | $0 | $0 | $0 | $0 |
| Income before tax | $101,888 | $113,888 | $131,489 | $155,596 | $187,391 |
| Taxes (Federal & State) | $33,743 | $38,428 | $45,578 | $55,597 | $69,014 |
| Rate | 32.93% | 33.38% | 33.90% | 34.42% | 34.89% |
| Net Income | $68,145 | $75,460 | $85,911 | $99,999 | $118,377 |
| Retained earnings-beginning | $0 | $54,399 | $106,847 | $157,206 | $193,641 |
| Dividends paid | $13,746 | $23,012 | $35,552 | $63,564 | $103,029 |
| Retained earnings-ending | $54,399 | $106,847 | $157,206 | $193,641 | $208,989 |
| Detailed Supporting Information: | |||||
| Cost of Sales | |||||
| Direct labor | $0 | $0 | $0 | $0 | $0 |
| Materials | $242,649 | $254,781 | $270,068 | $288,973 | $312,091 |
| Other costs | |||||
Five-Year Income Statement (Car Wash)
| FIVE-YEAR ANALYSIS | |||||
|
Projected
2000 |
Projected
2001 |
Projected
2002 |
Projected
2003 |
Projected
2004 |
|
| Sales: | |||||
| Sales | $1,960,830 | $2,058,872 | $2,182,404 | $2,335,172 | $2,521,986 |
| Cost of Sales | $282,649 | $296,781 | $314,588 | $336,609 | $363,538 |
| Gross Profit | $1,678,181 | $1,762,091 | $1,867,816 | $1,998,563 | $2,158,448 |
| Expenses: | |||||
| Operating expenses | $1,227,333 | $1,282,563 | $1,343,485 | $1,410,659 | $1,484,719 |
| Interest | $138,957 | $136,531 | $133,851 | $130,891 | $127,621 |
| Depreciation | $59,714 | $59,714 | $59,714 | $59,714 | $59,714 |
| Amortization | $400 | $400 | $400 | $400 | $400 |
| Total expenses | $1,426,404 | $1,479,208 | $1,537,450 | $1,601,664 | $1,672,454 |
| Operating income | $251,777 | $282,883 | $330,366 | $396,899 | $485,994 |
| Other income and expenses: | |||||
| Gain (loss) on sale of assets | $0 | $0 | $0 | $0 | $0 |
| Other (net) | $0 | $0 | $0 | $0 | $0 |
| Subtotal | $0 | $0 | $0 | $0 | $0 |
| Income before tax | $251,777 | $282,883 | $330,366 | $396,899 | $485,994 |
| Taxes (Federal & State) | $82,907 | $94,417 | $111,985 | $136,603 | $169,568 |
| Rate | 32.93% | 33.38% | 33.90% | 34.42% | 34.89% |
| Net Income | $168,870 | $18,866 | $218,381 | $260,296 | $316,426 |
| Retained earnings-beginning | $0 | $15,096 | $267,022 | $398,051 | $502,169 |
| Dividends paid | $33,774 | $56,540 | $87,352 | $156,178 | $253,142 |
| Retained earnings-ending | $135,096 | $267,022 | $398,051 | $502,169 | $565,453 |
| Detailed Supporting Information: | |||||
| Cost of Sales | |||||
| Direct labor | $0 | $0 | $0 | $0 | $0 |
| Materials | $282,649 | $296,781 | $314,588 | $336,609 | $363,538 |
| Other costs | |||||
Five-Year Balance Sheet
| FIVE-YEAR ANALYSIS | ||||||
| START-UP |
Projected
2000 |
Projected
2001 |
Projected
2002 |
Projected
2003 |
Projected
2004 |
|
| ASSETS: | ||||||
| Cash and cash equivalents | $78,500 | $274,812 | $425,430 | $571,374 | $681,176 | $750,371 |
| Accounts receivable | $0 | $83,721 | $56,407 | $59,792 | $63,977 | $69,096 |
| Inventory | $25,000 | $69,694 | $73,179 | $77,570 | $82,999 | $89,640 |
| Other current assets | $13,000 | $20,000 | $25,000 | $30,000 | $40,000 | $45,000 |
| Total Current Assets | $116,500 | $418,227 | $580,016 | $738,736 | $868,152 | $954,107 |
| FIXED ASSETS: | ||||||
| Land | $365,000 | $365,000 | $365,000 | $365,000 | $365,000 | $365,000 |
| Buildings | $800,000 | $800,000 | $800,000 | $800,000 | $800,000 | $800,000 |
| Machinery & Equipment | $300,000 | $300,000 | $303,658 | $307,489 | $311,512 | $315,746 |
| Furniture/Fixtures | $25,000 | $25,000 | $27,090 | $29,279 | $31,578 | $33,997 |
| Subtotal | $1,490,000 | $1,490,000 | $1,495,748 | $1,501,768 | $1,508,090 | $1,514,743 |
| Less-accumulated depreciation | $0 | $59,714 | $119,428 | $179,142 | $238,856 | $298,570 |
| Total Fixed Assets | $1,490,000 | $1,430,286 | $1,376,320 | $1,322,626 | $1,269,234 | $1,216,173 |
| INTANGIBLE ASSETS: | ||||||
| Cost | $2,000 | $2,000 | $2,000 | $2,000 | $2,000 | $2,000 |
| Less-accumulated amortization | $0 | $400 | $800 | $1,200 | $1,600 | $2,000 |
| Total Intangible Assets | $2,000 | $1,600 | $1,200 | $800 | $400 | $0 |
| Other Assets | $86,500 | $90,000 | $95,000 | $100,000 | $105,000 | $110,000 |
| Total Assets | $1,695,000 | $1,940,113 | $2,052,536 | $2,162,162 | $2,242,786 | $2,280,280 |
| LIABILITIES: | ||||||
| Accounts payable | $0 | $19,360 | $20,327 | $21,547 | $23,055 | $24,900 |
| Notes payable | $0 | $0 | $0 | $0 | $0 | $0 |
| Current portion of long-term debt | $23,166 | $25,592 | $28,272 | $31,232 | $34,503 | $38,116 |
| Income taxes | $0 | $0 | $0 | $0 | $0 | $0 |
| Accrued expenses | $0 | $113,823 | $118,945 | $124,595 | $130,825 | $137,693 |
| Other current liabilities | $0 | $0 | $0 | $0 | $0 | $0 |
| Total Current Liabilities | $23,166 | $158,775 | $167,544 | $177,374 | $188,383 | $200,709 |
| Long-term debt | $1,376,834 | $1,351,242 | $1,322,970 | $1,291,737 | $1,257,234 | $1,219,118 |
| Deferred income | $0 | $0 | $0 | $0 | $0 | $0 |
| Deferred income taxes | $0 | $0 | $0 | $0 | $0 | $0 |
| Other long-term liabilities | $0 | $0 | $0 | $0 | $0 | $0 |
| Total Liabilities | $1,400,000 | $1,510,017 | $1,490,514 | $1,469,111 | $1,445,617 | $1,419,827 |
| EQUITY: | ||||||
| Capital stock issued | $295,000 | $295,000 | $295,000 | $295,000 | $295,000 | $295,000 |
| Additional paid in capital | $0 | $0 | $0 | $0 | $0 | $0 |
| Retained earnings | $0 | $135,096 | $267,022 | $398,051 | $502,169 | $565,453 |
| Total Equity | $295,000 | $430,096 | $562,022 | $693,051 | $797,169 | $860,453 |
| Total Liabilities and Equity | $1,695,000 | $1,940,113 | $2,052,536 | $2,162,162 | $2,242,786 | $2,280,280 |
| "C" Corporation (Y/N) | Y | |||||
| Cash balance positive /(negative) | Positive | Positive | Positive | Positive | Positive | Positive |
| Amount sheet is out-of-balance | $0 | $0 | $0 | $0 | $0 | $0 |
| Amount cash flow out-of-balance | $0 | $0 | $0 | $0 | $0 | |
Five-Year Cash Flow Statement
| FIVE-YEAR ANALYSIS | |||||
|
Projected
2000 |
Projected
2001 |
Projected
2002 |
Projected
2003 |
Projected
2004 |
|
| Cash from operations: | |||||
| Net earnings (loss) | $168,870 | $188,466 | $218,381 | $260,296 | $316,426 |
| Add-depreciation and amortization | $60,114 | $60,114 | $60,114 | $60,114 | $60,114 |
| Cash from operations | $228,984 | $248,580 | $278,495 | $320,410 | $376,540 |
| Cash provided (used) by operating activities: | |||||
| Accounts Receivable | ($53,721) | ($2,686) | ($3,385) | ($4,185) | ($5,119) |
| Inventory | ($44,694) | ($3,485) | ($4,391) | ($5,429) | ($6,641) |
| Other current assets | ($7,000) | ($5,000) | ($5,000) | ($10,000) | ($5,000) |
| Other non-current assets | ($3,500) | ($5,000) | ($5,000) | ($5,000) | ($5,000) |
| Accounts payable | $19,360 | $967 | $1,220 | $1,508 | $1,845 |
| Current portion of long-term debt | $2,426 | $2,680 | $2,960 | $3,271 | $3,613 |
| Income taxes | $0 | $0 | $0 | $0 | $0 |
| Accrued expenses | $113,823 | $5,122 | $5,650 | $6,230 | $6,868 |
| Other current liabilities | $0 | $0 | $0 | $0 | $0 |
| Dividends paid | ($33,774) | ($56,540) | ($87,352) | ($156,178) | ($253,142) |
| Net cash from operations | ($7,080) | ($63,942) | ($95,298) | ($169,783) | ($262,576) |
| Financing transactions | |||||
| Increases (decreases): | |||||
| Land | $0 | $0 | $0 | $0 | $0 |
| Buildings and improvements | $0 | $0 | $0 | $0 | $0 |
| Equipment | $0 | $3,658 | $3,831 | $4,023 | $4,234 |
| Furniture/Fixtures | $0 | $2,090 | $2,189 | $2,299 | $2,419 |
| Intangible assets | $0 | $0 | $0 | $0 | $0 |
| Net cash from investments | $0 | $5,748 | $6,020 | $6,322 | $6,653 |
| Financing transactions | |||||
| Increases (decreases): | |||||
| Short-term notes payable | $0 | $0 | $0 | $0 | $0 |
| Long-term debt | ($25,592) | ($28,272) | ($31,233) | ($34,503) | ($38,116) |
| Deferred income | $0 | $0 | $0 | $0 | $0 |
| Other long-term liabilities | $0 | $0 | $0 | $0 | $0 |
| Capital stock and paid in capital | $0 | $0 | $0 | $0 | $0 |
| Net cash from financing | ($25,592) | ($28,272) | ($31,233) | ($34,503) | ($38,116) |
| Net increase (decrease) in cash | $196,312 | $150,618 | $145,944 | $109,802 | $69,195 |
| Cash at beginning of period | $78,500 | $274,812 | $425,430 | $571,374 | $681,176 |
| Cash at the end of period | $274,812 | $425,430 | $571,374 | $681,176 | $750,371 |
Common Size Income Statement
|
Company
Projected 2000 |
Company
Projected 2001 |
Company
Projected 2002 |
Company
Projected 2003 |
Company
Projected 2004 |
Restaurant
Industry 1998 |
Restaurant
Industry 1998 |
|
| Revenue from Sales | 100.0% | 100.0% | 100.0% | 100.0% | 100.0% | 100.0% | 100.0% |
| Cost of Sales | 14.4% | 14.4% | 14.4% | 14.4% | 14.4% | 41.9% | 0.0% |
| Gross Profit | 85.6% | 85.6% | 85.6% | 85.6% | 85.6% | 58.1% | 100.0% |
| Operating Expenses | 72.7% | 71.8% | 70.4% | 68.6% | 66.3% | 53.2% | 92.2% |
| Operating Profit | 12.8% | 13.7% | 15.1% | 17.0% | 19.3% | 4.9% | 7.8% |
| Other Expen/Inc (Net) | 0.0% | 0.0% | 0.0% | 0.0% | 0.0% | -1.7% | -2.8% |
| Pre-Tax Profit | 12.8% | 13.7% | 15.1% | 17.0% | 19.3% | 3.2% | 5.0% |
| Income Taxes | 4.2% | 4.6% | 5.1% | 5.8% | 6.7% | 0.0% | 0.0% |
| Income After Taxes | 8.6% | 9.2% | 10.0% | 11.1% | 12.5% | 3.2% | 5.0% |
Common Size Balance Sheet
|
Company
Projected 2000 |
Company
Projected 2001 |
Company
Projected 2002 |
Company
Projected 2003 |
Company
Projected 2004 |
Restaurant
Industry 1998 |
Restaurant
Industry 1998 |
|
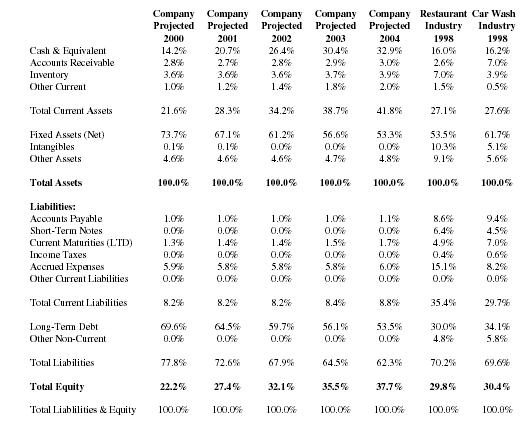
| Cash & Equivalent | 14.2% | 20.7% | 26.4% | 30.4% | 32.9% | 16.0% | 16.2% |
| Accounts Receivable | 2.8% | 2.7% | 2.8% | 2.9% | 3.0% | 2.6% | 7.0% |
| Inventory | 3.6% | 3.6% | 3.6% | 3.7% | 3.9% | 7.0% | 3.9% |
| Other Current | 1.0% | 1.2% | 1.4% | 1.8% | 2.0% | 1.5% | 0.5% |
| Total Current Assets | 21.6% | 28.3% | 34.2% | 38.7% | 41.8% | 27.1% | 27.6% |
| Fixed Assets (Net) | 73.7% | 67.1% | 61.2% | 56.6% | 53.3% | 53.5% | 61.7% |
| Intangibles | 0.1% | 0.1% | 0.0% | 0.0% | 0.0% | 10.3% | 5.1% |
| Other Assets | 4.6% | 4.6% | 4.6% | 4.7% | 4.8% | 9.1% | 5.6% |
| Total Assets | 100.0% | 100.0% | 100.0% | 100.0% | 100.0% | 100.0% | 100.0% |
| Liabilities: | |||||||
| Accounts Payable | 1.0% | 1.0% | 1.0% | 1.0% | 1.1% | 8.6% | 9.4% |
| Short-Term Notes | 0.0% | 0.0% | 0.0% | 0.0% | 0.0% | 6.4% | 4.5% |
| Current Maturities (LTD) | 1.3% | 1.4% | 1.4% | 1.5% | 1.7% | 4.9% | 7.0% |
| Income Taxes | 0.0% | 0.0% | 0.0% | 0.0% | 0.0% | 0.4% | 0.6% |
| Accrued Expenses | 5.9% | 5.8% | 5.8% | 5.8% | 6.0% | 15.1% | 8.2% |
| Other Current Liabilities | 0.0% | 0.0% | 0.0% | 0.0% | 0.0% | 0.0% | 0.0% |
| Total Current Liabilities | 8.2% | 8.2% | 8.2% | 8.4% | 8.8% | 35.4% | 29.7% |
| Long-Term Debt | 69.6% | 64.5% | 59.7% | 56.1% | 53.5% | 30.0% | 34.1% |
| Other Non-Current | 0.0% | 0.0% | 0.0% | 0.0% | 0.0% | 4.8% | 5.8% |
| Total Liabilities | 77.8% | 72.6% | 67.9% | 64.5% | 62.3% | 70.2% | 69.6% |
| Total Equity | 22.2% | 27.4% | 32.1% | 35.5% | 37.7% | 29.8% | 30.4% |
| Total Liablilities & Equity | 100.0% | 100.0% | 100.0% | 100.0% | 100.0% | 100.0% | 100.0% |
Average Monthly Break-even Analysis-2000
Car Wash
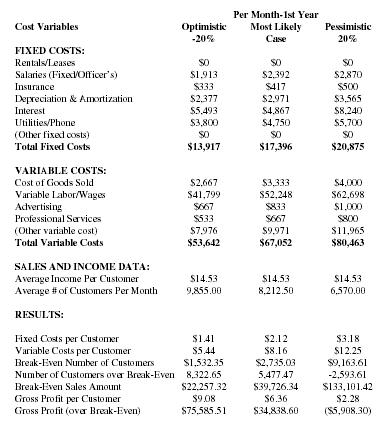
| Per Month-1st Year | |||
| Cost Variables |
Optimistic
-20% |
Most Likely
Case |
Pessimistic
20% |
| FIXED COSTS: | |||
| Rentals/Leases | $0 | $0 | $0 |
| Salaries (Fixed/Officer's) | $1,913 | $2,392 | $2,870 |
| Insurance | $333 | $417 | $500 |
| Depreciation & Amortization | $2,377 | $2,971 | $3,565 |
| Interest | $5,493 | $4,867 | $8,240 |
| Utilities/Phone | $3,800 | $4,750 | $5,700 |
| (Other fixed costs) | $0 | $0 | $0 |
| Total Fixed Costs | $13,917 | $17,396 | $20,875 |
| VARIABLE COSTS: | |||
| Cost of Goods Sold | $2,667 | $3,333 | $4,000 |
| Variable Labor/Wages | $41,799 | $52,248 | $62,698 |
| Advertising | $667 | $833 | $1,000 |
| Professional Services | $533 | $667 | $800 |
| (Other variable cost) | $7,976 | $9,971 | $11,965 |
| Total Variable Costs | $53,642 | $67,052 | $80,463 |
| SALES AND INCOME DATA: | |||
| Average Income Per Customer | $14.53 | $14.53 | $14.53 |
| Average # of Customers Per Month | 9,855.00 | 8,212.50 | 6,570.00 |
| RESULTS: | |||
| Fixed Costs per Customer | $1.41 | $2.12 | $3.18 |
| Variable Costs per Customer | $5.44 | $8.16 | $12.25 |
| Break-Even Number of Customers | $1,532.35 | $2,735.03 | $9,163.61 |
| Number of Customers over Break-Even | 8,322.65 | 5,477.47 | -2,593.61 |
| Break-Even Sales Amount | $22,257.32 | $39,726.34 | $133,101.42 |
| Gross Profit per Customer | $9.08 | $6.36 | $2.28 |
| Gross Profit (over Break-Even) | $75,585.51 | $34,838.60 | ($5,908.30) |
Average Monthly Break-even Analysis - 2000
Combined Restaurant & Gift Shop
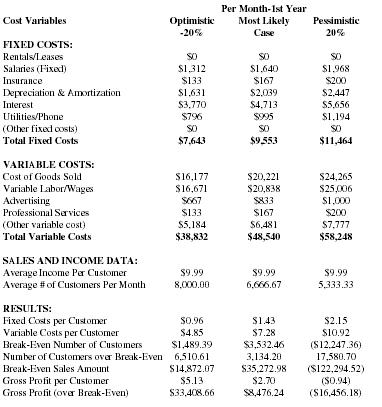
| Per Month-1st Year | |||
| Cost Variables |
Optimistic
-20% |
Most Likely
Case |
Pessimistic
20% |
| FIXED COSTS: | |||
| Rentals/Leases | $0 | $0 | $0 |
| Salaries (Fixed) | $1,312 | $1,640 | $1,968 |
| Insurance | $133 | $167 | $200 |
| Depreciation & Amortization | $1,631 | $2,039 | $2,447 |
| Interest | $3,770 | $4,713 | $5,656 |
| Utilities/Phone | $796 | $995 | $1,194 |
| (Other fixed costs) | $0 | $0 | $0 |
| Total Fixed Costs | $7,643 | $9,553 | $11,464 |
| VARIABLE COSTS: | |||
| Cost of Goods Sold | $16,177 | $20,221 | $24,265 |
| Variable Labor/Wages | $16,671 | $20,838 | $25,006 |
| Advertising | $667 | $833 | $1,000 |
| Professional Services | $133 | $167 | $200 |
| (Other variable cost) | $5,184 | $6,481 | $7,777 |
| Total Variable Costs | $38,832 | $48,540 | $58,248 |
| SALES AND INCOME DATA: | |||
| Average Income Per Customer | $9.99 | $9.99 | $9.99 |
| Average # of Customers Per Month | 8,000.00 | 6,666.67 | 5,333.33 |
| RESULTS: | |||
| Fixed Costs per Customer | $0.96 | $1.43 | $2.15 |
| Variable Costs per Customer | $4.85 | $7.28 | $10.92 |
| Break-Even Number of Customers | $1,489.39 | $3,532.46 | ($12,247.36) |
| Number of Customers over Break-Even | 6,510.61 | 3,134.20 | 17,580.70 |
| Break-Even Sales Amount | $14,872.07 | $35,272.98 | ($122,294.52) |
| Gross Profit per Customer | $5.13 | $2.70 | ($0.94) |
| Gross Profit (over Break-Even) | $33,408.66 | $8,476.24 | ($16,456.18) |
Average Monthly Break-even Analysis - 2000
Combined Operations
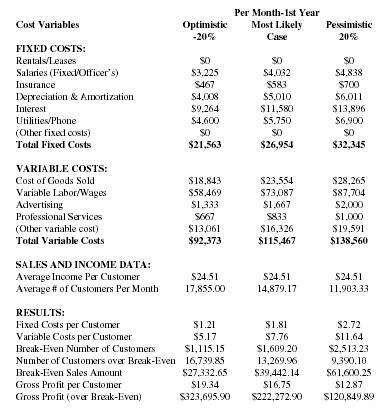
| Per Month-1st Year | |||
| Cost Variables |
Optimistic
-20% |
Most Likely
Case |
Pessimistic
20% |
| FIXED COSTS: | |||
| Rentals/Leases | $0 | $0 | $0 |
| Salaries (Fixed/Officer's) | $3,225 | $4,032 | $4,838 |
| Insurance | $467 | $583 | $700 |
| Depreciation & Amortization | $4,008 | $5,010 | $6,011 |
| Interest | $9,264 | $11,580 | $13,896 |
| Utilities/Phone | $4,600 | $5,750 | $6,900 |
| (Other fixed costs) | $0 | $0 | $0 |
| Total Fixed Costs | $21,563 | $26,954 | $32,345 |
| VARIABLE COSTS: | |||
| Cost of Goods Sold | $18,843 | $23,554 | $28,265 |
| Variable Labor/Wages | $58,469 | $73,087 | $87,704 |
| Advertising | $1,333 | $1,667 | $2,000 |
| Professional Services | $667 | $833 | $1,000 |
| (Other variable cost) | $13,061 | $16,326 | $19,591 |
| Total Variable Costs | $92,373 | $115,467 | $138,560 |
| SALES AND INCOME DATA: | |||
| Average Income Per Customer | $24.51 | $24.51 | $24.51 |
| Average # of Customers Per Month | 17,855.00 | 14,879.17 | 11,903.33 |
| RESULTS: | |||
| Fixed Costs per Customer | $1.21 | $1.81 | $2.72 |
| Variable Costs per Customer | $5.17 | $7.76 | $11.64 |
| Break-Even Number of Customers | $1,115.15 | $1,609.20 | $2,513.23 |
| Number of Customers over Break-Even | 16,739.85 | 13,269.96 | 9,390.10 |
| Break-Even Sales Amount | $27,332.65 | $39,442.14 | $61,600.25 |
| Gross Profit per Customer | $19.34 | $16.75 | $12.87 |
| Gross Profit (over Break-Even) | $323,695.90 | $222,272.90 | $120,849.89 |
Car Wash Break-even Chart - Year 1
| Income per customer | $14.53 |
| Total fixed Costs | $17,395.76 |
| Variable costs per customer | $8.16 |
| # of customers | Total Revenues | Total Costs |
| 1,641.02 | $23,836 | $30,794 |
| 1,914.52 | $27,808 | $33,027 |
| 2,188.03 | $31,781 | $35,260 |
| 2,461.53 | $35,754 | $37,493 |
| 2,735.03 | $39,726 | $39,726 |
| 3,008.54 | $43,699 | $41,959 |
| 3,282.04 | $47,672 | $44,192 |
| 3,555.54 | $51,644 | $46,426 |
| 3,829.05 | $55,617 | $48,659 |
| 4,102.55 | $59,590 | $50,892 |
Restaurant & Gift Shop Break-even Chart - Year 1
| # of customers | Total Revenues | Total Costs |
| 2,119.48 | $21,164 | $24,985 |
| 2,472.73 | $24,691 | $27,557 |
| 2,825.97 | $28,218 | $30,129 |
| 3,179.22 | $31,746 | $32,701 |
| 3,532.46 | $35,273 | $35,273 |
| 3,885.71 | $38,800 | $37,845 |
| 4,238.96 | $42,328 | $40,417 |
| 4,592.20 | $45,855 | $42,989 |
| 4,945.45 | $49,382 | $45,561 |
| 5,298.70 | $52,909 | $48,133 |
Loan Compliance Covenants
| Year |
Net
Working Capital |
Current
Ratio |
Quick
Ratio |
EBIT/
Interest |
EBIT/
I+P |
DEBT/
Equity |
Z-Score |
| 2000 | $259,452 | 2.63 | 2.07 | 2.81 | 2.41 | 3.52 | 1.91 |
| 2001 | $412,472 | 3.46 | 2.88 | 3.07 | 0.37 | 2.66 | 2.05 |
| 2002 | $561,362 | 4.16 | 3.56 | 3.47 | 0.85 | 2.12 | 2.21 |
| 2003 | $679,769 | 4.61 | 3.96 | 4.03 | 8.41 | 1.81 | 2.41 |
| 2004 | $753,398 | 4.75 | 4.08 | 4.81 | 0.00 | 1.65 | 2.64 |
| Industry Median | N/A | 1.00 | 0.80 | 2.00 | N/A | 3.00 | N/A |
Annual Projections Summary
|
Projection
Period |
Gross
profit |
After-Tax
Net Income |
Cash from
Operations |
Book
Equity |
| Start-Up/Base | $295,000 | |||
| 2000 | $1,678,181 | $168,870 | $228,984 | $430,096 |
| 2001 | $1,762,091 | $188,466 | $248,580 | $562,022 |
| 2002 | $1,867,816 | $218,381 | $278,495 | $693,051 |
| 2003 | $1,998,563 | $260,296 | $320,410 | $797,169 |
| 2004 | $2,158,448 | $316,426 | $376,540 | $860,453 |
Rates of Return
| Net Income | IRR | MIRR |
ANNUAL
DIVIDENDS |
TOTAL
ASSETS |
|
| Initial | |||||
| Investment | ($295,000) | ||||
| 2000 | $168,870 | 0.00% | -42.76% | $33,774 | $1,940,113 |
| 2001 | $188,466 | 13.52% | 128.44% | $56,540 | $2,052,536 |
| 2002 | $218,381 | 40.35% | 248.94% | $87,352 | $2,162,162 |
| 2003 | $260,296 | 54.05% | 329.65% | $156,178 | $2,242,786 |
| 2004 | $316,426 | 61.67% | 386.57% | $253,142 | $2,280,280 |
ASSUMPTIONS:
Income figures are after taxes
Dividend Payout = 50% of After Tax Income
Reinvestment rate = 7%
IRR = INTERNAL RATE OF RETURN
MIRR = MODIFIED RATE OF RETURN
ROI = RATE OF RETURN ON OWNER'S INVESTMENT
ROA = RATE OF RETURN ON TOTAL ASSETS
IRR = the interest rate received for an investment and income that occur
at regular periods.
MIRR = adds the cost of funds and interest received on reinvestment of
cash to the IRR.
| 2000 | 2001 | 2002 | 2003 | 2004 | |
| Return on Assets | 8.70% | 9.18% | 10.10% | 11.61% | 13.88% |
| Return on Investment | 11.45% | 19.17% | 29.61% | 52.94% | 85.81% |
| Income Per Share | $0.57 | $0.64 | $0.74 | $0.88 | $1.07 |
| Dividends Per Share | $0.11 | $0.19 | $0.30 | $0.53 | $0.86 |
Income Per Share Chart

| Year 1 | $0.57 |
| Year 2 | $0.64 |
| Year 3 | $0.74 |
| Year 4 | $0.88 |
| Year 5 | $1.07 |
Income Statement
|
Projected
2000 |
Projected
2001 |
Projected
2002 |
Projected
2003 |
Projected
2004 |
|
| Sales | 1,960,830 | 2,058,872 | 2,182,404 | 2,335,172 | 2,521,986 |
| Cost of Sales | 282,649 | 296,781 | 314,588 | 336,609 | 363,538 |
| Expenses | 1,426,404 | 1,479,208 | 1,537,450 | 1,601,664 | 1,672,454 |
| Operating Income | 251,777 | 282,883 | 330,366 | 396,899 | 485,994 |
| Income Taxes | 82,907 | 94,417 | 111,985 | 136,603 | 169,568 |
| Net Income | 168,870 | 188,466 | 218,381 | 260,296 | 316,426 |
Balance Sheet Chart
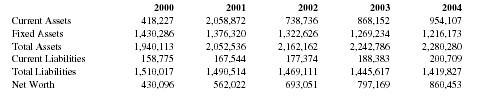
| 2000 | 2001 | 2002 | 2003 | 2004 | |
| Current Assets | 418,227 | 2,058,872 | 738,736 | 868,152 | 954,107 |
| Fixed Assets | 1,430,286 | 1,376,320 | 1,322,626 | 1,269,234 | 1,216,173 |
| Total Assets | 1,940,113 | 2,052,536 | 2,162,162 | 2,242,786 | 2,280,280 |
| Current Liabilities | 158,775 | 167,544 | 177,374 | 188,383 | 200,709 |
| Total Liabilities | 1,510,017 | 1,490,514 | 1,469,111 | 1,445,617 | 1,419,827 |
| Net Worth | 430,096 | 562,022 | 693,051 | 797,169 | 860,453 |
Growth Trends
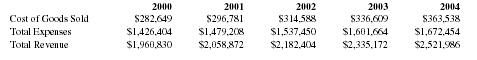
| 2000 | 2001 | 2002 | 2003 | 2004 | |
| Cost of Goods Sold | $282,649 | $296,781 | $314,588 | $336,609 | $363,538 |
| Total Expenses | $1,426,404 | $1,479,208 | $1,537,450 | $1,601,664 | $1,672,454 |
| Total Revenue | $1,960,830 | $2,058,872 | $2,182,404 | $2,335,172 | $2,521,986 |
Net Income Growth
| 2000 | 2001 | 2002 | 2003 | 2004 | |
| NET INCOME | $168,870 | $188,466 | $218,381 | $260,296 | $316,426 |
This page left intentionally blank to accommodate tabular matter following.
Ratio Comparison
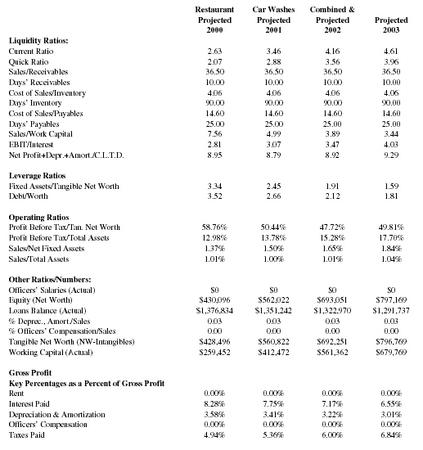
|
Restaurant
Projected 2000 |
Car Washes
Projected 2001 |
Combined &
Projected 2002 |
Projected
2003 |
|
| Liquidity Ratios: | ||||
| Current Ratio | 2.63 | 3.46 | 4.16 | 4.61 |
| Quick Ratio | 2.07 | 2.88 | 3.56 | 3.96 |
| Sales/Receivables | 36.50 | 36.50 | 36.50 | 36.50 |
| Days' Receivables | 10.00 | 10.00 | 10.00 | 10.00 |
| Cost of Sales/Inventory | 4.06 | 4.06 | 4.06 | 4.06 |
| Days' Inventory | 90.00 | 90.00 | 90.00 | 90.00 |
| Cost of Sales/Payables | 14.60 | 14.60 | 14.60 | 14.60 |
| Days' Payables | 25.00 | 25.00 | 25.00 | 25.00 |
| Sales/Work Capital | 7.56 | 4.99 | 3.89 | 3.44 |
| EBIT/Interest | 2.81 | 3.07 | 3.47 | 4.03 |
| Net Profit+Depr.+Amort./C.L.T.D. | 8.95 | 8.79 | 8.92 | 9.29 |
| Leverage Ratios | ||||
| Fixed Assets/Tangible Net Worth | 3.34 | 2.45 | 1.91 | 1.59 |
| Debt/Worth | 3.52 | 2.66 | 2.12 | 1.81 |
| Operating Ratios | ||||
| Profit Before Tax/Tan. Net Worth | 58.76% | 50.44% | 47.72% | 49.81% |
| Profit Before Tax/Total Assets | 12.98% | 13.78% | 15.28% | 17.70% |
| Sales/Net Fixed Assets | 1.37% | 1.50% | 1.65% | 1.84% |
| Sales/Total Assets | 1.01% | 1.00% | 1.01% | 1.04% |
| Other Ratios/Numbers: | ||||
| Officers' Salaries (Actual) | $0 | $0 | $0 | $0 |
| Equity (Net Worth) | $430,096 | $562,022 | $693,051 | $797,169 |
| Loans Balance (Actual) | $1,376,834 | $1,351,242 | $1,322,970 | $1,291,737 |
| % Deprec., Amort./Sales | 0.03 | 0.03 | 0.03 | 0.03 |
| % Officers' Compensation/Sales | 0.00 | 0.00 | 0.00 | 0.00 |
| Tangible Net Worth (NW-Intangibles) | $428,496 | $560,822 | $692,251 | $796,769 |
| Working Capital (Actual) | $259,452 | $412,472 | $561,362 | $679,769 |
| Gross Profit | ||||
| Key Percentages as a Percent of Gross Profit | ||||
| Rent | 0.00% | 0.00% | 0.00% | 0.00% |
| Interest Paid | 8.28% | 7.75% | 7.17% | 6.55% |
| Depreciation & Amortization | 3.58% | 3.41% | 3.22% | 3.01% |
| Officers' Compensation | 0.00% | 0.00% | 0.00% | 0.00% |
| Taxes Paid | 4.94% | 5.36% | 6.00% | 6.84% |
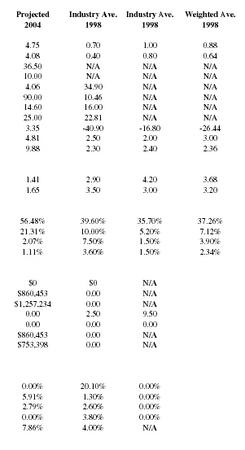
|
Projected
2004 |
Industry Ave.
1998 |
Industry Ave.
1998 |
Weighted Ave.
1998 |
| 4.75 | 0.70 | 1.00 | 0.88 |
| 4.08 | 0.40 | 0.80 | 0.64 |
| 36.50 | N/A | N/A | N/A |
| 10.00 | N/A | N/A | N/A |
| 4.06 | 34.90 | N/A | N/A |
| 90.00 | 10.46 | N/A | N/A |
| 14.60 | 16.00 | N/A | N/A |
| 25.00 | 22.81 | N/A | N/A |
| 3.35 | -40.90 | -16.80 | -26.44 |
| 4.81 | 2.50 | 2.00 | 3.00 |
| 9.88 | 2.30 | 2.40 | 2.36 |
| 1.41 | 2.90 | 4.20 | 3.68 |
| 1.65 | 3.50 | 3.00 | 3.20 |
| 56.48% | 39.60% | 35.70% | 37.26% |
| 21.31% | 10.00% | 5.20% | 7.12% |
| 2.07% | 7.50% | 1.50% | 3.90% |
| 1.11% | 3.60% | 1.50% | 2.34% |
| $0 | $0 | N/A | |
| $860,453 | 0.00 | N/A | |
| $1,257,234 | 0.00 | N/A | |
| 0.00 | 2.50 | 9.50 | |
| 0.00 | 0.00 | 0.00 | |
| $860,453 | 0.00 | N/A | |
| $753,398 | 0.00 | N/A | |
| 0.00% | 20.10% | 0.00% | |
| 5.91% | 1.30% | 0.00% | |
| 2.79% | 2.60% | 0.00% | |
| 0.00% | 3.80% | 0.00% | |
| 7.86% | 4.00% | N/A |
RATIO ANALYSIS
If A.B.C., Inc. meets the financial goals outlined in this plan, a ratio analysis of those numbers are extremely favorable when compared to industry averages according to the Robert Morris & Associates 1998 industry average figures.
Current Ratio is an approximate measure of a firm's ability to meet its current obligations and is calculated as Current Assets divided by Current Liabilities. The company's Current Ratio is above the industry median. This indicates a relatively more stable position for the company compared to the industry and indicates a possible opportunity for expanding operations.
Quick Ratio is a measure of a firm's ability to meet current obligations without relying on the sale of inventories. It is calculated as Current Assets minus inventories divided by Current Liabilities. This ratio is above the industry median, which indicates that A.B.C., Inc. is more stable relative to the industry and again points to an apparent opportunity for expansion.
EBIT to interest ratio is a measure of ability to meet annual interest payments. It is calculated as Earnings before Interest and Taxes divided by Annual Interest Expense. Since this ratio is above industry averages, the company should have no problem servicing its debt and can even service greater amounts of debt.
The Fixed Assets to Tangible Net Worth Ratio measures the extent to which owner's equity has been invested in the business. Since this ratio is on a downward trend, it provides an even larger "cushion" to creditors in the event of liquidation.
Current Maturities Coverage Ratio measures the ability to pay current maturities of longterm debt with cash flow from operations. It is calculated as Net Income + depreciation & amortization divided by current portion of long-term debt. This ratio is on an upward trend which indicates that cash flows available to service debt are increasing relative to the level of debt. It also indicates additional debt capacity is available if needed.
The Debt to Equity Ratio expresses the relationship between capital contributed by creditors and capital contributed by owners. It is calculated as Total Liabilities divided by Net Worth. This ratio shows a downward trend which would seem to indicate that if the company meets its goals that it will provide greater long-term financial safety for creditors. It also points out that A.B.C., Inc. can handle additional debt if needed.
The Earnings before Taxes to Total Assets Ratio expresses the pre-tax return on total assets and measures the effectiveness of management in employing available resources. It is calculated as Earnings Before Taxes divided by Net Worth minus Net Intangible Assets times 100. Since this ratio is above industry averages, the company would be more efficient than the industry in its effective employment of resources and would out-perform the industry as a whole.
The Revenue to Total Assets Ratio is a general measure of ability to generate revenue in relation to total assets. It is calculated as Earnings Before Taxes divided by Total Assets times 100. This ratio is above industry averages which can indicate that the company is efficient in using available resources to generate revenue as compared to the industry.
CONCLUSIONS & SUMMARY
Assuming the financial projections in this plan are attained, the future looks very bright indeed. The property improvement, increased inventory items and the continued growth of both the car wash, restaurant, and the surrounding Madison area will help make A.B.C., Inc. one of the premier car wash destinations in the area.
A look at the financial ratios in this plan bears out our confidence in the future. A look at our competition comparison gives us a real look into the possibilities to become a market leader. A close look at the property can only reaffirm that the market, location, and clientele are all in place and waiting to be serviced by a car wash and restaurant such as A.B.C., Inc.
Throughout this plan we have taken special care to remain conservative in our growth projections. Even so, the numbers are spectacular. Some of the highlights include:
- Return on Invest of 15.45%, 19.17%, 29.61%, 55.94%, and 95.81% over the next five years.
- Steady growth conservatively averaging over 5% per year.
- Pre-Tax Profit is consistently far above industry averages.
- Total Equity is substantially higher than peer operations by the third year.
- Far greater strengths than weaknesses when compared to competition.
- Overall risks associated with the business are low.
Investment in A.B.C., Inc. at this time makes excellent economic sense. The projected cash flow is well above industry averages.
Comment about this article, ask questions, or add new information about this topic: