Home Décor Products Manufacturer
BUSINESS PLAN
BURTON DECOR, INC.
14275 Washington Avenue
Skokie, Illinois 60077
Burton Décor manufactures high-quality specialty home décor products for the mass market, specifically items designed for the Christmas season. This plan raised more than $1 million in capital for the company's owners.
- DESCRIPTION OF BUSINESS
- PRODUCTS & SERVICES OFFERED
- MARKET ANALYSIS
- LOCATION OF BUSINESS
- COMPETITION
- MANAGEMENT
- PERSONNEL
- APPLICATION & EXPECTED EFFECT OF INVESTMENT
- FINANCIAL DATA
DESCRIPTION OF BUSINESS
Burton Décor, Inc., designs and develops specialty Christmas and soft (also known as "cut and sewn") home décor products manufactured in India. India's extraordinary fabrics and handiwork are not readily available in other countries and stand out from the typical mass-produced product currently available. These unique, value-priced products will be targeted to U.S.-based mass merchants such as Sears, Target, and Wal-Mart. Specifically, Burton Décor will bring a high-end look to the mass market.
Burton Décor aims to offer unusual, unique specialty items at competitive prices. Beautiful handiwork such as beading, embroidery, and weaving will help merchants stand out from their competitors and draw in shoppers. Although Burton Décor will offer narrow product lines as compared to their competitors, the company will produce in high volumes to meet the demands of mass merchants. In addition, Burton Décor can customize products to suit individual buyers' tastes.
John Smith, the man behind Burton Décor, has the product development experience, design talent, and established relationships necessary to meet those demands. Along with his 20 years of retailing and interior design experience, John spent the last two-and-a-half years working for Tuppi, one of the nation's leading gift product importers to mass merchants. His sourcing, product development, and production experience, in combination with his design talent and people skills, has allowed him to develop the know-how and relationships necessary to understand and meet the needs of mass merchants.
Business Model
As a direct importer, Burton Décor products will be shipped from the factory directly to the retailer. As such, Burton Décor will carry no inventory, with production beginning only when a purchase order is received. Payments between retailers and Burton Décor, and between Burton Décor and its factories will be made by letter-of-credit, resulting in minimal financial exposure.
PRODUCTS & SERVICES OFFERED
Burton Décor develops the designs, samples, and packaging for specialty Christmas and soft home décor products manufactured in India. Its product lines are meant to broaden the offerings of mass merchants, with unique handiwork such as beading, embroidery, and weaving in beautiful silks, velvets, and pashmina. In order for buyers to review the product lines, samples of each product are displayed in Burton Décor's Chicago showroom.
Product Lines
Burton Décor's product lines will be narrow and focused on the unique fabrics, colors, and beautiful handiwork typical of India. The lines will have a specific point of view and, as such, will not try to be all things to all buyers. The product categories for which Burton Décor will design products are:
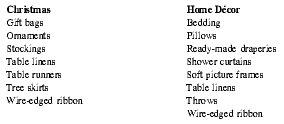
| Christmas | Home Décor |
| Gift bags | Bedding |
| Ornaments | Pillows |
| Stockings | Ready-made draperies |
| Table linens | Shower curtains |
| Table runners | Soft picture frames |
| Tree skirts | Table linens |
| Wire-edged ribbon | Throws |
| Wire-edged ribbon |
Burton Décor's philosophy is that it is possible to feature well-designed, fashion-forward, high-quality products at competitive prices. The four cornerstones of that philosophy are:
- Design: Well-designed, fashion-forward products for the mass market
- Quality: High-quality products produced in a quality-controlled environment
- Value: Offering well-designed, quality products at affordable prices
- Relationships: Listening to our buyers and building trusting relationships with them
The product lines will feature a distinct point of view, yet products can be customized to suit individual buyers' tastes. Burton Décor will work closely with buyers to build their businesses because they want the merchants to succeed. Burton Décor does that by listening and responding to their needs. As a mass merchant buyer recently told John Smith, "You're the only person I trust because you're the only one who doesn't try to sell me something I don't want or need." This sentiment is the underpinning of Burton Décor's philosophy.
Benefits
Mass merchants want high-quality, fashion-forward products at competitive prices because they want to offer their customers a high-end look at an affordable price. India is an untapped geographic resource.
In the current marketplace, China is India's biggest competitor. While China offers good quality and great prices, the level of creativity and craftsmanship is limited. China's strength is in setting up factories to do mass runs. India offers great creativity, great quality, and great prices. The drawback has been their inability to offer mass merchants a way to buy consistently well-designed and well-produced products in one centralized location.
Burton Décor offers mass merchants the opportunity to draw in customers with products heretofore unavailable at these price points. Mass merchants can:
- Bring high-end looks to the mass market, by offering their customers well-designed, fashion-forward products at affordable prices
- Buy unique products with unusual handiwork at competitive prices
- Round out and add depth to their departments
- Stand out from their competitors
- Buy products of India in a centralized buying location
- Enjoy the security of knowing they are buying well-designed, quality-controlled products
- Benefit from Burton Décor's retailing, design, and production experience
Pricing
Burton Décor products are developed within the context of mass merchant price points. Burton Décor wants to provide great design and great quality at a great value. The standard industry markup on Christmas and home décor products is 30 to 40 percent. Burton Décor is structured in such a way that overhead is kept low and the markup is 25 percent. Burton Décor is able to do this because of two cost-effective differences from their competitors: (i) no warehouse and (ii) no inventory.
Production
Burton Décor will be working with a new, Wal-Mart-approved factory located in India not far from Mumbai (Bombay). This factory will be the primary production facility for Burton Décor products. The factory owner, Bob Davidson, is a local businessman who has had a close working relationship with John Smith for several years and will also act as the agent for Burton Décor.
The production cycle will be as follows:
- Once the factory receives an order, the factory, in turn, places the orders for fabric—which takes 7 to 10 days, depending on the specific fabric used.
- The fabric is then delivered on the 15th day from the order date, at which point the fabric is cut. Overall, the first 30 days from the order date go into procuring fabric and cutting.
- Once the pieces are cut, they are sent for embroidery and stitching, and then sent back to the factory for final production.
- Fabric and work quality are inspected at each stage. Sign-off samples for Burton Décor will be used for quality control.
- Orders will require a lead time of 90 to 150 days, depending on the work and quantities involved.
- The ICD ("Inland Container Depot") is 2 to 3 kilometers away from the factory site. Containers will be packed in the factory.
- All customs clearance formalities will be handled at the ICD, after which the containers will be sealed for inland transportation to the port in Mumbai. From there it will be shipped to the customer. Payment will be made by letter-of-credit.
- Transit time to the East Coast is 30 days and to the West Coast is 45 days.
Timeline
Burton Décor will enter the marketplace by developing its Christmas line for the Christmas 2003 buying season, as outlined below. Buyers typically fly to Hong Kong in October and/or January in order to buy their overseas merchandise for the Christmas season at least one year in advance.
- Spring/Summer 2002: John Smith will design the Burton Décor Christmas line
- September 2002: Burton Décor's Chicago showroom will have samples and begin bringing in buyers to introduce them to the company and the Christmas line
MARKET ANALYSIS
"Today, Christmas is part of the gift industry, part of the home décor industry and even part of the fashion industry. Christmas décor...is being reinterpreted through the same prisms of style and culture and self-expression that influence other consumer categories."
—Mary Ford, Editor, Selling Christmas Décorations, March 2002
Burton Décor's target markets are the Christmas and home décor departments of mass merchants. The synergy between the two is clear, as illustrated in the quote above. By targeting both markets, Burton Décor can reduce the seasonal earnings fluctuations typical of Christmas-only vendors. Both markets are fashion-driven, with buyers always looking for the next new thing—in terms of design and resources.
Today's mass merchants want to offer broader looks in their Christmas and home décor departments. They want to offer products and looks from more than one country in order to:
- Round out product selection by offering unusual, unique specialty items
- Add eye-catching products to draw in customers
- Appeal to the growing ethnic diversity of their customer base
- Stand out from competitors
Consumer tastes are becoming more sophisticated as their exposure to global influences increases. Television shows such as "Martha Stewart," "Oprah," and those on HGTV have broadened the horizons of consumers. Add to this the "bargain as fashion" message of Target stores, and you've got consumers who want high style, but at an affordable price.
The country's trend toward cocooning at home has increased the demand for decorative home accessories in rich colors and fabrics. Combine this trend with the more cost-conscious consumer and you've got the mass merchant customer who wants it all: high style at an affordable price. Buyers understand these trends and want to exploit them. They understand that accessories can change the look of a room without refurnishing—tapping into the consumer's fashion and budget demands.
Current trends demonstrate another important factor at work in the marketplace: Consumers are more ethnically diverse than ever, and they want to embrace their cultural differences. Mass merchants want sources that can tap into the ethnic diversity that is their customer base. Buyers are looking for new resources with fresh design ideas, and India is an untapped geographic resource.
Why India?
Retail merchants and their customers are increasingly demanding the handcrafted, detailed look typical of India's artisans. Trend-setting merchants such as Pottery Barn, Crate & Barrel, and Z Gallerie have been sourcing India for the last several years. They manufacture and import their own products from their own India-based resources. These retailers have invested in their own product development departments, which allows them to successfully source new markets.
Mass merchants, however, are not able to dedicate such substantial financial resources and still maintain their low price points. They want to follow the trends and offer their customers similar looks, but at affordable prices. However, India does not have the infrastructure in place to service them. Mass merchants want to find resources ready to produce high volumes of desired items upon demand.
Below is a brief geographic analysis of the Christmas and home décor marketplace, specifically focusing on countries manufacturing cut and sewn products.
- Philippines: Although they do intricate, incredibly beautiful work, their prices are very high. In addition, their manufacturing is set up as a cottage industry and, as such, is too small to handle the volume mass merchants demand.
- China: The quality, details, and types of materials used are good, not great. They do not have the creativity and handiwork abilities that are available in India. China's strength is in setting up factories to do mass production runs. Although the prices for their product have been very low, that pricing strategy has come under increasing pressure as the Chinese government cracks down on manufacturers' "flexible" accounting, resulting in higher tax payments.
- India: They are known for their fabrics (silks, velvets, pashmina), and their handiwork (beading, embroidery, weaving). Currently, India has no infrastructure for large production runs. The Wal-Marts of the world don't have the time, design capabilities, know-how or ability to control the process from afar—it's too much of a headache for them to go to India, and they do not have the contacts necessary to make it work.
Burton Decor's Comparative Advantage
India is a difficult country to work with due to cultural and legal issues. There are no copyright laws in India, and while agents and manufacturers will promise almost anything, having them deliver on those promises is anything but reliable. The key to success in India is finding a resource that understands design and production requirements while also being trustworthy and reliable—difficult qualities to find in India. John Smith has developed just such a relationship, which is the key to Burton Décor's ability to service U.S.-based mass merchants. Burton Décor's agent and primary manufacturer, Bob Davidson, states, "Remember, this is India and there are no copyright laws. Business is based purely on trust, which is a very rare commodity."
Sales Strategy
Burton Décor will establish itself by building on the strong buyer relationships John Smith developed during his years at Tuppi. Based on those relationships, Burton Décor can arrange meetings with the Christmas buyers, and then leverage those relationships to arrange for meetings with home décor buyers.
The key to Burton Décor's sales strategy is showing the product lines to the right buyers. Burton Décor understands that cross-selling among the departments within a store is an overlooked, yet strategic advantage in retailing. Cross-selling will set Burton Décor apart from their competition. For example, gift bags and wire-edged ribbon are product categories sold in both Christmas and stationery/gift departments. Each department has separate buyers with different budgets. Typically, vendors only target one department's buyer, thereby missing out on sales opportunities within the same organization. Burton Décor will not let those strategic opportunities slip away.
Most vendors participate in trade shows, which can cost $10,000 per show. However, these shows target smaller retailers. Since Burton Décor is targeting mass merchants, the company can use their marketing dollars more effectively by flying in buyers who might not otherwise come to Chicago. It is important to note that Burton Décor will attend trade shows in order to keep abreast of the trends and competitors' product lines.
Target Markets
Burton Décor is specifically targeting high-volume retailers serving the value-conscious consumer. These retailers fall into numerous categories. Several of these categories, along with examples of specific retailers, are listed below.
- Mass Merchants: Wal-Mart, Target, Sears
- Catalogue: Spiegel, Lillian Vernon, Fingerhut
- Craft/Garden: Frank's Nursery, Garden Ridge, Michael's
- Drug/Hardware: Walgreen's, Rite Aid, Ace Hardware
- Warehouse: Sam's Club, Lowe's, Costco
- Bed/Bath: Linens 'n Things, Bed Bath & Beyond
LOCATION OF BUSINESS
Burton Décor will lease 3,000 square feet of office and showroom space (2,000 for office and 1,000 for showroom). Rent is approximately $22/square feet annually, totaling $66,000/year or $5,500/month. For budgeting purposes Burton Décor is assuming an annual increase of 3 to 5 percent.
The space will be located in or near the Chicago suburbs of Lincolnwood, Skokie, or Des Plaines because they are conveniently located near O'Hare Airport and the rent is lower than in Chicago.
COMPETITION
There are literally thousands of design and manufacturing companies in the Christmas and home décor marketplace. Typically, competitors fall into one of two categories: (1) The vast majority offer a product assortment that is too broad and lacks an appealing point of view or look. The price point may be attractive, but the product is mundane and the same as what their competitors are showing, or (2) the products are designed well and offer an exciting look, but the price point is too high.
As a result, the competition for mass merchant buying dollars is not especially competitive. Vendors consistently target the high-end buyers at merchants such as department stores and specialty stores. No one is thinking both "fashion forward" and "volume," which leaves the market open for Burton Décor. An analysis of Burton Décor's four nearest competitors follows.
Competitor #1
Who They Are
Competitor #1 designs and develops Christmas-related products. They have direct import and domestic product lines. The company is based in Illinois and is privately owned by Loonis-X Corp. Competitor #1 has been in business for more than 20 years. Estimated annual revenues are $300 million.
Products
Product categories include: lights, trees, mouth-blown glass ornaments, table linens, animation, tree skirts, stockings, ribbon and bows, wreaths and garland, and bead garland. The company imports primarily from China. Competitor #1 offers a domestic line, requiring them to warehouse inventory domestically. This allows them to sell to smaller shops and to sell smaller quantities to customers buying less than a container-load.
Strengths
- Marketing/merchandising. They put together beautiful, eye-catching presentations in showrooms located at prime addresses. They display the showroom like a high-end department store; i.e., products are not just thrown on a shelf. Detail-oriented.
- Offer better product for the price. Competitor #1 spots high-end trends and develops knock-offs at affordable prices.
- If one category is not selling well in a particular year, Competitor #1 will adapt quickly by jumping into another category to make up the dollars lost for that year.
Weaknesses
- They do not build their business from year to year. When a particular category starts doing well for a competitor, Competitor #1 changes direction and chases the business in that same category while ignoring the categories that they had been building. As in a plate spinning circus act, they let plates drop as they run to spin others.
- Inventory risk—by offering a domestic line and warehousing the product.
What Was Learned from Watching Their Operation
- The importance of presentation
- Offer a good product for the price
- Always demand more from the manufacturer—design for the high-end first and adjust manufacturing and design details affecting the price at a later stage.
Competitor #2
Who They Are
Competitor #2 designs and manufactures holiday items for six holidays: Halloween, Thanksgiving, Christmas, St. Patrick's Day, Easter, and July Fourth. They have direct import and domestic product lines. The company is based in New York and is privately owned by Alan Brown, an Israeli-born engineer. Competitor #2 has been in business for approximately 15 years. Estimated annual revenues are $100 million.
Products
Competitor #2 designs their own fabrics. They focus primarily on wire-edged ribbons and bows, although their product line also includes glass ball ornaments. Competitor #2 has begun to enter the home décor market with products using fabric matching their ribbon, e.g., table linens, table runners, and gift bags. The company manufactures its products in Guatemala—they are the largest employer there. Until Christmas 2002, Competitor #2 has been Kmart's largest Christmas supplier (now it will be Martha Stewart).
Strengths
- Lowest price point on ribbon (because they are the manufacturer).
- Owner is very analytical; he's very good at analyzing his business.
- Year to year he knows what items are selling and helps buyers choose their assortments.
Weaknesses
- Poor people skills; inflexible and unaccommodating with buyers, resulting in lost business.
- Not creative. They offer the same looks year after year, with very similar fabrics. They do not develop "looks," so what they offer looks mundane, boring. Alan thinks the fabrics make a look when, in fact, it's the application that makes a look.
- Inventory risk—by offering a domestic line and warehousing the product.
What Was Learned from Watching Their Operation
Competitor #2 controls the design and manufacture process from beginning to end, so they are able to control costs. (However, John can accomplish the same thing with close working relationships.)
Competitor #3
Who They Are
Competitor #3 designs and manufactures Christmas and holiday items for Halloween, Christmas, Valentine's, and Easter as well as home textile products. The family-owned company is based in Mumbai, India, and has an office in New Jersey. It has been exporting its products for more than 15 years. Exports are estimated to be $20 million annually.
Products
Product categories include: tree skirts, stockings, mantel scarves, table linens, gift bags, napkin rings, kitchen textiles, bath, bedding, and window accessories. They have been building their Christmas and holiday business for the last three years.
Strengths
- Nice looking designs, but not fine-tuned for the western market (gaudy, overdone).
- Offices, showroom, and development room in India were very impressive.
- Very impressive operation; very organized and methodical, clean (rare in India), like offices in the U.S. Their research department has everything categorized and filed. Workflow, paperwork is very organized. The division of responsibilities is very thorough so nothing falls through the cracks.
Weaknesses
- Their factory is primitive, set up as a cottage industry
- No quality control
- Poor marketing skills
Competitor #4
Who They Are
Competitor #4 is the Christmas products division of a metallic yarn manufacturer based in Mumbai, India. Competitor #4 designs and manufactures Christmas-related products. The parent company has been in business since 1962, while Competitor #4 has been in business since 1999. Exports are estimated to be $2 million annually.
Products
Product categories include: tree skirts, stockings, wire-edged ribbon, table linens, table runners, and gift bags.
Strengths
- Incredible design talent for fabrics; great creativity.
- They have very good quality and nicely designed products, based on their samples; however, it's hard to tell whether that can be maintained in production.
- They have fabulous raw materials and know-how of handiwork techniques.
Weaknesses
- Their designs are not fully developed; they don't fully understand design concepts (creating a "look") or scale. They have no idea how to put their creativity to its best use.
- They do not have enough business to sustain a factory, so they outsource by using a cottage industry setup.
- Poor marketing skills.
What Was Learned from Watching Their Operation
They have an operation with wonderful potential. Burton Décor would like to take them over.
MANAGEMENT
History of Principals
John Smith has put together a team with years of industry-specific experience and demonstrated talent. The professionals listed below cover the four functional areas critical to Burton Décor's success:
- design and product development
- management
- manufacturing
- sales
John Smith —John is a seasoned design and retailing professional with more than 20 years of experience. His educational background includes degrees in both retail management and interior design. His professional experience includes:
- Product development for Tuppi, including design, international sourcing and production
- Department store and specialty store retailing for 10 years
- Interior design for 10 years
John's product development experience encompasses the process from start to finish, i.e., from putting the design on paper to production to packaging to putting it on a retailer's shelves. In addition, he has successfully managed a staff of 10 and regularly managed multiple time-sensitive projects simultaneously.
Bob Davidson —Bob and his family own and run three factories in Nepal and India. Their manufacturing experience dates back to 1974. Bob has substantial experience in managing both the manufacturing and exporting functions of their businesses in India, most recently for Octagon Textile Industries. Prior to that he managed production and quality control for a division of Mip Plastic Industries.
Bob's factories have been exporting garments and textiles to the U.S. since 1989. They provide in-house product development and research facilities for their production and marketing, and they maintain consistent quality control and sound financial practices. Their factories are experienced in working with top U.S. retailers such as Wal-Mart and Kmart. All their factories meet international standards and U.S. regulations.
Bob has a bachelor's in Commerce degree from Bombay University, and spent an additional year studying Business Administration at the International University of America in San Francisco, California.
Jane Doe —Jane has more than 15 years of product design, graphic arts, and supervisory experience. Specifically, she has 15 years of computer design experience; 20 years of traditional design, rendering, and illustration experience; and 15 years of experience working with overseas vendors in Europe, Asia, and India in producing graphics and products.
Jane has built in-house product design and graphics departments for three companies. In addition, her professional experience includes:
- Product Design: Giftware/collectibles/decorative, tins/bath and body/pet; gifts/decorative design/seasonal and holiday items/leather (and fabric) goods, e.g., business cases, men's accessories, luggage, and gift items.
- Graphic Design: Graphics incorporated with product, package design, decorative design, catalog, and photography. Concept, design, and production for products, packaging, and graphics.
- Management: Supervised designers, retouchers, and freelancers. Managed employees, workflow, clients, and budgets for graphics/multimedia studios consisting of 12-15 employees.
PERSONNEL
Management Team
John Smith, CEO —John will oversee the sales and design functions of Burton Décor. He will work directly with the factories and the agent in India by overseeing their performance and negotiating the first cost of the products. Until a CFO can be hired, John will also handle all financial issues. Salary: $130,000.
Bob Davidson, Agent —Bob will be Burton Décor's primary contact and agent in India, and Bob's factory will be the primary manufacturer of Burton Décor products. He will oversee production at his factory and the outside factories by monitoring and coordinating production, quality control, packaging, customs paperwork, and transportation until the release of goods at the port. Salary: Compensation will be included in Burton Décor's cost of goods sold (first cost).
Jane Doe, Vice President of Design —Jane will be responsible for all graphic design and product development, i.e., packaging, presentations to buyers, as well as the Burton Décor showroom display. Jane will handle the product lines from conception through packaging, which includes developing themes and keeping abreast of marketplace trends. Long-term, Jane will build and manage the art department, including in-house and freelance artists. Salary: $80,000 + bonus.
Elizabeth Brown, Vice President of Sales: Elizabeth will be responsible for developing the marketing plan to meet sales objectives, as well as establishing/maintaining customer relationships. Elizabeth will make initial contact with buyers, handle day-to-day contact and follow-up with buyers, i.e., she will manage the process from the time the order is placed to the time the merchandise is off the retailer's shelves. Long-term, Elizabeth will build and manage the sales department, including outside sales reps. Salary: $80,000 + bonus.
Additional Personnel
Office Manager: Reports to VP of Design. Responsible for day-to-day office operations; will assist CEO and VP of Design. Must be highly organized and have the ability to multi-task. Attention to detail a must. Salary: $50,000.
Graphic Designer: Reports to VP of Design. Responsible for designing packaging for each product as well as for private label merchandise. Must be fluent in design software for the Mac, excel in conceptual design, and have experience in marketing trends and working with overseas vendors. Experience also required in working on product/decorative design and working with printers and production files. Salary: $40,000.
Artist: Reports to VP of Design. Responsible for conceiving, designing, and producing artwork for home décor and Christmas product lines. Must be fluent in design software for the Mac, excel in conceptual design, and have experience in marketing trends and working with overseas vendors. Experience also required in working on product/decorative design and working with printers and production files. Salary: $30,000.
Import Manager: Reports to VP of Sales. Responsible for building product database, putting together price quotes for buyers, issuing purchase orders and following through on sales, delivery, and payment approval. Must be highly organized and have the ability to multi-task. Attention to detail a must. Salary: $30,000.
Sales Assistant: Reports to VP of Sales. Responsible for supporting Sales Department. Must be highly organized and have the ability to multi-task. Attention to detail a must. Salary: $28,000.
Order Expediter: Reports to Import Manager. Responsible for assisting in putting together price quotes for buyers, issuing purchase orders, and following through on sales and delivery. Must be highly organized and have the ability to multi-task. Attention to detail a must. Salary: $25,000.
Staffing Plan
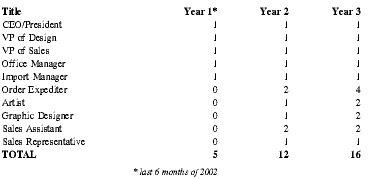
| Title | Year 1* | Year 2 | Year 3 |
| * last 6 months of 2002 | |||
| CEO/President | 1 | 1 | 1 |
| VP of Design | 1 | 1 | 1 |
| VP of Sales | 1 | 1 | 1 |
| Office Manager | 1 | 1 | 1 |
| Import Manager | 1 | 1 | 1 |
| Order Expediter | 0 | 2 | 4 |
| Artist | 0 | 1 | 2 |
| Graphic Designer | 0 | 1 | 2 |
| Sales Assistant | 0 | 2 | 2 |
| Sales Representative | 0 | 1 | 1 |
| TOTAL | 5 | 12 | 16 |
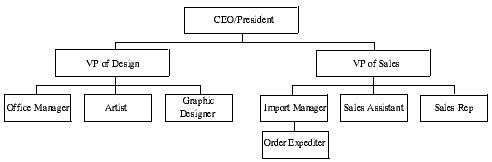
Organization Chart
CEO/President
VP of Design VP of Sales
Office Manager Artist
Graphic Designer Import Manager Sales Assistant Sales Rep
Order Expediter
Human Resources Administration
Burton Décor will outsource the human resources administration function to a Professional Employer Organization ("PEO"). A PEO provides cost effective HR management and administration, and takes on the related employment risks of its clients. Through an operating agreement, the PEO and Burton Décor will create a co-employer relationship between them in reference to their co-employees. Thus, the PEO establishes itself as the "employer of record," responsible for administrative functions associated with the employment of co-employees, while the client is established as the "workplace employer," responsible for directing the manner in which co-employees deliver their work efforts, as well as hiring, disciplining, compensating, reviewing, and terminating such co-employees. More specifically, the PEO will:
- Pay wages, employment taxes, and benefits expenses out of its own accounts
- Report, collect, and deposit employment taxes with State and Federal authorities
In addition, the PEO will act as negotiating agent for Burton Décor in order to secure an attractive employee benefit plan, including some or all of the following benefits: medical, dental, life and long-term disability insurance, 401(k) plan, Section 125 cafeteria plan, and employee assistance plan.
By using a PEO, growing companies such as Burton Décor are able to capitalize on economies-of-scale and offer their employees significantly better benefits—typically equal to those of larger corporations, but at a price a smaller firm can afford. This is particularly important when trying to attract the most qualified and talented employees.
The end result is that a PEO removes the majority of employer-related paperwork from Burton Décor's desk, eliminates the time it takes to shop around for benefits packages, and helps reduce Burton Décor's liabilities by assuming and/or sharing some of the liabilities of being an employer.
APPLICATION & EXPECTED EFFECT OF INVESTMENT
Burton Décor is seeking a $650,000 loan and a $650,000 credit line. The funds will allow Burton Décor to:
- Build its management team and personnel infrastructure
- Design, sell, and produce its products for Burton Décor's first selling season
- Purchase the required computer hardware, software, and office equipment
- Set up its office and showroom space
The loan will allow Burton Décor to establish itself in its first selling season. Burton Décor is paid only when the merchant takes possession of the goods at the port in India. The sales cycle—the time from product design to the merchant taking possession—can be as long as twelve months. As such, the loan will enable Burton Décor to make the necessary up-front investment. The credit line will allow Burton Décor to pay off the loan and accommodate the sales cycle on a ongoing basis. Cash flow projections illustrate that the loan is scheduled to be repaid in the third quarter of Year 3.
FINANCIAL DATA
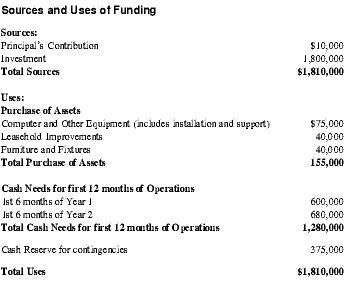
| Sources: | |
| Principal's Contribution | $10,000 |
| Investment | 1,800,000 |
| Total Sources | $1,810,000 |
| Uses: | |
| Purchase of Assets | |
| Computer and Other Equipment (includes installation and support) | $75,000 |
| Leasehold Improvements | 40,000 |
| Furniture and Fixtures | 40,000 |
| Total Purchase of Assets | 155,000 |
| Cash Needs for first 12 months of Operations | |
| 1st 6 months of Year 1 | 600,000 |
| 1st 6 months of Year 2 | 680,000 |
| Total Cash Needs for first 12 months of Operations | 1,280,000 |
| Cash Reserve for contingencies | 375,000 |
| Total Uses | $1,810,000 |
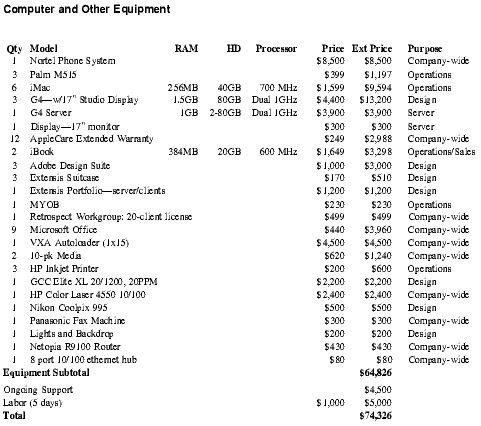
| Qty | Model | RAM | HD | Processor | Price | Ext Price | Purpose |
| 1 | Nortel Phone System | $8,500 | $8,500 | Company-wide | |||
| 3 | Palm M515 | $399 | $1,197 | Operations | |||
| 6 | iMac | 256MB | 40GB | 700 MHz | $1,599 | $9,594 | Operations |
| 3 | G4—w/17" Studio Display | 1.5GB | 80GB | Dual 1GHz | $4,400 | $13,200 | Design |
| 1 | G4 Server | 1GB | 2-80GB | Dual 1GHz | $3,900 | $3,900 | Server |
| 1 | Display—17" monitor | $300 | $300 | Server | |||
| 12 | AppleCare Extended Warranty | $249 | $2,988 | Company-wide | |||
| 2 | iBook | 384MB | 20GB | 600 MHz | $1,649 | $3,298 | Operations/Sales |
| 3 | Adobe Design Suite | $1,000 | $3,000 | Design | |||
| 3 | Extensis Suitcase | $170 | $510 | Design | |||
| 1 | Extensis Portfolio—server/clients | $1,200 | $1,200 | Design | |||
| 1 | MYOB | $230 | $230 | Operations | |||
| 1 | Retrospect Workgroup: 20-client license | $499 | $499 | Company-wide | |||
| 9 | Microsoft Office | $440 | $3,960 | Company-wide | |||
| 1 | VXA Autoloader (1x15) | $4,500 | $4,500 | Company-wide | |||
| 2 | 10-pk Media | $620 | $1,240 | Company-wide | |||
| 3 | HP Inkjet Printer | $200 | $600 | Operations | |||
| 1 | GCC Elite XL 20/1200, 20PPM | $2,200 | $2,200 | Design | |||
| 1 | HP Color Laser 4550 10/100 | $2,400 | $2,400 | Company-wide | |||
| 1 | Nikon Coolpix 995 | $500 | $500 | Design | |||
| 1 | Panasonic Fax Machine | $300 | $300 | Company-wide | |||
| 1 | Lights and Backdrop | $200 | $200 | Design | |||
| 1 | Netopia R9100 Router | $430 | $430 | Company-wide | |||
| 1 | 8 port 10/100 ethernet hub | $80 | $80 | Company-wide | |||
| Equipment Subtotal | $64,826 | ||||||
| Ongoing Support | $4,500 | ||||||
| Labor (5 days) | $1,000 | $5,000 | |||||
| Total | $74,326 | ||||||
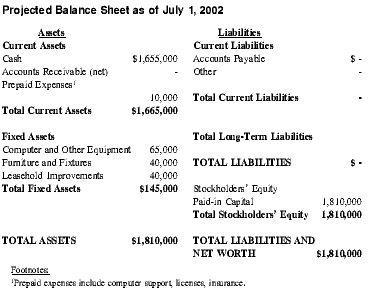
| Assets | Liabilities | ||
| Footnotes: | |||
| 1 Prepaid expenses include computer support, licenses, insurance. | |||
| Current Assets | Current Liabilities | ||
| Cash | $1,655,000 | Accounts Payable | $ - |
| Accounts Receivable (net) | - | Other | - |
| Prepaid Expenses 1 | |||
| 10,000 | Total Current Liabilities | - | |
| Total Current Assets | $1,665,000 | ||
| Fixed Assets | Total Long-Term Liabilities | ||
| Computer and Other Equipment | 65,000 | ||
| Furniture and Fixtures | 40,000 | TOTAL LIABILITIES | $ - |
| Leasehold Improvements | 40,000 | ||
| Total Fixed Assets | $145,000 | Stockholders' Equity | |
| Paid-in Capital | 1,810,000 | ||
| Total Stockholders' Equity | 1,810,000 | ||
| TOTAL ASSETS | $1,810,000 | TOTAL LIABILITIES AND NET WORTH | $1,810,000 |
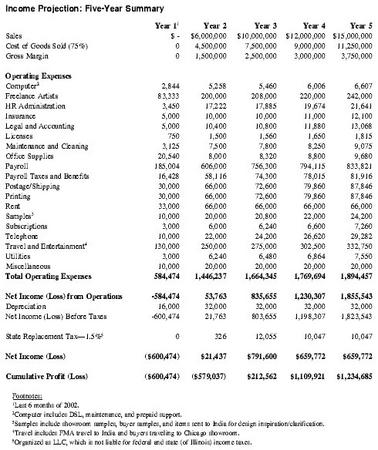
| Year 1 1 | Year 2 | Year 3 | Year 4 | Year 5 | |
| Footnotes: | |||||
| 1 Last 6 months of 2002. | |||||
| 2 Computer includes DSL, maintenance, and prepaid support. | |||||
| 3 Samples include showroom samples, buyer samples, and items sent to India for design inspiration/clarification. | |||||
| 4 Travel includes FMA travel to India and buyers traveling to Chicago showroom. | |||||
| 5 Organized as LLC, which is not liable for federal and state (of Illinois) income taxes. | |||||
| Sales | $ - | $6,000,000 | $10,000,000 | $12,000,000 | $15,000,000 |
| Cost of Goods Sold (75%) | 0 | 4,500,000 | 7,500,000 | 9,000,000 | 11,250,000 |
| Gross Margin | 0 | 1,500,000 | 2,500,000 | 3,000,000 | 3,750,000 |
| Operating Expenses | |||||
| Computer 2 | 2,844 | 5,258 | 5,460 | 6,006 | 6,607 |
| Freelance Artists | 83,333 | 200,000 | 208,000 | 220,000 | 242,000 |
| HR Administration | 3,450 | 17,222 | 17,885 | 19,674 | 21,641 |
| Insurance | 5,000 | 10,000 | 10,000 | 11,000 | 12,100 |
| Legal and Accounting | 5,000 | 10,400 | 10,800 | 11,880 | 13,068 |
| Licenses | 750 | 1,500 | 1,560 | 1,650 | 1,815 |
| Maintenance and Cleaning | 3,125 | 7,500 | 7,800 | 8,250 | 9,075 |
| Office Supplies | 20,540 | 8,000 | 8,320 | 8,800 | 9,680 |
| Payroll | 185,004 | 606,000 | 756,300 | 794,115 | 833,821 |
| Payroll Taxes and Benefits | 16,428 | 58,116 | 74,300 | 78,015 | 81,916 |
| Postage/Shipping | 30,000 | 66,000 | 72,600 | 79,860 | 87,846 |
| Printing | 30,000 | 66,000 | 72,600 | 79,860 | 87,846 |
| Rent | 33,000 | 66,000 | 66,000 | 66,000 | 66,000 |
| Samples 3 | 10,000 | 20,000 | 20,800 | 22,000 | 24,200 |
| Subscriptions | 3,000 | 6,000 | 6,240 | 6,600 | 7,260 |
| Telephone | 10,000 | 22,000 | 24,200 | 26,620 | 29,282 |
| Travel and Entertainment 4 | 130,000 | 250,000 | 275,000 | 302,500 | 332,750 |
| Utilities | 3,000 | 6,240 | 6,480 | 6,864 | 7,550 |
| Miscellaneous | 10,000 | 20,000 | 20,000 | 20,000 | 20,000 |
| Total Operating Expenses | 584,474 | 1,446,237 | 1,664,345 | 1,769,694 | 1,894,457 |
| Net Income (Loss) from Operations | -584,474 | 53,763 | 835,655 | 1,230,307 | 1,855,543 |
| Depreciation | 16,000 | 32,000 | 32,000 | 32,000 | 32,000 |
| Net Income (Loss) Before Taxes | -600,474 | 21,763 | 803,655 | 1,198,307 | 1,823,543 |
| State Replacement Tax—1.5% 5 | 0 | 326 | 12,055 | 10,047 | 10,047 |
| Net Income (Loss) | ($600,474) | $21,437 | $791,600 | $659,772 | $659,772 |
| Cumulative Profit (Loss) | ($600,474) | ($579,037) | $212,562 | $1,109,921 | $1,234,685 |
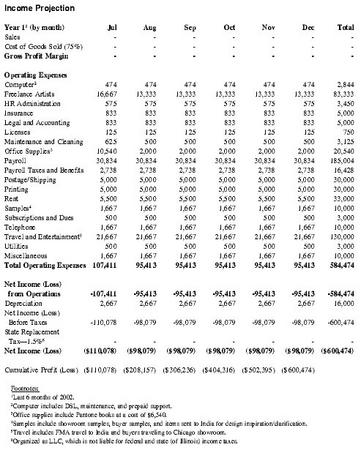
| Year 1 1 (by month) | Jul | Aug | Sep | Oct | Nov | Dec | Total |
| Footnotes: | |||||||
| 1 Last 6 months of 2002. | |||||||
| 2 Computer includes DSL, maintenance, and prepaid support. | |||||||
| 3 Office supplies include Pantone books at a cost of $6,540. | |||||||
| 4 Samples include showroom samples, buyer samples, and items sent to India for design inspiration/clarification. | |||||||
| 5 Travel includes FMA travel to India and buyers traveling to Chicago showroom. | |||||||
| 6 Organized as LLC, which is not liable for federal and state (of Illinois) income taxes. | |||||||
| Sales | - | - | - | - | - | - | - |
| Cost of Goods Sold (75%) | - | - | - | - | - | - | - |
| Gross Profit Margin | - | - | - | - | - | - | - |
| Operating Expenses | |||||||
| Computer 2 | 474 | 474 | 474 | 474 | 474 | 474 | 2,844 |
| Freelance Artists | 16,667 | 13,333 | 13,333 | 13,333 | 13,333 | 13,333 | 83,333 |
| HR Administration | 575 | 575 | 575 | 575 | 575 | 575 | 3,450 |
| Insurance | 833 | 833 | 833 | 833 | 833 | 833 | 5,000 |
| Legal and Accounting | 833 | 833 | 833 | 833 | 833 | 833 | 5,000 |
| Licenses | 125 | 125 | 125 | 125 | 125 | 125 | 750 |
| Maintenance and Cleaning | 625 | 500 | 500 | 500 | 500 | 500 | 3,125 |
| Office Supplies 3 | 10,540 | 2,000 | 2,000 | 2,000 | 2,000 | 2,000 | 20,540 |
| Payroll | 30,834 | 30,834 | 30,834 | 30,834 | 30,834 | 30,834 | 185,004 |
| Payroll Taxes and Benefits | 2,738 | 2,738 | 2,738 | 2,738 | 2,738 | 2,738 | 16,428 |
| Postage/Shipping | 5,000 | 5,000 | 5,000 | 5,000 | 5,000 | 5,000 | 30,000 |
| Printing | 5,000 | 5,000 | 5,000 | 5,000 | 5,000 | 5,000 | 30,000 |
| Rent | 5,500 | 5,500 | 5,500 | 5,500 | 5,500 | 5,500 | 33,000 |
| Samples 4 | 1,667 | 1,667 | 1,667 | 1,667 | 1,667 | 1,667 | 10,000 |
| Subscriptions and Dues | 500 | 500 | 500 | 500 | 500 | 500 | 3,000 |
| Telephone | 1,667 | 1,667 | 1,667 | 1,667 | 1,667 | 1,667 | 10,000 |
| Travel and Entertainment 5 | 21,667 | 21,667 | 21,667 | 21,667 | 21,667 | 21,667 | 130,000 |
| Utilities | 500 | 500 | 500 | 500 | 500 | 500 | 3,000 |
| Miscellaneous | 1,667 | 1,667 | 1,667 | 1,667 | 1,667 | 1,667 | 10,000 |
| Total Operating Expenses | 107,411 | 95,413 | 95,413 | 95,413 | 95,413 | 95,413 | 584,474 |
| Net Income (Loss) from Operations | -107,411 | -95,413 | -95,413 | -95,413 | -95,413 | -95,413 | -584,474 |
| Depreciation | 2,667 | 2,667 | 2,667 | 2,667 | 2,667 | 2,667 | 16,000 |
| Net Income (Loss) Before Taxes | -110,078 | -98,079 | -98,079 | -98,079 | -98,079 | -98,079 | -600,474 |
| State Replacement Tax—1.5% 6 | - | - | - | - | - | - | - |
| Net Income (Loss) | ($110,078) | ($98,079) | ($98,079) | ($98,079) | ($98,079) | ($98,079) | ($600,474) |
| Cumulative Profit (Loss) | ($110,078) | ($208,157) | ($306,236) | ($404,316) | ($502,395) | ($600,474) | |
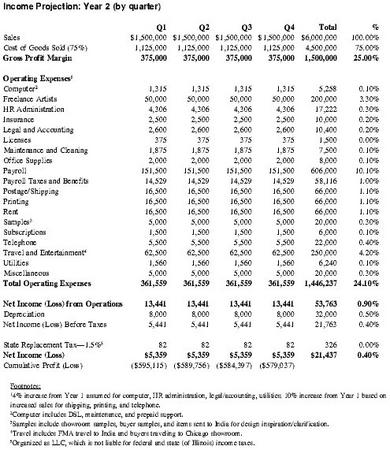
| Q1 | Q2 | Q3 | Q4 | Total | % | |
| Footnotes: | ||||||
| 1 4% increase from Year 1 assumed for computer, HR administration, legal/accounting, utilities; 10% increase from Year 1 based on increased sales for shipping, printing, and telephone. | ||||||
| 2 Computer includes DSL, maintenance, and prepaid support. | ||||||
| 3 Samples include showroom samples, buyer samples, and items sent to India for design inspiration/clarification. | ||||||
| 4 Travel includes FMA travel to India and buyers traveling to Chicago showroom. | ||||||
| 5 Organized as LLC, which is not liable for federal and state (of Illinois) income taxes. | ||||||
| Sales | $1,500,000 | $1,500,000 | $1,500,000 | $1,500,000 | $6,000,000 | 100.00% |
| Cost of Goods Sold (75%) | 1,125,000 | 1,125,000 | 1,125,000 | 1,125,000 | 4,500,000 | 75.00% |
| Gross Profit Margin | 375,000 | 375,000 | 375,000 | 375,000 | 1,500,000 | 25.00% |
| Operating Expenses 1 | ||||||
| Computer 2 | 1,315 | 1,315 | 1,315 | 1,315 | 5,258 | 0.10% |
| Freelance Artists | 50,000 | 50,000 | 50,000 | 50,000 | 200,000 | 3.30% |
| HR Administration | 4,306 | 4,306 | 4,306 | 4,306 | 17,222 | 0.30% |
| Insurance | 2,500 | 2,500 | 2,500 | 2,500 | 10,000 | 0.20% |
| Legal and Accounting | 2,600 | 2,600 | 2,600 | 2,600 | 10,400 | 0.20% |
| Licenses | 375 | 375 | 375 | 375 | 1,500 | 0.00% |
| Maintenance and Cleaning | 1,875 | 1,875 | 1,875 | 1,875 | 7,500 | 0.10% |
| Office Supplies | 2,000 | 2,000 | 2,000 | 2,000 | 8,000 | 0.10% |
| Payroll | 151,500 | 151,500 | 151,500 | 151,500 | 606,000 | 10.10% |
| Payroll Taxes and Benefits | 14,529 | 14,529 | 14,529 | 14,529 | 58,116 | 1.00% |
| Postage/Shipping | 16,500 | 16,500 | 16,500 | 16,500 | 66,000 | 1.10% |
| Printing | 16,500 | 16,500 | 16,500 | 16,500 | 66,000 | 1.10% |
| Rent | 16,500 | 16,500 | 16,500 | 16,500 | 66,000 | 1.10% |
| Samples 3 | 5,000 | 5,000 | 5,000 | 5,000 | 20,000 | 0.30% |
| Subscriptions | 1,500 | 1,500 | 1,500 | 1,500 | 6,000 | 0.10% |
| Telephone | 5,500 | 5,500 | 5,500 | 5,500 | 22,000 | 0.40% |
| Travel and Entertainment 4 | 62,500 | 62,500 | 62,500 | 62,500 | 250,000 | 4.20% |
| Utilities | 1,560 | 1,560 | 1,560 | 1,560 | 6,240 | 0.10% |
| Miscellaneous | 5,000 | 5,000 | 5,000 | 5,000 | 20,000 | 0.30% |
| Total Operating Expenses | 361,559 | 361,559 | 361,559 | 361,559 | 1,446,237 | 24.10% |
| Net Income (Loss) from Operations | 13,441 | 13,441 | 13,441 | 13,441 | 53,763 | 0.90% |
| Depreciation | 8,000 | 8,000 | 8,000 | 8,000 | 32,000 | 0.50% |
| Net Income (Loss) Before Taxes | 5,441 | 5,441 | 5,441 | 5,441 | 21,763 | 0.40% |
| State Replacement Tax—1.5% 5 | 82 | 82 | 82 | 82 | 326 | 0.00% |
| Net Income (Loss) | $5,359 | $5,359 | $5,359 | $5,359 | $21,437 | 0.40% |
| Cumulative Profit (Loss) | ($595,115) | ($589,756) | ($584,397) | ($579,037) | ||
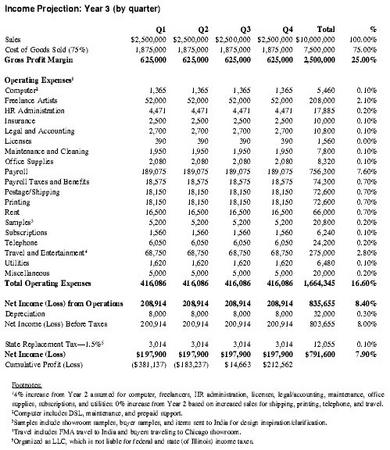
| Q1 | Q2 | Q3 | Q4 | Total | % | |
| Footnotes: | ||||||
| 1 4% increase from Year 2 assumed for computer, freelancers, HR administration, licenses, legal/accounting, maintenance, office supplies, subscriptions, and utilities; 0% increase from Year 2 based on increased sales for shipping, printing, telephone, and travel. | ||||||
| 2 Computer includes DSL, maintenance, and prepaid support. | ||||||
| 3 Samples include showroom samples, buyer samples, and items sent to India for design inspiration/clarification. | ||||||
| 4 Travel includes FMA travel to India and buyers traveling to Chicago showroom. | ||||||
| 5 Organized as LLC, which is not liable for federal and state (of Illinois) income taxes. | ||||||
| Sales | $2,500,000 | $2,500,000 | $2,500,000 | $2,500,000 | $10,000,000 | 100.00% |
| Cost of Goods Sold (75%) | 1,875,000 | 1,875,000 | 1,875,000 | 1,875,000 | 7,500,000 | 75.00% |
| Gross Profit Margin | 625,000 | 625,000 | 625,000 | 625,000 | 2,500,000 | 25.00% |
| Operating Expenses 1 | ||||||
| Computer 2 | 1,365 | 1,365 | 1,365 | 1,365 | 5,460 | 0.10% |
| Freelance Artists | 52,000 | 52,000 | 52,000 | 52,000 | 208,000 | 2.10% |
| HR Administration | 4,471 | 4,471 | 4,471 | 4,471 | 17,885 | 0.20% |
| Insurance | 2,500 | 2,500 | 2,500 | 2,500 | 10,000 | 0.10% |
| Legal and Accounting | 2,700 | 2,700 | 2,700 | 2,700 | 10,800 | 0.10% |
| Licenses | 390 | 390 | 390 | 390 | 1,560 | 0.00% |
| Maintenance and Cleaning | 1,950 | 1,950 | 1,950 | 1,950 | 7,800 | 0.10% |
| Office Supplies | 2,080 | 2,080 | 2,080 | 2,080 | 8,320 | 0.10% |
| Payroll | 189,075 | 189,075 | 189,075 | 189,075 | 756,300 | 7.60% |
| Payroll Taxes and Benefits | 18,575 | 18,575 | 18,575 | 18,575 | 74,300 | 0.70% |
| Postage/Shipping | 18,150 | 18,150 | 18,150 | 18,150 | 72,600 | 0.70% |
| Printing | 18,150 | 18,150 | 18,150 | 18,150 | 72,600 | 0.70% |
| Rent | 16,500 | 16,500 | 16,500 | 16,500 | 66,000 | 0.70% |
| Samples 3 | 5,200 | 5,200 | 5,200 | 5,200 | 20,800 | 0.20% |
| Subscriptions | 1,560 | 1,560 | 1,560 | 1,560 | 6,240 | 0.10% |
| Telephone | 6,050 | 6,050 | 6,050 | 6,050 | 24,200 | 0.20% |
| Travel and Entertainment 4 | 68,750 | 68,750 | 68,750 | 68,750 | 275,000 | 2.80% |
| Utilities | 1,620 | 1,620 | 1,620 | 1,620 | 6,480 | 0.10% |
| Miscellaneous | 5,000 | 5,000 | 5,000 | 5,000 | 20,000 | 0.20% |
| Total Operating Expenses | 416,086 | 416,086 | 416,086 | 416,086 | 1,664,345 | 16.60% |
| Net Income (Loss) from Operations | 208,914 | 208,914 | 208,914 | 208,914 | 835,655 | 8.40% |
| Depreciation | 8,000 | 8,000 | 8,000 | 8,000 | 32,000 | 0.30% |
| Net Income (Loss) Before Taxes | 200,914 | 200,914 | 200,914 | 200,914 | 803,655 | 8.00% |
| State Replacement Tax—1.5% 5 | 3,014 | 3,014 | 3,014 | 3,014 | 12,055 | 0.10% |
| Net Income (Loss) | $197,900 | $197,900 | $197,900 | $197,900 | $791,600 | 7.90% |
| Cumulative Profit (Loss) | ($381,137) | ($183,237) | $14,663 | $212,562 | ||
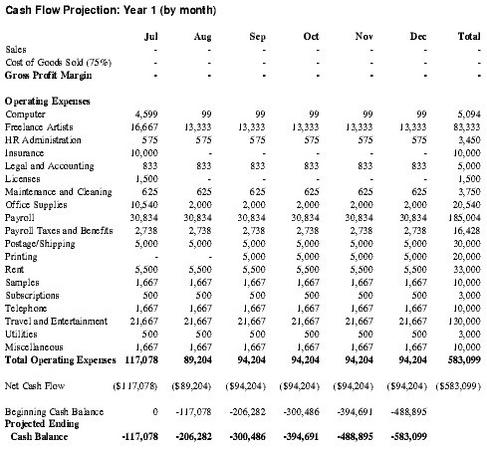
| Jul | Aug | Sep | Oct | Nov | Dec | Total | ||
| Sales | - | - | - | - | - | - | - | |
| Cost of Goods Sold (75%) | - | - | - | - | - | - | - | |
| Gross Profit Margin | - | - | - | - | - | - | - | |
| Operating Expenses | ||||||||
| Computer | 4,599 | 99 | 99 | 99 | 99 | 99 | 5,094 | |
| Freelance Artists | 16,667 | 13,333 | 13,333 | 13,333 | 13,333 | 13,333 | 83,333 | |
| HR Administration | 575 | 575 | 575 | 575 | 575 | 575 | 3,450 | |
| Insurance | 10,000 | - | - | - | - | - | 10,000 | |
| Legal and Accounting | 833 | 833 | 833 | 833 | 833 | 833 | 5,000 | |
| Licenses | 1,500 | - | - | - | - | - | 1,500 | |
| Maintenance and Cleaning | 625 | 625 | 625 | 625 | 625 | 625 | 3,750 | |
| Office Supplies | 10,540 | 2,000 | 2,000 | 2,000 | 2,000 | 2,000 | 20,540 | |
| Payroll | 30,834 | 30,834 | 30,834 | 30,834 | 30,834 | 30,834 | 185,004 | |
| Payroll Taxes and Benefits | 2,738 | 2,738 | 2,738 | 2,738 | 2,738 | 2,738 | 16,428 | |
| Postage/Shipping | 5,000 | 5,000 | 5,000 | 5,000 | 5,000 | 5,000 | 30,000 | |
| Printing | - | - | 5,000 | 5,000 | 5,000 | 5,000 | 20,000 | |
| Rent | 5,500 | 5,500 | 5,500 | 5,500 | 5,500 | 5,500 | 33,000 | |
| Samples | 1,667 | 1,667 | 1,667 | 1,667 | 1,667 | 1,667 | 10,000 | |
| Subscriptions | 500 | 500 | 500 | 500 | 500 | 500 | 3,000 | |
| Telephone | 1,667 | 1,667 | 1,667 | 1,667 | 1,667 | 1,667 | 10,000 | |
| Travel and Entertainment | 21,667 | 21,667 | 21,667 | 21,667 | 21,667 | 21,667 | 130,000 | |
| Utilities | 500 | 500 | 500 | 500 | 500 | 500 | 3,000 | |
| Miscellaneous | 1,667 | 1,667 | 1,667 | 1,667 | 1,667 | 1,667 | 10,000 | |
| Total Operating Expenses | 117,078 | 89,204 | 94,204 | 94,204 | 94,204 | 94,204 | 583,099 | |
| Net Cash Flow | ($117,078) | ($89,204) | ($94,204) | ($94,204) | ($94,204) | ($94,204) | ($583,099) | |
| Beginning Cash Balance | 0 | -117,078 | -206,282 | -300,486 | -394,691 | -488,895 | ||
| Projected Ending Cash Balance | -117,078 | -206,282 | -300,486 | -394,691 | -488,895 | -583,099 | ||
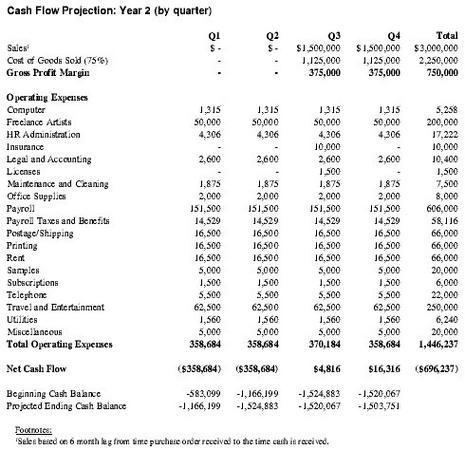
| Q1 | Q2 | Q3 | Q4 | Total | |
| Footnotes: | |||||
| 1 Sales based on 6 month lag from time purchase order received to the time cash is received. | |||||
| Sales 1 | $ - | $ - | $1,500,000 | $1,500,000 | $3,000,000 |
| Cost of Goods Sold (75%) | - | - | 1,125,000 | 1,125,000 | 2,250,000 |
| Gross Profit Margin | - | - | 375,000 | 375,000 | 750,000 |
| Operating Expenses | |||||
| Computer | 1,315 | 1,315 | 1,315 | 1,315 | 5,258 |
| Freelance Artists | 50,000 | 50,000 | 50,000 | 50,000 | 200,000 |
| HR Administration | 4,306 | 4,306 | 4,306 | 4,306 | 17,222 |
| Insurance | - | - | 10,000 | - | 10,000 |
| Legal and Accounting | 2,600 | 2,600 | 2,600 | 2,600 | 10,400 |
| Licenses | - | - | 1,500 | - | 1,500 |
| Maintenance and Cleaning | 1,875 | 1,875 | 1,875 | 1,875 | 7,500 |
| Office Supplies | 2,000 | 2,000 | 2,000 | 2,000 | 8,000 |
| Payroll | 151,500 | 151,500 | 151,500 | 151,500 | 606,000 |
| Payroll Taxes and Benefits | 14,529 | 14,529 | 14,529 | 14,529 | 58,116 |
| Postage/Shipping | 16,500 | 16,500 | 16,500 | 16,500 | 66,000 |
| Printing | 16,500 | 16,500 | 16,500 | 16,500 | 66,000 |
| Rent | 16,500 | 16,500 | 16,500 | 16,500 | 66,000 |
| Samples | 5,000 | 5,000 | 5,000 | 5,000 | 20,000 |
| Subscriptions | 1,500 | 1,500 | 1,500 | 1,500 | 6,000 |
| Telephone | 5,500 | 5,500 | 5,500 | 5,500 | 22,000 |
| Travel and Entertainment | 62,500 | 62,500 | 62,500 | 62,500 | 250,000 |
| Utilities | 1,560 | 1,560 | 1,560 | 1,560 | 6,240 |
| Miscellaneous | 5,000 | 5,000 | 5,000 | 5,000 | 20,000 |
| Total Operating Expenses | 358,684 | 358,684 | 370,184 | 358,684 | 1,446,237 |
| Net Cash Flow | ($358,684) | ($358,684) | $4,816 | $16,316 | ($696,237) |
| Beginning Cash Balance | -583,099 | -1,166,199 | -1,524,883 | -1,520,067 | |
| Projected Ending Cash Balance | -1,166,199 | -1,524,883 | -1,520,067 | -1,503,751 | |
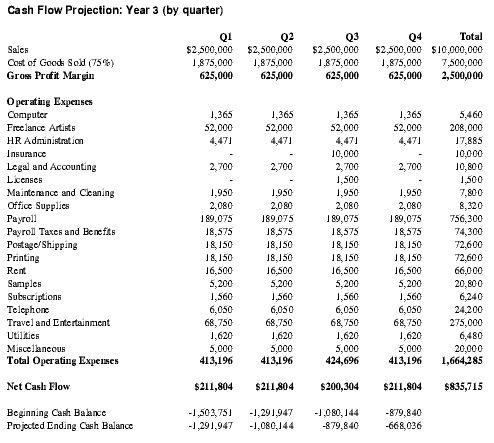
| Q1 | Q2 | Q3 | Q4 | Total | |
| Sales | $2,500,000 | $2,500,000 | $2,500,000 | $2,500,000 | $10,000,000 |
| Cost of Goods Sold (75%) | 1,875,000 | 1,875,000 | 1,875,000 | 1,875,000 | 7,500,000 |
| Gross Profit Margin | 625,000 | 625,000 | 625,000 | 625,000 | 2,500,000 |
| Operating Expenses | |||||
| Computer | 1,365 | 1,365 | 1,365 | 1,365 | 5,460 |
| Freelance Artists | 52,000 | 52,000 | 52,000 | 52,000 | 208,000 |
| HR Administration | 4,471 | 4,471 | 4,471 | 4,471 | 17,885 |
| Insurance | - | - | 10,000 | - | 10,000 |
| Legal and Accounting | 2,700 | 2,700 | 2,700 | 2,700 | 10,800 |
| Licenses | - | - | 1,500 | - | 1,500 |
| Maintenance and Cleaning | 1,950 | 1,950 | 1,950 | 1,950 | 7,800 |
| Office Supplies | 2,080 | 2,080 | 2,080 | 2,080 | 8,320 |
| Payroll | 189,075 | 189,075 | 189,075 | 189,075 | 756,300 |
| Payroll Taxes and Benefits | 18,575 | 18,575 | 18,575 | 18,575 | 74,300 |
| Postage/Shipping | 18,150 | 18,150 | 18,150 | 18,150 | 72,600 |
| Printing | 18,150 | 18,150 | 18,150 | 18,150 | 72,600 |
| Rent | 16,500 | 16,500 | 16,500 | 16,500 | 66,000 |
| Samples | 5,200 | 5,200 | 5,200 | 5,200 | 20,800 |
| Subscriptions | 1,560 | 1,560 | 1,560 | 1,560 | 6,240 |
| Telephone | 6,050 | 6,050 | 6,050 | 6,050 | 24,200 |
| Travel and Entertainment | 68,750 | 68,750 | 68,750 | 68,750 | 275,000 |
| Utilities | 1,620 | 1,620 | 1,620 | 1,620 | 6,480 |
| Miscellaneous | 5,000 | 5,000 | 5,000 | 5,000 | 20,000 |
| Total Operating Expenses | 413,196 | 413,196 | 424,696 | 413,196 | 1,664,285 |
| Net Cash Flow | $211,804 | $211,804 | $200,304 | $211,804 | $835,715 |
| Beginning Cash Balance | -1,503,751 | -1,291,947 | -1,080,144 | -879,840 | |
| Projected Ending Cash Balance | -1,291,947 | -1,080,144 | -879,840 | -668,036 | |
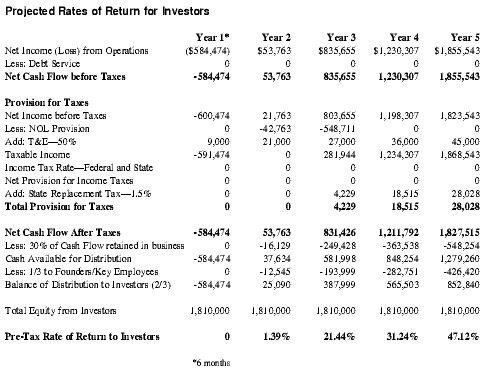
| Year 1* | Year 2 | Year 3 | Year 4 | Year 5 | |
| *6 months | |||||
| Net Income (Loss) from Operations | ($584,474) | $53,763 | $835,655 | $1,230,307 | $1,855,543 |
| Less: Debt Service | 0 | 0 | 0 | 0 | 0 |
| Net Cash Flow before Taxes | -584,474 | 53,763 | 835,655 | 1,230,307 | 1,855,543 |
| Provision for Taxes | |||||
| Net Income before Taxes | -600,474 | 21,763 | 803,655 | 1,198,307 | 1,823,543 |
| Less: NOL Provision | 0 | -42,763 | -548,711 | 0 | 0 |
| Add: T&E—50% | 9,000 | 21,000 | 27,000 | 36,000 | 45,000 |
| Taxable Income | -591,474 | 0 | 281,944 | 1,234,307 | 1,868,543 |
| Income Tax Rate—Federal and State | 0 | 0 | 0 | 0 | 0 |
| Net Provision for Income Taxes | 0 | 0 | 0 | 0 | 0 |
| Add: State Replacement Tax—1.5% | 0 | 0 | 4,229 | 18,515 | 28,028 |
| Total Provision for Taxes | 0 | 0 | 4,229 | 18,515 | 28,028 |
| Net Cash Flow After Taxes | -584,474 | 53,763 | 831,426 | 1,211,792 | 1,827,515 |
| Less: 30% of Cash Flow retained in | business 0 | -16,129 | -249,428 | -363,538 | -548,254 |
| Cash Available for Distribution | -584,474 | 37,634 | 581,998 | 848,254 | 1,279,260 |
| Less: 1/3 to Founders/Key Employees | 0 | -12,545 | -193,999 | -282,751 | -426,420 |
| Balance of Distribution to Investors (2/3) | -584,474 | 25,090 | 387,999 | 565,503 | 852,840 |
| Total Equity from Investors | 1,810,000 | 1,810,000 | 1,810,000 | 1,810,000 | 1,810,000 |
| Pre-Tax Rate of Return to Investors | 0 | 1.39% | 21.44% | 31.24% | 47.12% |
Comment about this article, ask questions, or add new information about this topic: