BREAK-EVEN ANALYSIS

Break-even analysis is used in cost accounting and capital budgeting to determine at what point a product or business is profitable. This analysis employs mathematical models, which may be very simple or highly complex, in order to understand the relations between the costs of doing business and the associated revenues. The object of break-even analysis is to learn or predict the minimum pricing and production levels at which a company will recover its costs and begin to profit. In addition to analyzing actual production levels, it may also be applied to production-related variables such as the break-even point for a given production capacity.
BASIC ANALYSIS
At its simplest, this analysis is used as its name suggests: to determine the volume of production at which a company's costs equal its revenues. Perhaps more useful than this simple determination, however, is the understanding gained through such analysis of the variable and fixed nature of certain costs. Break-even studies force the analyst to research, quantify, and categorize an entity's costs into fixed and variable groups.
The general formula for break-even analysis is
where
BEQ =
break-even quantity
FC =
fixed costs
P
= price per unit, and
VC =
variable costs per unit
EXAMPLE.
Assume a company sells Product X at $5.00 per unit. If its fixed costs,
those necessary in order to produce any of Product X, are $100.00 and its
variable costs per unit are $4.50, then its break-even quantity will be
Thus, before it begins making a profit, the company must sell 200 units of Product X at the given price level.
ADDITIONAL CONSIDERATIONS
This simple model is adequate for rough estimates, but it has two limitations when applied to the real world:
- Without incorporating more sophisticated market research that pinpoints the nature of demand for a product, the formula may yield a price/quantity combination that the market wouldn't support. Demand can be expected to fall as prices rise, and at high volumes the required production quantity may exceed the entire market for such a product at any price.
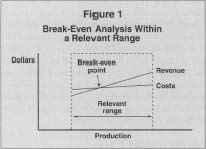
- Technically, in many real-world examples, the formulas describing cost and revenue are only valid for a limited range of output, and do not, as some graphical representations would suggest, extend from the zero point to infinity. It is important for analysts to understand the relevant range for their formulas, particularly when analyzing outcomes that are far different from the sample data on which the formulas are based. See Figure. 1 for an example of a break-even graph drawn within a relevant range.
Limitations may also result from interpreting costs and revenues as linear concepts, whereas in practice they might rise and fall at different rates for different levels of production and pricing. Graphically, this is expressed through curves. In other words, a more accurate measure of cost and revenue behavior would be a formula that results in curves rather than straight lines. Mathematically, it means the formula would be considerably more complex and would include at least one exponential expression.
While it may seem that a simple formula is wholly inadequate given its drawbacks, its power and utility lie in its ease of use, provided that decision makers also recognize its weaknesses. Indeed, someone who knows little about business or economics could with relative ease determine values for each variable and solve the formula for a break-even estimate.
More complex formulas may yield more definitive results, but determining market demand over a range of pricing options entails considerable research, as does calculating the nuances of rising production costs. To be highly accurate, such a formula would need to take into account a host of factors. For example, to determine how costs rise, the analyst might consider not only the costs of physical materials and production staff hours, but also differences in transportation costs, the added costs of customer service for a larger customer base, and so forth. Predicting customer demand would likely be even more involved. The result would be a fairly complex equation that is highly specific to the business under consideration; thus, there's no boilerplate formula for such calculations. In many cases of routine managerial decision making, it is probably not worth the investment of developing such a formula when a good, simple linear approximation is available.
RELATED APPLICATIONS
A key component of break-even analysis is the contribution margin, or the difference between price (P) and variable costs (VC). This is the amount of net income a company realizes from each unit, ignoring fixed (or "sunk") costs. The contribution margin concept is grounded in incremental or marginal analysis; its focus is the extra revenue and costs associated with each additional unit of production.
Break-even analysis can be used in several ways depending on which variable of the equation is being solved while the others are given. As it is presented, the simple formula solves for the number of units required to reach zero profits (and zero losses) given certain costs and the price. Alternatively, if given an assumed volume, price level, and variable cost structure, the maximum amount of fixed costs can be calculated. Or, given anticipated quantities and costs, the minimum selling price may be determined. However, as noted in the discussion of real world examples, any figures obtained from a formula must also be tested against actual market conditions—just because the formula says a company can break even producing candy bars at $100 each, there isn't necessarily a market for such items.
FURTHER READING:
Schweitzer, Marcell, et al. Break-Even Analyses: Basic Model, Variants, Extensions. New York: John Wiley & Sons, 1992.
Comment about this article, ask questions, or add new information about this topic: