EARNINGS FORECASTS
The forecasting of a company's earnings is important to a firm, its creditors, and its investors. The business usually prepares its annual earnings forecast as part of its budget process. The forecasting of earnings is extremely difficult since it is dependent on several variables.
In order to forecast a company's earnings, three major factors must be considered:
1. forecasted sales 2. the company's cost structure, and 3. the company's capital structure.
And, just to complicate matters, the numerical results of these considerations can be affected by the company's accounting policies.
SALES FORECASTS
The starting point in any forecast is sales. Forecasting sales is primary to earnings forecasts. Although management exerts some degree of control over expenditures, it has little ability to direct the buying habits of individuals; the level of sales depends of the vagaries of the marketplace. Yet, a sales forecast must attain a reasonable degree of reliability to be useful.
The analyst needs to know capacity utilization, unit cost of production, expected rate of inflation, general economic and business conditions, government rules and regulations, competitive forces, and social changes that would have an impact on the cost of marketing and sales, labor and raw materials, etc. The analyst will determine the impact of these variables on the industry and the specific company to project growth rates of sales.
Since volume and selling price forecasts will differ by product or business segment, the ideal sales and related cost forecasts should be done for each major product or segment of the firm. This is particularly critical when products or segments have different manufacturing or distribution cost structures.
Sales volume in units and unit selling prices need to be projected. The level of sales for future periods is dependent on not only what the firm has done in the past, but also what it thinks it can do in the future. Some ancillary issues that will need to be resolved as part of the sales forecast may arise. For example, if sales are projected to increase, will the firm be required to redesign its production processes, purchase new equipment, raise additional capital, hire more employees, or purchase new types of materials? Increasing sales may cause bottlenecks and inefficiencies. Decreasing sales may assist the firm to reach an optimal production level. Statistical techniques or econometric forecasts are frequently used to assist in developing volume projections. Marketing personnel can be helpful in forecasting anticipated unit selling prices. Marketing executives can gather forecasts from each individual salesperson for a particular territory or product. The firm's sales forecast becomes the aggregate of the individual forecasts.
OTHER FACTORS IN FORECASTS
The next step in the forecast is to project the related costs. In order to complete this step a firm needs to have a handle on the related cost structures. For each major element of cost, the firm needs to know the variable/fixed split. Again, some statistical analyses may be needed to determine this. The firm will also need to project the overhead expenses common to all products or segments.
It is usually helpful to calculate the contribution margin, or marginal revenue, of each product line, geographical territory, division, or whatever unit management wishes to use analytically. Contribution margin is the difference between sales, variable costs, and direct fixed costs. It calculates the amount that each unit is contributing to meeting common fixed costs and to net income.
Once the contribution margins are determined, the forecast needs to reflect the interest charges and
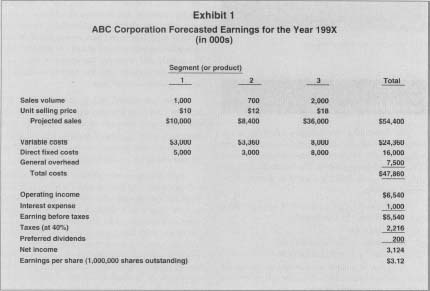
ABC Corporation Forecasted Earnings for the Year199X
(in 000s)
| Segment (or product) | ||||
| 1 | 2 | 3 | Total | |
| Sales volume | 1,000 | 700 | 2,000 | |
| Unit selling price | $10 | $12 | $18 | |
| Projected sales | $10,000 | $8,400 | $36,000 | $54,400 |
| Variable costs | $3,000 | $3,360 | 8,000 | $24,360 |
| Direct fixed costs | 5,000 | 3,000 | 8,000 | 16,000 |
| General overhead | 7,500 | |||
| Total costs | $47,860 | |||
| Operating income | $6,540 | |||
| Interest expense | 1,000 | |||
| Earning before taxes | $5,540 | |||
| Taxes (at 40%) | 2,216 | |||
| Preferred dividends | 200 | |||
| Net income | 3,124 | |||
| Earnings per share (1,000,000 shares outstanding) | $3.12 | |||
preferred dividend obligations inherent in its capital structure. The interest charges, since they are tax deductible, will need to be ascertained before income taxes for the year are projected.
The last step is to calculate forecasted earnings per share (EPS). To do this, divide earnings after any preferred dividend by the forecasted average number of common shares that will be outstanding during the forecast year. If the firm has any potentially dilutive securities in its capital structure—or stock options outstanding—special, more complex, computations of EPS may be required.
A sample forecast is in Exhibit I.
USERS AND USES OF EARNINGS
FORECASTS
LENDERS.
Financial institutions, especially those that are creditors, or potential creditors, of a company are acutely interested in the firm's earnings forecast. Before a loan is approved, many lenders ask potential borrowers for pro-forma financial statements that include earnings forecasts. Especially for longer-term loans, the lenders are eager to see if the borrowers will be generating sufficient cash flow through operations to retire the loan. Many lenders ask for forecasts just to see if potential borrowers know enough about their company to be able to prepare a comprehensive forecast.
OWNERS AND SECURITY MARKETS.
Owners of a company want to see earnings forecasts in order to determine if their capital will be generating a sufficient rate of return to warrant their continued investment. For publicly traded firms, security prices generally represent values based on the firm's future cash flows. Earnings forecasts supply data to enable investment analysts to determine the course of investing action (e.g., buy, hold, sell). Earnings forecasts for publicly held companies are typically updated quarterly.
Actual earnings results are compared to forecasts and variations may affect the firm's security prices. (For example, it is not uncommon for a firm's common stock to drop in price when it misses its forecasted earnings by as little as one cent.) The forecasted earnings from the major leading analysts who follow a given company are compiled into what is called the "consensus" earnings. These typically form the basis for market actions.
MANAGEMENT.
A very popular use of earnings forecasts is as benchmarks by management. Since the forecasted earnings are generally an outgrowth of the budget process, all components of the budget can be compared to actual to see how the firm is performing.
SEE ALSO : Business Planning ; Delphi Technique ; Discriminant Analysis ; Histograms ; Regression Analysis ; Time Series Analysis
[ Ronald M. Horwitz ]
FURTHER READING:
Baginski, Stephen P., Kenneth S. Lorek, and G. Lee Willinger. "Economic Determinants of Quarterly Earnings Data." Quarterly Review of Economics and Finance 33, no. I (spring 1993): 87-100.
Cohen, William A. The Practice of Marketing Management: Analysis, Planning, and Implementation. 2nd ed. New York: Macmillan, 1991.
Kang, Sok-Hyon, John O'Brien, and S. Sivaramakrishnan. "Analysts' Interim Earnings Forecasts: Evidence on the Forecasting Process." Journal of Accounting Research 32, no. I (spring 1994): 103-11.
Mueller, Dennis C. Profits in the Long Run. Cambridge: Cambridge University Press, 1986.
Shim, Jae J., and Joel G. Siegel. Handbook of Financial Analysis, Forecasting, and Modeling. Englewood Cliffs, NJ: Prentice Hall, 1988.
Welsch, Glenn A., Ronald W. Hilton, and Paul N. Gordon. Budgeting: Profit Planning and Control. 5th ed. Englewood Cliffs, NJ: Prentice Hall, 1988.
Comment about this article, ask questions, or add new information about this topic: