PROFIT MARGIN

The profit margin is an accounting measure designed to gauge the financial health of a business, firm, or industry. In general, it is defined as the proportion of profit, or revenue leftover after the firm's expenses are deducted, to total sales receipts over some defined period. Profit margins may be calculated at the enterprise level—how profitable is the business overall?—or on an individual product or service basis—how profitable is a particular line of business? The margin indicates how much profit a firm accrues from each dollar of sales and can be a measure of a company's cost efficiency, since a lower cost per unit of sales will yield a greater profit. Because both revenues and costs can be categorized in different ways, several forms of profit margin figures are used in business, the most common of which is the net profit margin, or net margin.
As a measure of the competitive success of a business, the profit margin is very important because it captures the firm's unit costs. A low-cost producer in an industry would generally have a higher profit margin. This is because firms tend to sell the same product at roughly the same price (adjusted for quality differences); therefore, lower costs would be reflected in a higher profit margin. Lower-cost firms also have a potentially deadly strategic advantage in a competitive price war because they have the leverage to undercut their competitors by cutting prices in order to gain market share and potentially drive higher-cost (and hence lower margin) firms out of business.
If costs rise and prices do not rise to keep up, then the profit margin will fall. In times of business cycle upturns, prices tend to rise; in business cycle downturns, prices tend to fall. Of course, many factors, and not only costs, will affect the profit margin, namely, industry-specific factors that relate to investment requirements, pricing, type of market, and conditions of production (including production turnover time).
As these dynamics suggest, however, comparing profit margins of different companies is most meaningful when the companies are in the same line of business or when there is reason to believe one's cost structure is analogous to another's. For instance, as Table I illustrates, companies in the pharmaceutical industry bring in, on average, a profit margin four times that of paper manufacturers. Thus, to expect a paper company to perform in the range of a pharmaceutical company would in most cases be unrealistic.
Corporations continually seek to expand their profit and, while a growing absolute dollar amount of profit is desirable, by itself it has limited significance unless it is placed in the context of the revenue from which it was derived. To a small entrepreneur, for example, a $2 million profit might be perceived as an enormous return and might represent a substantial proportion of sales. To General Motors, on the other hand, a net profit of $2 million would equal one-thousandth of one percent (.001 percent) of sales—it would be barely breaking even. This is why firms use measures such as the profit margin and the profit rate to show proportionality.
TYPES OF PROFIT MARGINS.
Profit is a flow concept and the profit margin measures the flow of profits over some period compared with the costs, or sales incurred over the same period. Thus, one could compute the profit margin on costs (profits divided by costs), or the profit margin on sales (profit margin divided by sales). Other specific profit margin measures often calculated by businesses are
gross profit margin —(gross profit divided by net sales), the broadest measure of corporate profitability, where gross profit is the amount of revenue in excess of basic costs but before subtracting nonproduction expenses, such as the costs of sales and administration, taxes, and depreciation;
operating profit margin —(operating profit divided by net sales), where operating profit includes all revenue from ongoing operations (but excludes interest earned on assets, one-time sales of assets, and other peripheral sources of income) minus production, sales, and administrative costs;
net profit margin —(net profit divided by net sales), where net profit (also known as net income or net earnings) is operating profit minus interest, taxes, and depreciation.
PROFIT RATE.
The profit margin is related to other measures, such as the rate of profit (sometimes called the rate of return), which comprise various measures of the amount of profit earned relative to the total amount of capital invested (or the stock of capital) required to generate that profit. Thus, while the profit margin measures the amount of profit per unit of sales, the rate of profit on total assets indicates the efficiency of the total investment. Or, put another way, while the profit margin measures the amount of profit per unit of capital (labor, working capital, and depreciation of plant and equipment) consumed over a particular period, the profit rate measures the amount of profit per unit of capital advanced (the entire stock of capital required for the production of the good). As an example, if a $1,000 investment in plant and equipment were required to produce a $100 television set, then a profit margin of 10 percent would translate into a profit rate on total investment of only 1 percent. Thus, in this scenario, the unit costs are low enough to generate 10 percent profit (profit margin) on the capital consumed (assuming some market price) to produce the TV, set but in order to achieve that margin, a total capital expenditure of $1,000 must be made.
The difference between the profit margin measure and the profit rate
concept then lies in the rate at which the capital stock depreciates; and
the rate at
which the production process repeats itself, or turnover time. In the
first case, if, say, the entire capital stock for a particular firm or
industry is completely used up during one production cycle, then the
profit margin would be exactly the same as the profit rate. In the case of
turnover, if a firm succeeds in, for example, doubling the amount of times
the production process repeats itself in the same period, then twice as
much profit would be made on the same capital invested even though the
profit margin might not change. More formally, the rate of return may be
expressed as
where average assets is the total capital stock divided by the number of
times the production process turns over. Thus, the rate of return can be
increased by increasing the profit margin or shortening the production
cycle. Of course, this will largely depend on the conditions of production
in particular industries or firms.
PROFITS BY SECTOR.
To give a broad view of the spectrum of profit margins for U.S. manufacturing sectors, shown in Table 1 are after-tax profit margins (net margins) on sales as reported to the U.S. Bureau of the Census for the third quarter of 1998.
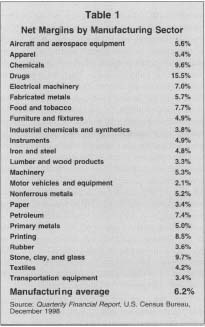
Net Margins by Manufacturing Sector
| Aircraft and aerospace equipment | 5.6% |
| Apparel | 5.4% |
| Chemicals | 9.6% |
| Drugs | 15.5% |
| Electrical machinery | 7.0% |
| Fabricated metals | 5.7% |
| Food and tobacco | 7.7% |
| Furniture and fixtures | 4.9% |
| Industrial chemicals and synthetics | 3.8% |
| Instruments | 4.9% |
| Iron and steel | 4.8% |
| Lumber and wood products | 3.3% |
| Machinery | 5.3% |
| Motor vehicles and equipment | 2.1% |
| Nonferrous metals | 5.2% |
| Paper | 3.4% |
| Petroleum | 7.4% |
| Primary metals | 5.0% |
| Printing | 8.5% |
| Rubber | 3.6% |
| Stone, clay, and glass | 9.7% |
| Textiles | 4.2% |
| Transportation equipment | 3.4% |
| Manufacturing average | 6.2% |
For U.S. manufacturing firms as a whole, although absolute levels of profits are continually reaching new peaks (firms would hardly be induced to invest if their investment gained them the same profit—or less profit—each year), the profit margin can be cyclical, particularly over the short term. In general, after-tax margins at U.S. manufacturing companies in recent decades have averaged 4-6 percent annually. Profit margins in the retail sector tend to be much narrower, typically closer to 2 percent on an annual basis.
SEE ALSO : Income and Revenue ; Income Statement
FURTHER READING:
Mueller, Dennis C., ed. The Dynamics of Company Profits: An International Comparison. New York: Cambridge University Press, 1990.
U.S. Census Bureau. Quarterly Financial Report for Manufacturing, Mining, and Trade Corporations. Series QFR-98-3. Washington: GPO, 1998. Available from www.census.gov .
Comment about this article, ask questions, or add new information about this topic: