SIC 2875
FERTILIZERS, MIXING ONLY
This category covers establishments primarily engaged in mixing fertilizers from already-processed fertilizer materials. In the industry, "fertilizer materials" refers specifically to fertilizers that have no more than one of the three primary plant nutrients (nitrogen, phosphorus, and potassium). This category also includes manufacturers of compost and potting soil, which condition the soil to promote plant growth but contain relatively small amounts of plant nutrients.
NAICS Code(s)
325314 (Fertilizer (Mixing Only) Manufacturing)
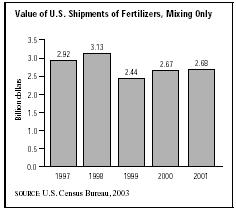
The production of mixed fertilizers is an industry that has seen periodic declines during the past 30 years. The value of mixed fertilizer shipments in 1997 was $2.9 billion, up from $2.2 billion in 1995 and $1.9 billion in 1992. After climbing to $3.1 billion in 1998, however, shipments of mixed fertilizers declined to $2.6 billion by 2002. Though single nutrient fertilizers have dominated the fertilizer market since the 1970s, mixed fertilizers remain a necessity for American farmers.
According to the United States Department of Agriculture (USDA), mixed fertilizers, which are also termed multiple-nutrient fertilizers, are typically of four varieties: nitrogen, phosphorous, and potassium mixtures (NP-K); nitrogen and phosphorous mixtures (N-P); nitrogen and potassium mixtures (N-K); and phosphorous and potassium mixtures (P-K). In the early 2000s, N-P-K multiple-nutrient fertilizers were used most frequently in the United States, with more than 10 million short tons consumed annually. Roughly seven million short tons of N-P mixtures were consumed annually, followed by N-K and P-K.
Mixed fertilizers can also be classified according to the method manufacturers use to combine the component fertilizers—homogeneous mixtures, bulk blends, and fluids. A key process performed by producers of homogeneous mixtures (and one that is performed by producers of fertilizer materials as well) is granulation. Nongranulated dry fertilizer powders have a tendency to form hardened cakes, which make the product difficult to handle. The hardened cakes are not always broken up easily, and explosives are sometimes used to break these cakes up into heaps of stored fertilizer. Another problem with nongranulated fertilizer mixes is the propensity for the component fertilizer materials to segregate by particle sizes during transport and handling. Granulation addresses the problem of caking and segregation by shaping the constituent parts of the fertilizer mix into larger
granules which are relatively equal in size and which each have the same nutrient composition. The manufacture of this type of mixed fertilizer is a complex process requiring sophisticated equipment.
Bulk blending plants, by contrast, do not perform granulation or any chemical processes and their basic equipment needs are rudimentary (such as bins, front-end loaders, mixers, and scales). They keep an assortment of fertilizer materials on site, from which they select desired proportions for mixing together, often to suit the specific nutrient needs of the customer. The mix may be bagged or it may be taken directly to the customer'sfield and applied.
Fluid mixed fertilizers have the smallest share of the mixed fertilizer market. Fluid mixed fertilizers are generally made by either the hot-mix or cold-mix process. Hotmix plants combine ammonia with phosphoric acid, a reaction that releases considerable heat. The cold-mix process usually does not involve heat-producing chemical reactions, and the equipment needs of cold-mix plants are simpler than those of hot-mix plants.
The commercial use of multiple-nutrient fertilizers is somewhat controversial. Some governments have argued against the practice on the grounds that optimal results are obtained when farmers tailor their fertilizer usage to their specific crop/soil combination, and that this is best done with the use of single-nutrient fertilizers applied in the proper proportions. Research results have supported that argument, and advances in soil nutrient analysis technique have made it easier to determine which specific nutrient a particular plot of land may need. The result of this debate has been a trend away from the use of mixed fertilizers. Data for fertilizer consumption in the United States covering the period between 1955 and 1980 indicates that beginning in 1955, the use of mixtures was roughly twice that of direct application fertilizer materials. Over the subsequent years, the use of single-nutrient fertilizers grew, both in absolute terms and relative to mixtures and, in the early 1970s, it surpassed the use of mixtures. According to the USDA, the 19.3 million short tons of multiple-nutrient fertilizer consumed in 1998 were down from the 19.6 million short tons used in 1997. Moreover, single-nutrient fertilizers were used almost twice as often as multiple-nutrient fertilizers. In 1998, more than 31 million short tons of single-nutrient fertilizers were consumed in America. But the convenience of applying commercially-mixed fertilizer as opposed to determining the precise chemical balance appropriate for each plot of land ensures that the manufacture of mixed fertilizers will remain a major agricultural industry.
In the early 2000s, more than 440 establishments were engaged in this industry, according to the U.S. Census Bureau, up from 413 in 1993. Florida had the highest number of such businesses in the United States, followed by Texas and New York. More than 9,200 American workers were employed in the manufacture of mixed fertilizers in 2000. More than 5,400 of them were production workers earning, on average, $14.53 per hour. Total payroll costs were $311.8 million.
The leader of the mixed fertilizer industry in 2003 was the agronomy company Cenex/Land O'Lakes Ag Services. This joint venture between Cenex Harvest States Cooperative and Land O'Lakes reported 2003 sales of about $4 billion. Other key companies in this sector include the Tennessee Farmers Cooperative, with sales of $412 million and 613 employees, and Royster-Clark Incorporated of North Carolina, whose 2003 sales topped $959 million.
Further Reading
U.S. Census Bureau. "Statistics for Industry Groups and Industries: 2000." February 2002. Available from http://www.census.gov/prod/2002pubs/m00as-1.pdf .
——. "Value of Shipments for Product Classes: 2001 and Earlier Years." December 2002. Available from http://www.census.gov/prod/2003pubs/m01as-2.pdf .
Comment about this article, ask questions, or add new information about this topic: