SIC 2893
PRINTING INK
This classification includes establishments primarily engaged in manufacturing printing ink, including gravure ink, screen process ink, and lithographic ink. Establishments primarily engaged in manufacturing writing ink and fluids are classified in SIC 2899: Chemicals and Chemical Preparations, Not Elsewhere Classified. Those establishments manufacturing drawing ink are classified in SIC 3952: Lead Pencils, Crayons, and Artists' Materials.
NAICS Code(s)
325910 (Printing Ink Manufacturing)
The printing ink industry is one of America's oldest, dating back to the pre-Revolutionary War days. After more than 200 years of similar operating procedures, there was little change in the structure of the industry entering the 1990s. However, the 1990s brought massive consolidation to the sector. Because the market for printing inks was mature and profits were low, the largest ink companies acquired smaller firms as a way to boost market share. By September 1999, four companies controlled more than half of the global printing ink market, according to Chemical Market Reporter.
During the recession at the beginning of the 1990s, raw material prices stabilized considerably. Purchasing experts in the ink industry found that there were only a few areas where upward price pressure could continue throughout 1990. The major factor affecting prices was the stable price of crude oil, from which more than 75 percent of the raw materials for ink was derived. The industry's membership sought to take full advantage of the relatively low raw material costs, resisting any price increases from raw materials suppliers unless they were fully justified. In some product areas, the companies were able to negotiate price reductions, which helped the industry hold the line on its own prices. Between 1998 and 2000, the cost of materials for the industry declined from $2.6 billion to $2.39 billion.
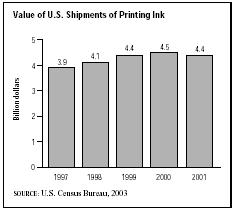
The National Association of Printing Ink Manufacturers (NAPIM)—the trade organization representing ink producers in the United States—reported that industry shipments were valued at $4.45 billion in 2001, down from $4.54 billion in 2000. Printing ink shipments had increased steadily throughout the late 1990s and early 2000s, before declining in 2001.
The printing ink industry is classified by ink type. In 2001, lithographic and offset printing ink shipments comprised the largest category, with shipments valued at $1.87 billion—41.9 percent of the total shipments. With 27.3 percent of the total market, flexographic printing inks were the second-largest sector, with 2001 shipments topping $1.21 billion in 2001, a substantial increase from 1997 shipments of $718.14 million. Gravure printing inks shipments totaled $594.01 million, representing 13.3 percent of the total, while nonimpact digital ink shipments were more than $271.23 million, or 6 percent of the total. Letterpress printing inks were the smallest individual ink category, with approximately $143.04 million in shipments (accounting for 3.2 percent of the total). The remaining 8.3 percent of the market was comprised of nonclassified printing inks.
The 1994 Vegetable Ink Printing Act of Congress exerted a powerful influence on the industry. The bill mandated that printers with government contracts use vegetable oil-based inks instead of volatile petroleum-based inks whenever possible. The main concerns were due to the hazardous effects of using crude oil as the ink base, as was done for most of the history of printing inks. Emissions from volatile organic compounds (VOCs) and emissions of hazardous air pollutants (HAPs) had to be controlled. Printing inks also had to be developed to make the de-inking and recycling of paper easier. Printers wanted inks that stuck to paper, and recyclers wanted inks that could be easily removed.
Further change in the industry occurred in the late 1990s as the pace of consolidation accelerated. In 1998, Flint Ink of Ann Arbor, Michigan, acquired Mander plc for $167 million. Flint continued its buying spree in November of 1999, with its acquisition of Sacramento, California-based The Ink Co. Flint—the second-largest ink producer in the world—made the purchases to remain competitive with the industry's global leader, Dainippon Ink & Chemical of Japan. Dainippon's U.S. subsidiary, Sun Chemical Corp., was the second-largest American ink producer behind Flint. In an effort to gain access to China's printing industry, which was growing at a pace of roughly 10 percent per year, Flint created an ink manufacturing joint venture with Graphic Tech, its Asian distributor, in 2003.
In the early 2000s, more than 500 establishments were involved in the production of printing ink, and roughly 200 of these were larger companies with more than 20 employees. California was home to the largest number of printing ink manufacturers, followed by Texas and New Jersey.
A total of 13,317 people worked in the printing ink production industry in 2000, with 6,798 of those directly involved in production. Production employees worked an average of 40 hours per week and earned an average wage of $18.52 per hour.
The printing ink industry has made efforts to reduce the environmental burden of its products. Before passage of the Clean Air Act, printing ink manufacturers were developing water-based ink systems to replace inks containing volatile organic compounds. Many years before the first "CONNEG Law" was passed to reduce heavy metals in packaging, the printing ink industry had been reducing the use of lead-bearing pigments in packaging inks.
Growth in vegetable-based inks leveled off in 1996 as most of the users with environmental concerns switched to newer inks. Another increase in vegetable-and water-based inks will only be likely if environmental pressure increases again.
Further Reading
"Flint Ink and Graphic Tech Merge in China." Asia Pacific Coatings Journal, August 2002.
U.S. Census Bureau. "Statistics for Industry Groups and Industries: 2000." February 2002. Available from http://www.census.gov/prod/2002pubs/m00as-1.pdf .
——. "Value of Shipments for Product Classes: 2001 and Earlier Years." December 2002. Available from http://www.census.gov/prod/2003pubs/m01as-2.pdf .
Comment about this article, ask questions, or add new information about this topic: