SIC 3669
COMMUNICATIONS EQUIPMENT, NOT ELSEWHERE CLASSIFIED
This classification covers companies primarily engaged in manufacturing communications and related equipment, not elsewhere classified. Important products of this industry include intercommunication equipment, traffic signaling equipment, and fire and burglar alarm apparatus. In 1997 there were about 500 companies employing more than 25,000 workers with total shipments valued more than $4.2 billion. Establishments that provide security systems monitoring and maintenance are discussed in SIC 7382: Security Systems Services.
NAICS Code(s)
334290 (Other Communication Equipment Manufacturing)
While this miscellaneous communications equipment industry includes a number of visible and important products, such as railroad signaling devices and various traffic control equipment, the revenue accrued in this industry originates primarily from the sale of security and smoke/fire alarm systems (about 63 percent). Traffic control equipment makes up about 25 percent, followed by intercommunications systems at a distant 4 percent.
In 2001, there were 431 firms operating 468 establishments in this industry. While there were some multi-billion dollar companies, the vast majority of companies were small or medium shops, employing fewer than 20 workers.
Alarm Systems. The United States has long dominated the alarm manufacturing and alarm monitoring industries worldwide. A myriad of alarm manufacturers have been able to establish themselves over the years: in 1997 the National Burglar and Fire Alarm Association estimated that an average of 13,100 local installation companies were operating in America. The number of alarm systems installed grew from 2.1 million in 1994 to 2.4 million in 1997, while total industry revenues grew from $9.8 billion to $13.9 billion, respectively.
From 1995 to 1998, consumers spent more than $33.0 billion on home security installations and monitoring. In 1997, Americans spent around $14.8 billion on professionally installed security products and services, up from $10.2 billion in 1995. The segment logged $17.5 billion in 2000 and $18.7 billion in 2001. Spending was expected to continue at an estimated rate of 4.3 percent per year, with a projected 18.0 percent of households having professionally installed security systems in 2002. Long-term factors that drive security system sales are economic conditions, crime, sales and marketing prowess, disposable consumer income, and capital spending by businesses.
Three major trends drove the growth of the security systems market in the mid-1990s: growing public concern about crime, reluctance on the part of the U.S. government to increase public safety expenditures, and a combination of technological advances and intensified price competition that made home security systems more affordable. By the middle of the decade, a basic home security system could be had for $200 or $300—down from about $1,500 only a few years earlier. Revenue for this segment was about $20.3 billion in 2002, but about half of the companies in this industry segment have sales of $250,000 or less per year and only a handful of employees.
The increasing use of personal computers in American homes also opened a new and exploitable market niche for manufacturers of security systems. In the late 1990s, for example, security system manufacturers began to develop software that integrated equipment from various providers or allowed for future upgrades.
Manufacturers of alarm systems generally produce two kinds of component systems: perimeter and interior alarms. Perimeter systems typically consist of magnetic contacts that detect the opening of doors and windows, detectors that pick up the cutting and breaking of glass, and alarm screens that allow windows to be opened for fresh air, but activate an alarm if the screen is tampered with. Interior systems usually provide infrared motion detectors located in strategic areas, fire alarms, panic buttons that can be operated manually to alert the monitoring station, and an electronic keypad that both accesses and operates the system.
In the late 1990s, manufacturers created new alarm systems capable of operating in concert with other home automation features so that homeowners could manipulate their surveillance system along with their entertainment systems and heating and cooling systems. The determination of prices is based on several factors, such as the size of the area being defended, the number of apertures that need to be protected, and the quantity and nature of the devices installed. The average family home can be protected for between $800 and $1,500.
Fire Systems. There are two smoke-sensing technologies commonly used in residential smoke detectors: photoelectric and ionization. Both are available in 9-volt battery and 110-volt house current models. Photoelectric detectors are more sensitive to slow, smoldering fires, while ionization detectors respond to fast burning fires like stove grease flare-ups or burning newspapers. In 2000, there was more than $5 billion in lost property due to fire.
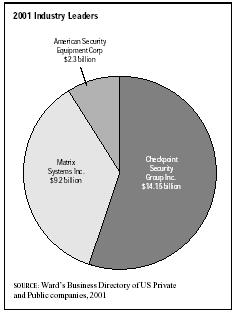
The overall industry leader in 2001 was Checkpoint Security Group Inc. of Eden Prairie, Minnesota, with overall revenues of $14.2 billion on the strength of just 200 employees. In distant second was Centerville, Ohio-based Matrix Systems Inc., with $9.2 billion in overall revenue and 100 employees. In third place was American Security Equipment Corp., of Carson, California, with $2.3 billion in overall revenue and fewer than 100 employees.
Due to the many varieties of products manufactured by this industry, there were leaders in specific segments as well for 2002. In the networking equipment category, Nortel Networks led the carrier voice packet segment and Levitron carried the electrical wiring device segment. Levitron also led in home network systems. Cisco was the leader in the router segment, the enterprise class router segment, and the wireless LAN segment, as well as the networking equipment segment. Comtrol Corporation had the lion's share of the four-port serial-to-ethernet device segment, while Polycom dominated videoconferencing and WebEx held most of the Web conferencing segment. The switch-fabric interconnect segment was led by Agilent, the private branch exchange segment was led by Avaya, and the network processor market was led by AMCC.
In 2001, the industry employed 28,000 workers. Employment projections for the communications equipment manufacturing industry as a whole were for a steady annual decrease in employment and a corresponding steady increase in output into 2012.
Further Reading
Baker, Deborah J., ed. Ward's Business Directory of US Private and Public Companies. Detroit, MI: Thomson Gale, 2003.
Darnay, Arsen J., ed. Manufacturing and Distribution USA. Detroit: Thomson Gale, 2003.
"Industry Statistics." NBFAA, 2003. 7 March 2004. Available from http://www.alarm.org .
Lazich, Robert S., ed. Market Share Reporter. Detroit, MI: Thomson Gale, 2004.
U.S. Census Bureau. Statistics of U.S. Businesses: 2001. 1 March 2004. Available from http://www.census.gov/epcd/susb/2001/us/US332311.htm .
U.S. Department of Commerce. Annual Survey of Manufactures. Washington: GPO, 2002.
U.S. Department of Labor, Bureau of Labor Statistics. Economic and Employment Projections. 11 February 2004. Available from http://www.bls.gov/news.release/ecopro.toc.htm .
Comment about this article, ask questions, or add new information about this topic: