SIC 3594
FLUID POWER PUMPS AND MOTORS
This classification covers establishments primarily engaged in manufacturing hydraulic and pneumatic fluid power pumps and motors, including hydrostatic transmissions. Establishments primarily engaged in manufacturing pumps for motor vehicles are classified in SIC 3714: Motor Vehicle Parts and Accessories.
NAICS Code(s)
333996 (Fluid Power Pump and Motor Manufacturing)
Manufacturers in this industry produce pumps and drives for hydraulic and pneumatic power mechanisms, primarily for use in industrial and aerospace applications. Because fluid power devices can exert massive amounts of controlled pressure, they are commonly utilized to power aircraft landing gear, industrial presses and lifts, heavy earth-moving equipment, and other heavy-duty equipment. They also are integrated into smaller machines that require precise power transfer.
Fluid power systems combine cylinders, couplings, valves, pumps, and motors. A positive displacement hydraulic pump, such as a piston pump, is the part of the system that delivers the oil required to drive or control hydraulic machinery. It creates pressure in a series of short bursts. In contrast, impulse pumps, such as the centrifugal pump, deliver steady, continuous oil pressure with less vibration. Hydraulic motors typically operate in conjunction with pumps and are often used to precisely vary the rotational speed of various machines.
Pascal's law, which states that pressure exerted upon a liquid is evenly transmitted in all directions, was posited in the mid-1600s. However, pumps that could efficiently deliver high and controlled pressure were not introduced until the 1800s. Not until the mid-1900s, in fact, did hydraulic pumps and motors become a common means of power transfer. By 1987, the first year in which this industry was separately classified by the U.S. government, sales of fluid power pumps and motors approached $1.5 billion. Although industry revenues increased to nearly $1.8 billion by 1990, a recession halted sales and earnings growth for most competitors throughout the early 1990s.
Industry participants in the mid-1990s benefited from a moderate upturn in the United States and global economy that boosted pump and motor demand in the industrial sector. Unfortunately, vital aerospace and defense markets remained depressed and offered little hope for gains in the near future. The most successful competitors countered market malaise with productivity gains and the introduction of cutting edge, high-performance
equipment. Many also looked to increased demand in overseas markets for high-tech U.S. pumps and motors. The industry experienced rapid growth in 1995, as the value of all product shipments increased 14 percent from 1994 figures, to $2.0 billion, and up 36 percent from $1.4 billion in 1992.
In 1997, sales reached $2.64 billion. Total employment was slightly more than 15,000, with almost 70 percent involved with production. The average wage was $16 per hour. The states of Illinois, Michigan, and Ohio were the leading employers. Almost 73 percent of all establishments had 20 or fewer employees. Of total sales, 41 percent went to reciprocating pumps used in non-aerospace applications; only 12 percent went to pumps and motors used in the aerospace industry.
According to the National Fluid Power Association (NFPA), the U.S. market for all fluid power products grew by 3 percent in 1998 to $13.5 billion. The fluid power industry grew 58 percent from 1992 to 1997, with exports of such products reaching almost $1.3 billion in 1997. Though the industry did not experience as much growth in 1998 as 1997, some manufacturers expect continued growth due to strong global demand in consumer products, as well as demand for capital equipment in Eastern Europe and South America.
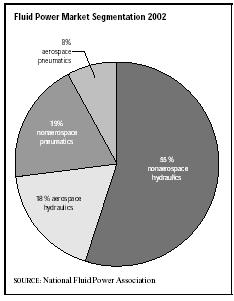
About half of the fluid power market goes to hydraulic power components, according to Frost & Sullivan. This market was worth $6.4 billion in 1997 and was expected to continue growing through the mid-2000s as a result of end-user capital spending and product replacement. NFPA reported that in 2002, hydraulic pumps captured 72 percent of the market as compared with pneumatic's 28 percent. Seventy-three percent of the fluid power industry as a whole was due to non-aerospace markets. Fifty-five percent of the fluid power market was due to non-aerospace hydraulics, with the rest divided between aerospace hydraulics, non-aerospace pneumatics, and aerospace pneumatics.
About 141 companies served this industry in 2001, totaling 164 establishments. Total shipments were valued at approximately $2.5 billion. According the U. S. Census Bureau's Current Industrial Reports, shipments of all pumps and compressors were valued at $7.9 billion in 2002, a decrease of 4 percent over the previous year.
The industry leader for 2001 was ITT Industries Inc., of White Plains, New York. The company logged more than $4.9 billion in total revenue and employed 38,000 workers, who were spread across its four divisions. In 2003, the president of ITT's fluid handling division was elected president of the Hydraulic Institute (HI), one of the associations serving the industry. Mannesmann Corp., of New York City, was second in 2001 with $3 billion in total revenue and 10,000 employees. The majority of the companies, however, employed fewer than 20 workers.
Although the industry employed about 13,610 workers in 2001, including 9,131 production jobs, long-term employment prospects were bleak, according to the U.S. Bureau of Labor Statistics. Increased foreign competition and continued productivity gains, through automation and restructuring, were projected to be factors in workforce reduction for labor and white-collar workers alike.
Capitalizing on what computers in general and the Internet in particular could offer the manufacturing industry, in 2003 HI offered a continuing education course entitled "Centrifugal Pumps: Fundamentals, Design and Applications." The course was intended to help educate those in the industry about more efficient and costeffective design solutions. Consolidation of the industry was increasing as acquisitions continued. Other challenges facing the industry included product standardization, a demand for higher product quality and faster product delivery, lack of qualified workers, environmental concerns, leakage problems, and successful integration of electronic controls. Consolidation of the industry was increasing as acquisitions continued.
HI and the McIlvaine Company predicted the global pump market would reach over $30 billion in 2003, an increase of 20 percent from 1999. Sales of parts and drivers would add another $17 billion. Sealless pumps were expected to have the highest growth rate at 10 percent, as chemical process industries made the switch to these pumps. The pump market in Asia was expected to have the fastest growth rate (8 percent versus 4 percent overall), as new water and wastewater treatment plants were built.
NFPA reported that in 2002, Canada, Mexico, Germany, and the United Kingdom were the major export markets. Germany, Japan, Canada, and Mexico were the largest import markets. The pump market in Asia was expected to have the fastest growth rate (8 percent versus 4 percent overall), as new water and wastewater treatment plants are built. The United States would retain the largest market share.
Further Reading
Baker, Deborah J., ed. Ward's Business Directory of US Private and Public Companies. Detroit, MI: Thomson Gale, 2003.
Hoover's Company Fact Sheet. "ITT Industries Inc." 3 March 2004. Available from http://www.hoovers.com .
"Hydraulic Institute." Contractor, April 2003.
"Hydraulic Institute." Global Cosmetic Industry, September 2003.
"Market Data." National Fluid Power Association. 6 March 2004. Available from http://www.nfpa.com .
U.S. Census Bureau. Current Industrial Reports: Pumps and Compressors. August 2003. 6 March 2004. Available from http://www.census.gov .
——. Statistics of U.S. Businesses: 2001. 1 March 2004. Available from http://www.census.gov/epcd/susb/2001/us/US332311.htm .
U.S. Department of Commerce. Annual Survey of Manufactures. Washington: GPO, 2002.
U.S. Department of Labor, Bureau of Labor Statistics. Economic and Employment Projections. 11 February 2004. Available from http://www.bls.gov/news.release/ecopro.toc.htm .
Comment about this article, ask questions, or add new information about this topic: