SIC 3299
NONMETALLIC MINERAL PRODUCTS, NOT ELSEWHERE CLASSIFIED
This category is comprised of firms that manufacture goods made from plaster of Paris, papier-mâché, sand lime, and other miscellaneous nonmetallic mineral products. Examples of industry output include synthetic stones, clay and plaster plaques, architectural plaster work, plaster of Paris sculptures, miniature gypsum images, plaster of Paris flower boxes, and gypsum urns.
NAICS Code(s)
327420 (Gypsum and Gypsum Product Manufacturing)
327999 (All Other Miscellaneous Nonmetallic Mineral Product Manufacturing)
Markets for miscellaneous nonmetallic mineral products are extremely fragmented. The largest single industry product category is statuary and art goods, which accounted for nearly 20 percent of industry output during the early 2000s. The largest consumer of this industry's offerings is the nonferrous wire-drawing industry, which uses tubing made from quartz to produce electrical wire. Other major consumers include fabricated rubber product manufacturers and motor and generator makers, who also use quartz tubing. About 10 percent of production is exported.
The industry is relatively low-tech and manufactures many commodity-like products. The average amount of value contributed per production worker is about 65 percent lower than the U.S. manufacturing average. Likewise, capital investment per employee represents roughly 70 percent of the national manufacturing average. As a result, many producers of nonmetallic mineral products are highly susceptible to competition from low-cost foreign producers.
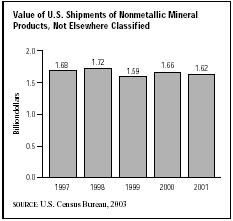
U.S. sales of miscellaneous nonmetallic mineral products topped $400 million in the early 1980s. During the mid-1980s, however, shipment growth slowed compared to the 1960s and 1970s. Although domestic demand for products such as electrical wiring and art supplies increased, foreign competition reduced profit opportunities in many sectors. Revenues increased at a tepid 5 percent annually between 1982 and 1990, slightly lagging behind inflation. Furthermore, a U.S. recession in the late 1980s and early 1990s stalled expansion—annual sales hovered around $650 to $700 million. General economic improvement in the mid-1990s, as well as a boost in new commercial and residential construction, led to increased demand for electrical wire, which helped the industry resume average growth to more than $1.6 billion in shipments in 1997. Prices rose again the following year. The value of shipments fluctuated throughout the late 1990s. After growing from $1.59 billion in 1999 to $1.66 billion in 2000, shipments of nonmetallic minerals products, not elsewhere classified, dipped to $1.62 billion.
Nearly 500 establishments competed in the industry at the turn of the twenty-first century. The majority of the top 25 firms generated revenues of less than $25 million per year. The industry leader was Carborundum Company of Niagara Falls, New York, with around $340 million in sales and about 3,200 employees. Ranking second was CeramTec North America Electronic Applications Inc. of Mansfield, Massachusetts, which had sales of about $210 million and 1,800 employees.
In the mid-1990s, there was significant development in the area of advanced materials such as ceramic fibers. Ceramic fibers are used primarily in composite materials, which are lighter, stronger, and more heat-resistant than pure ceramics or metals. In 1997, the market introduced "core-sheath" ceramic fibers, which are the result of a new process called biocomponent extrusion that increases strength, heat resistance, and efficiency in production. The new fibers provide advantages to end users such as auto and aircraft industries, which use composite materials in high-tech applications such as jet engines. Companies continued to develop new core-sheath fibers into the early 2000s.
Miscellaneous nonmetallic mineral product manufacturers employed a workforce of about 12,290 people in 2000. The average hourly salary for the 8,617 production workers was $8.43. Future prospects for employment in this industry were generally dismal, as positions for most laborers will likely decline by 15 to 20 percent between 1996 and 2005, according to the Bureau of Labor Statistics.
Further Reading
U.S. Census Bureau. "Statistics for Industry Groups and Industries: 2000." February 2002. Available from http://www.census.gov/prod/2002pubs/m00as-1.pdf .
——. "Value of Shipments for Product Classes: 2001 and Earlier Years." December 2002. Available from http://www.census.gov/prod/2003pubs/m01as-2.pdf .
Comment about this article, ask questions, or add new information about this topic: