SIC 5078
REFRIGERATION EQUIPMENT AND SUPPLIES
This industry consists of companies that primarily wholesale refrigeration equipment and supplies. Industry products include beverage coolers, refrigerated display cases, drinking water coolers, ice cream cabinets, icemaking machines, walk-in and reach-in commercial refrigerators, and refrigerated soda fountain fixtures. Companies that primarily install refrigeration equipment from their own stock are in SIC 1711: Plumbing, Heating and Air-Conditioning.
NAICS Code(s)
421740 (Refrigeration Equipment and Supplies Wholesalers)
According to the U.S. Census Bureau, there were 1,501 establishments involved within the industry of wholesale refrigeration equipment and supplies. There were approximately 13,670 employees, with an annual payroll of $583,358. In 2003, the total number of establishments increased to 3,088, with annual sales of $4.9 billion. The average sales per establishment was $2.3 million. The workforce increased to 20,862 employees.
The largest value of shipments in this industry originated in Pennsylvania, California, New York, and Texas. Refrigeration equipment and supplies dominated the market, with 45 percent of industry sales. Total value of shipments was $4.6 million, with 1,390 establishments employing 10,269 workers.
In 1999, the industry experienced an acute shortage of R-134a, a key refrigerant for production, due to increased demand for use in flat-tire inflators, increased exports to fill the European demand, a scarcity of raw materials to manufacture R-134a, and the shutdown of three Japanese producers of the refrigerant. R-134a prices rose more than 70 percent in February and March 1999. Refron, Inc. of Long Island City, New York, one of the market leaders, took advantage of this shortage to advertise its inventory of rare CFC refrigerants. The company's sales grew in 1998 by 2,389 new customers.
August 1999 shipments of unitary air-conditioners and heat pumps, as tracked by the Air Conditioning and Refrigeration Institute, fell compared to 1998 shipments. In January 1998 sales dropped to about 350,000 from almost 400,000 in January 1997. However, shipments rose by 10.4 percent in September 1999 over the previous year, making the August drop seem like an anomaly.
Also in 1999, the Environmental Protection Agency flexed its muscle by enforcing its 1992 Refrigerants Recycling regulations. First, the EPA fined the City of New York $50 million for venting refrigerants into the atmosphere by not removing them before crushing refrigerators and air conditioners for disposal. The EPA also enforced its anti-leakage regulations by fining GTE in California $85,000 for insufficient repair work on its refrigeration system. The agency simultaneously proposed lower allowable leakage rates, dropping the acceptable level from 35 percent to as low as 5 percent, depending on the type of system.
In September 1995, the EPA enacted its Clean Air Act Amendment, tightening leak repair requirements for owners and operators. Still, as the economy improved and interest rates went down, refrigeration equipment and supplies sales rose during the mid-1990s.
A poor economy during the early 1990s lowered refrigeration equipment sales. Large refrigeration equipment buyers, such as supermarkets, had trouble obtaining credit, and slim profit margins affected industry expansion. Mobile vehicle refrigeration systems sales fell from 60,070 units in 1989 to 50,800 in 1990. Sales of drinking
water coolers also dropped from 984,061 units in 1989 to 886,175 in 1990.
Ice-making machines sales rose, from 195,959 units in 1989 to 200,818 in 1990, but stayed below the 243,771 units sold in 1988. Among other factors, lower sales were blamed on slow growth in the fast food restaurant industry. According to one account, about 70 percent of ice machine shipments during the early 1990s were replacements rather than new purchases. In addition to the fast food industry, who use ice machines for soft drinks, other ice machine buyers include hospital emergency rooms, food processors, and pre-cast concrete pourers.
According to government statistics, there were 1,421 establishments in this industry in 1994, down from 1,513 in 1987. Combined sales totaled approximately $3.7 billion in 1996, up from $2.68 billion in 1987. Merchant wholesalers—wholesalers who take title to goods they sell—made up the largest number of these companies, with 1,252 establishments. The industry employed 10,373 people, with an annual payroll of $303 million in 1992, compared to 12,281 people paid a total of $303 million in 1987. The employment rate was also expected to fall to 11,561. California had the most establishments, with 191, and generated 12.4 percent of U.S. sales. Texas had 108 establishments and generated 7.9 percent of U.S. sales.
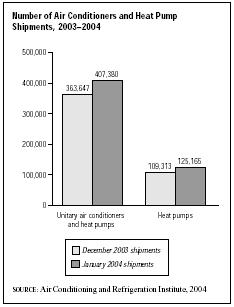
According to the Air Conditioning and Refrigerating Institute, the total number of central air conditioners and air—source heat pumps shipped in 2003 increased one percent over 2002 to 6,807,262. Total heat pump shipments of 1,625,365 had also increased 10 percent. However, shipments of both unitary air conditioners and heat pumps dropped three percent to 363,647 units. Total distributor shipments were up eight percent overall in 2003. The trend seemed to continue when January 2004 shipments increased by six percent. In fact, total distributor shipments climbed eight percent from January 2003.
The majority of the establishments in this industry were small. In 2003, there were 1,962 establishments that had fewer than five employees; 571 had between five and nine employees; 318 had between 10 and 24 employees; 101 had between 25 and 49 employees; 28 had between 50 and 99 employees; and about 7 establishments with 100 or more employees.
Further Reading
"Air Conditioners and Heat Pumps Set Record 6,807,262 Units Shipped in 2003." 1 February 2004. Available from http://www.ari.org .
D&B Sales & Marketing Solutions, 2003. Available from http://www.zapdata.com .
The Air Conditioning and Refrigeration Institute, 2004. Available from http://www.ari.org .
U.S. Census Bureau. Statistics of U.S. Businesses 2001. Available from http://www.census.gov/epcd/susb/2001/US421420.HTM .
Comment about this article, ask questions, or add new information about this topic: