FINANCIAL RATIOS

Financial ratios are one of the most common tools of managerial decision making. A ratio is a comparison of one number to another—mathematically, a simple division problem. Financial ratios involve the comparison of various figures from the financial statements in order to gain information about a company's performance. It is the interpretation, rather than the calculation, that makes financial ratios a useful tool for business managers. Ratios may serve as indicators, clues, or red flags regarding noteworthy relationships between variables used to measure the firm's performance in terms of profitability, asset utilization, liquidity, leverage, or market valuation.
USE AND USERS OF RATIO ANALYSIS
There are basically two uses of financial ratio analysis: to track individual firm performance over time, and to make comparative judgments regarding firm performance. Firm performance is evaluated using trend analysis—calculating individual ratios on a per-period basis, and tracking their values over time. This analysis can be used to spot trends that may be cause for concern, such as an increasing average collection period for outstanding receivables or a decline in the firm's liquidity status. In this role, ratios serve as red flags for troublesome issues, or as benchmarks for performance measurement.
Another common usage of ratios is to make relative performance comparisons. For example, comparing a firm's profitability to that of a major competitor or observing how the firm stacks up versus industry averages enables the user to form judgments concerning key areas such as profitability or management effectiveness. Users of financial ratios include parties both internal and external to the firm. External users include security analysts, current and potential investors, creditors, competitors, and other industry observers. Internally, managers use ratio analysis to monitor performance and pinpoint strengths and weaknesses from which specific goals, objectives, and policy initiatives may be formed.
PROFITABILITY RATIOS
Perhaps the type of ratios most often used and considered by those outside
a firm are the profitability ratios. Profitability ratios provide measures
of profit performance that serve to evaluate the periodic financial
success of a firm. One of the most widely-used financial ratios is net
profit margin, also known as return on sales.
Return on sales provides a measure of bottom-line profitability. For example, a net profit margin of 6 percent means that for every dollar in sales, the firm generated six cents in net income.
Two other margin measures are gross profit margin and operating margin.
Gross margin measures the direct production costs of the firm. A gross profit margin of 30 percent would indicate that for each dollar in sales, the firm spent seventy cents in direct costs to produce the good or service that the firm sold.
Operating margin goes one step further, incorporating nonproduction costs such as selling, general, and administrative expenses of the firm. Operating profit is also commonly referred to as earnings before interest and taxes, or EBIT. An operating margin of 15 percent would indicate that the firm spent an additional fifteen cents out of every dollar in sales on nonproduction expenses, such as sales commissions paid to the firm's sales force or administrative labor expenses.
Two very important measures of the firm's profitability are return
on assets and return on equity.
Return on assets (ROA) measures how effectively the firm's assets
are used to generate profits net of expenses. An ROA of 7 percent would
mean that for each dollar in assets, the firm generated seven cents in
profits. This is an extremely useful measure of comparison among
firms's competitive performance, for it is the job of managers to
utilize the assets of the firm to produce profits.
Return on equity (ROE) measures the net return per dollar invested in the firm by the owners, the common shareholders. An ROE of 11 percent means the firm is generating an 11-cent return per dollar of net worth.
One should note that in each of the profitability ratios mentioned above, the numerator in the ratio comes from the firm's income statement. Hence, these are measures of periodic performance, covering the specific period reported in the firm's income statement. Therefore, the proper interpretation for a profitability ratio such as an ROA of 11 percent would be that, over the specific period (such as fiscal year 2004), the firm returned eleven cents on each dollar of asset investment.

Profitability Ratios
| Gross profit margin | Return on assets |
| Operating margin | Return on equity |
| Net profit margin |
ASSET UTILIZATION RATIOS
Asset utilization ratios provide measures of management effectiveness.
These ratios serve as a guide to critical factors concerning the use of
the firm's assets, inventory, and accounts receivable collections
in day-to-day operations. Asset utilization ratios are especially
important for internal monitoring concerning performance over multiple
periods, serving as warning signals or benchmarks from which meaningful
conclusions may be reached on operational issues. An example is the total
asset turnover (TAT) ratio.
This ratio offers managers a measure of how well the firm is utilizing its assets in order to generate sales revenue. An increasing TAT would be an indication that the firm is using its assets more productively. For example, if the TAT for 2003 was 2.2×, and for 2004 3×, the interpretation would follow that in 2004, the firm generated $3 in sales for each dollar of assets, an additional 80 cents in sales per dollar of asset investment over the previous year. Such change may be an indication of increased managerial effectiveness.
A similar measure is the fixed asset turnover (FAT) ratio.
Fixed assets (such as plant and equipment) are often more closely associated with direct production than are current assets (such as cash and accounts receivable), so many analysts prefer this measure of effectiveness. A FAT of 1.6× would be interpreted as the firm generated $1.60 in sales for every $1 it had in fixed assets.
Two other asset utilization ratios concern the effectiveness of management
of the firm's current assets. Inventory is an important economic
variable for management to monitor since dollars invested in inventory
have not yet resulted in any return to the firm. Inventory is an
investment, and it is important for the firm to strive to maximize its
inventory turnover. The inventory turnover ratio is used to measure this
aspect of performance.
Cost of goods sold (COGS) derives from the income statement and indicates the expense dollars attributed to the actual production of goods sold during a specified period. Inventory is a current asset on the balance sheet. Because the balance sheet represents the firm's assets and liabilities at one point in time, an average figure is often used from two successive balance sheets. Managers attempt to increase this ratio, since a higher turnover ratio indicates that the firm is going through its inventory more often due to higher sales. A turnover ratio of 4.75×, or 475 percent, means the firm sold and replaced its inventory stock more than four and one-half times during the period measured on the income statement.
One of the most critical ratios that management must monitor is days sales
outstanding (DSO), also known as average collection period.
This represents a prime example of the use of a ratio as an internal monitoring tool. Managers strive to minimize the firm's average collection period, since dollars received from customers become immediately available for reinvestment. Periodic measurement of the DSO will "red flag" a lengthening of the firm's time to collect outstanding accounts before customers get used to taking longer to pay. A DSO of thirty-six means that, on average, it takes thirty-six days to collect on the firm's outstanding accounts. This is an especially critical measure for firms in industries where extensive trade credit is offered, but any company that extends credit on sales should be aware of the DSO on a regular basis.
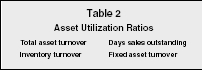
Asset Utilization Ratios
| Total asset turnover | Days sales outstanding |
| Inventory turnover | Fixed asset turnover |
LEVERAGE RATIOS
Leverage ratios, also known as capitalization ratios, provide measures of the firm's use of debt financing. These are extremely important for potential creditors, who are concerned with the firm's ability to generate the cash flow necessary to make interest payments on outstanding debt. Thus, these ratios are used extensively by analysts outside the firm to make decisions concerning the provision of new credit or the extension of existing credit arrangements. It is also important for management to monitor the firm's use of debt financing. The commitment to service outstanding debt is a fixed cost to a firm, resulting in decreased flexibility and higher break-even production rates. Therefore, the use of debt financing increases the risk associated with the firm. Managers and creditors must constantly monitor the trade-off between the additional risk that comes with borrowing money and the increased opportunities that the new capital provides. Leverage ratios provide a means of such monitoring.
Perhaps the most straightforward measure of a firm's use of debt
financing is the total-debt ratio.
It is important to recall that there are only two ways to finance the acquisition of any asset: debt (using borrowed funds) and equity (using funds from internal operations or selling stock in the company). The total debt ratio captures this idea. A debt ratio of 35 percent means that, for every dollar of assets the firm has, 35 cents was financed with borrowed money. The natural corollary is that the other 65 cents came from equity financing. This is known as the firm's capital structure—35 percent debt and 65 percent equity. Greater debt means greater leverage, and more leverage means more risk. How much debt is too much is a highly subjective question, and one that managers constantly attempt to answer. The answer depends, to a large extent, on the nature of the business or industry. Large manufacturers, who require heavy investment in fixed plant and equipment, will require higher levels of debt financing than will service firms such as insurance or advertising agencies.
The total debt of a firm consists of both long- and short-term
liabilities. Short-term (or current) liabilities are often a necessary
part of daily operations and may fluctuate regularly depending on factors
such as seasonal sales. Many creditors prefer to focus their attention on
the firm's use of long-term debt. Thus, a common variation on the
total debt ratio is the long-term debt ratio, which does not incorporate
current liabilities in the numerator.
In a similar vein, many analysts prefer a direct comparison of the
firm's capital structure. Such a measure is provided by the
debt-to-equity ratio.
This is perhaps one of the most misunderstood financial ratios, as many confuse it with the total debt ratio. A debt-to-equity ratio of 45 percent would mean that for each dollar of equity financing, the firm has 45 cents in debt financing. This does not mean that the firm has 45 percent of its total financing as debt; debt and equity percentages, together, must sum to one (100 percent of the firm's total financing). A little algebra will illustrate this point. Let x = the percent of equity financing (in decimal form), so 0.45 x is the percent of debt financing. Then x + 0.45 x = 1, and x = 0.69. So, a debt to equity ratio of 45 percent indicates that each dollar of the firm's assets are financed with 69 cents of equity and 31 cents with debt. The point here is to caution against confusing the interpretation of the debt-to-equity ratio with that of the total debt ratio.
Two other leverage ratios that are particularly important to the
firm's creditors are the times-interest-earned and the fixed-charge
coverage ratios. These measure the firm's ability to meet its
on-going commitment to service debt previously borrowed. The
times-interest-earned (TIE) ratio, also known as the EBIT coverage ratio,
provides a measure of the firm's ability to meet its interest
expenses with operating profits.
For example, a TIE of 3.6× indicates that the firm's operating profits from a recent period exceeded the total interest expenses it was required to pay by 360 percent. The higher this ratio, the more financially stable the firm and the greater the safety margin in the case of fluctuations in sales and operating expenses. This ratio is particularly important for lenders of short-term debt to the firm, since short-term debt is usually paid out of current operating revenue.
Similarly, the fixed charge coverage ratio, also known as the debt service
coverage ratio, takes into account all regular periodic obligations of the
firm.
The adjustment to the principal repayment reflects the fact that this portion of the debt repayment is not tax deductible. By including the payment of both principal and interest, the fixed charge coverage ratio provides a more conservative measure of the firm's ability to meet fixed obligations.
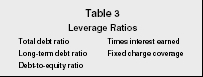
Leverage Ratios
| Total debt ratio | Times interest earned |
| Long-term debt ratio | Fixed charge coverage |
| Debt-to-equity ratio |
LIQUIDITY RATIOS
Managers and creditors must closely monitor the firm's ability to
meet short-term obligations. The liquidity ratios are measures that
indicate a firm's ability to repay short-term debt. Current
liabilities represent obligations that are typically due in one year or
less. The current and quick ratios are used to gauge a firm's
liquidity.
A current ratio of 1.5× indicates that for every dollar in current
liabilities, the firm has $1.50 in current assets. Such assets could,
theoretically, be sold and the proceeds used to satisfy the liabilities if
the firm ran short of cash. However, some current assets are more liquid
than others. Obviously, the most liquid current asset is cash. Accounts
receivable are usually collected within one to three months, but this
varies by firm and industry. The least liquid of current assets is often
inventory. Depending on the type of industry or product, some inventory
has no ready market. Since the economic definition of liquidity is the
ability to turn an asset into cash at or near fair market value, inventory
that is not easily sold will not be helpful in meeting short-term
obligations. The quick (or acid test) ratio incorporates this concern.
By excluding inventories, the quick ratio is a more strident liquidity measure than the current ratio. It is a more appropriate measure for industries that involve long product production cycles, such as in manufacturing.

Liquidity Ratios
| Current ratio | Quick ratio |
MARKET VALUE RATIOS
Managers and investors are interested in market ratios, which are used in
valuing the firm's stock. The price-earnings ratio and the
market-to-book value ratio are often used in valuation analysis. The
price/earnings ratio, universally known as the PE ratio, is one of the
most heavily-quoted statistics concerning a firm's common stock. It
is reported in the financial pages of newspapers, along with the current
value of the firm's stock price.
A note of caution is warranted concerning the calculation of PE ratios. Analysts use two different components in the denominator: trailing earnings and forecast earnings. Trailing earnings refer to the firm's reported earnings, per share, over the last twelve months of operation. Forecast earnings are based on security analyst forecasts of what they expect the firm to earn in the coming twelve-month period. Neither definition is more correct than the other; one should simply pay attention to which measure is used when consulting published PE ratios. A PE ratio of sixteen can be interpreted as investors are willing to pay $16 for $1 worth of earnings. PE ratios are used extensively, on a comparative basis, to analyze investment alternatives. In investment lingo, the PE ratio is often referred to as the firm's "multiple." A high PE is often indicative of investors's belief that the firm has very promising growth prospects, while firms in more mature industries often trade at lower multiples.
A related measure used for valuation purposes is the market-to-book value
ratio. The book value of a firm is defined as:
Technically, the book value represents the value of the firm if all the
assets were sold off, and the proceeds used to retire all outstanding
debt. The remainder would represent the equity that would be divided,
proportionally, among the firm's shareholders. Many investors like
to compare the current price of the firm's common stock with its
book, or break-up, value.
This is also known as the price/book ratio. If the ratio is greater than one, which is often the case, then the firm is trading at a premium to book value. Many investors regard a market-to-book ratio of less than one an indication of an undervalued firm. While the interpretation one draws from market ratios is highly subjective (do high PE or low PE firms make better investments?), these measures provide information that is valued both by managers and investors regarding the market price of a firm's stock.

Market Value Ratios
| Price/earnings ratio | Market-to-book ratio |
CAUTIONS ON THE USE
AND INTERPRETATION
OF FINANCIAL RATIOS
Financial ratios represent tools for insight into the performance, efficiency, and profitability of a firm. Two noteworthy issues on this subject involve ratio calculation and interpretation. For example, if someone refers to a firm's "profit margin" of 18 percent, are they referring to gross profit margin, operating margin, or net profit margin? Similarly, is a quotation of a "debt ratio" a reference to the total debt ratio, the long-term debt ratio, or the debt-to-equity ratio? These types of confusions can make the use of ratio analysis a frustrating experience.
Interpreting financial ratios should also be undertaken with care. A net profit margin of 12 percent may be outstanding for one type of industry and mediocre to poor for another. This highlights the fact that individual ratios should not be interpreted in isolation. Trend analyses should include a series of identical calculations, such as following the current ratio on a quarterly basis for two consecutive years. Ratios used for performance evaluation should always be compared to some benchmark, either an industry average or perhaps the identical ratio for the industry leader.
Another factor in ratio interpretation is for users to identify whether individual components, such as net income or current assets, originate from the firm's income statement or balance sheet. The income statement reports performance over a specified period of time, while the balance sheet gives static measurement at a single point in time. These issues should be recognized when one attempts to interpret the results of ratio calculations.
Despite these issues, financial ratios remain useful tools for both internal and external evaluations of key aspects of a firm's performance. A working knowledge and ability to use and interpret ratios remains a fundamental aspect of effective financial management. The value of financial ratios to investors became even more apparent during the stock market decline of 2000, when the bottom dropped out of the soaring "dot.com" economy. Throughout the long run-up, some financial analysts warned that the stock prices of many technology companies—particularly Internet start-up businesses—were overvalued based on the traditional rules of ratio analysis. Yet investors largely ignored such warnings and continued to flock to these companies in hopes of making a quick return. In the end, however, it became clear that the old rules still applied, and that financial ratios remained an important means of measuring, comparing, and predicting firm performance.
SEE ALSO: Balance Sheets ; Cash Flow Analysis and Statement ; Financial Issues for Managers ; Income Statements
Howard Finch
Revised by Laurie Hillstrom
FURTHER READING:
Fridson, Martin, and Fernando Alvarez. Financial Statement Analysis: A Practitioner's Guide. New York: John Wiley, 2002.
Harrington, Diana R. Corporate Financial Analysis: Decisions in a Global Environment. 4th ed. Chicago: Richard D. Irwin, Inc., 1993.
Helfert, Erich A. Techniques of Financial Analysis: A Modern Approach. 9th ed. Chicago: Richard D. Irwin, Inc., 1997.
NetMBA.com. "Financial Ratios." Available from < http://www.netmba.com/finance/financial/ratios >.