ORGANIZATIONAL CHART

An organizational chart is a pictorial representation of a company's structure and reporting relationships. This chart can provide a great deal of information and may help organizational members understand the overall structure of the organization and its strategy. This entry describes how organizational charts are constructed, including the software that can be used to create them; what information the organizational chart provides; the benefits of making the chart available inside and outside of the organization; and the circumstances under which a chart is likely to change.
CONSTRUCTING AN
ORGANIZATIONAL CHART
All organizational charts have similar elements that allow them to be easily interpreted and understood by people inside and outside of the organization. Charts consist of shapes and lines that represent work units and their hierarchy. See Figure 1 for an example of an organizational chart.
The basic building block of an organizational chart is the rectangle, which can represent a person or a work unit (e.g., a department). For example, as shown in figure 1, the CEO position has a separate rectangle that denotes one person, but the entire Public and Community Relations Department is also represented by one rectangle. If the outline of the rectangle is dashed, this means that a position is open and must be filled, as with one of the manager positions. If a rectangle is divided, and two or more names are in it, this may indicate job sharing or that multiple people are responsible for the outcomes associated with this position. In the figure, W. Allen and P. Lloyd are comanagers in one area of the Production and Services Marketing Department, where they have a job sharing arrangement and each works part-time hours.
The boxes may contain as much or as little information as the organization prefers. They may include a job title, an employee's name, an employee's department, or even information such as job tenure, education, or salary. Alternatively, a chart may be created without rectangles, with names or titles standing alone. The three employees in the Public and Community Relations Department are listed with their names not in rectangles. This often is done to save space on the chart.
Rectangles on an organizational chart are linked with solid or dashed lines. A solid line indicates a formal, direct relationship and a dashed line indicates that one employee or department advises another or has some other sort of indirect relationship. Note that all but one of the reporting relationships in figure 1 are formal. L. Jiminez has a dashed line to the Product and Services Marketing Department, which means that she sometimes will work for that department or will report to that department's manager. When lines represent a tree structure—when two or more rectangles are linked to another with multiple lines—this indicates that several individuals or departments report to one supervisor. For instance, the tree structure represents the relationship between the CEO and the three top managers who report to the CEO. Finally, a rectangle that is attached horizontally outside of the vertical hierarchy typically indicates an assistant or staff person. In the example, this is represented by the executive secretary to the CEO.
While organizational charts can be created by hand, most are created using computer software. Although it may be labor intensive, organizational charts can be created using drawing tools in a word processing program. Microsoft's PowerPoint presentation software allows for the creation of organizational charts, although there is little space available to create large charts. Specific software exists for creating
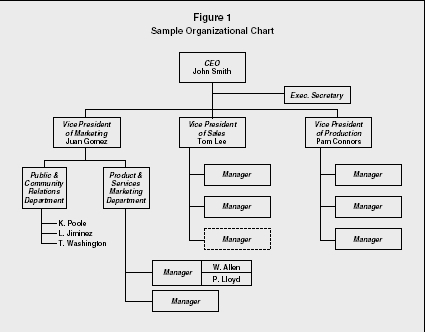
Sample Organizational Chart
INFORMATION IN THE
ORGANIZATIONAL CHART
The organizational chart provides a great deal of information about the organization as a whole and the interaction of its parts. From a chart, one can see the organization's structure, its hierarchy, the degree to which it is centralized or decentralized, and its chain of command. Each of these is summarized below.
ORGANIZATIONAL STRUCTURE.
First, organizational charts detail an organization's structure. It may be functional, in which work units are divided based on what they do and named after those functions (e.g., research and development, marketing, sales, etc.). The structure may be divisional, based on product, customers served, or geographic location. Finally, an organizational chart may represent a matrix structure, in which work units are organized by both function and division.
ORGANIZATIONAL HIERARCHY AND CENTRALIZATION.
In addition to outlining the type of organizational structure, the organizational chart also indicates the number of management levels, whether the organizational structure is tall or flat, and the span of control at each level. Tall organizations have many levels of middle management and small spans of control. Each manager supervises and directs few employees, and the chain of command has many managers. Conversely, a flat organization has fewer management levels and larger spans of control. Because managers supervise more employees, employees tend to have more autonomy and discretion in their jobs.
Organizational hierarchy and the number of management levels often indicates the degree of centralization within an organization. Centralized organizations are those in which most of the decision making occurs by a few people at the top of the hierarchy. This typically creates a top-down management structure, in which top-level managers strongly control the direction of the workplace through their decisions and supervision. Conversely, an organization with a decentralized structure allows greater decision-making and authority at lower organizational levels. Highly decentralized companies may have units that operate nearly independently of one another. The degree of hierarchy on an organization's chart normally will help one to determine the degree of centralization or decentralization within its structure. Typically, the taller the organization, the more centralized it is; flatter organizations generally require more decentralization, because managers each have broader spans of control and cannot direct and closely supervise so many people. Additionally, as previously described, the organization's structure may indicate the degree of centralization. Functional structures tend to be more centralized than do divisional structures.
CHAIN OF COMMAND.
The vertical and horizontal lines connecting the rectangles on an organizational chart indicate reporting relationships and chain of command. That is, they indicate which employees are directly responsible for the supervision of others and who has ultimate accountability for a group of employees.
AVAILABILITY OF THE
ORGANIZATIONAL CHART
Many companies make their organizational chart available to their employees and to the public. The members of the public who may have an interest in a company's organizational chart include company shareholders, investors, distributors and suppliers, customers, potential job applicants, and even community members.
Employees typically have access to the organizational chart through materials provided by the organization (e.g., the employee handbook) or through a company Web site. Providing the organizational chart to employees allows them to see the structure of the organization and to better understand the entirety of the organization and how their position or work unit fits into it. Additionally, the observable chain of command can help an employee to understand to whom they are accountable. This may aid the company in diagnosing organizational problems by being able to pinpoint accountability.
Many organizations now make their organizational charts available for viewing by the general public, either online or in corporate literature for shareholders and prospective employees. By providing this information, these external stakeholders and other interested parties may gain a better understanding of the organization. The chart may give them a sense of the organization's operations, workforce, or even its strategy.
CHANGES TO THE
ORGANIZATIONAL CHART
There are a number of reasons that an organizational chart might change since the chart must reflect any alterations to the organizational structure. The structure may change due to a company's growth, decline, or restructuring.
GROWTH OR DECLINE.
All organizations progress through a life cycle of growth, maturity, and decline, and in each stage the organizational structure is likely to be different. In the growth stage, the company is expanding rapidly, gaining customers and market share. Growth will occur when a company is just beginning and products and services are gaining a foothold. It may also occur when an organization develops a new product or expands into new markets, perhaps in other countries. With growth, the organizational chart will change. Levels of management may be added, along with new departments.
In maturity, an organization is no longer growing at a rapid rate and is stable in its production and sales. The organization may introduce minor changes to a product or service, but there are unlikely to be major changes to its structure.
In the decline stage, the organization is losing ground in the marketplace. It may be that its products or services are becoming obsolete or that its competitors are taking over the market. In decline, the organization may shed levels of management or positions in all divisions. Additionally, it may outsource work in some areas and thus remove those departments from its structure. Or, as certain products or services are dropped from the organization, the work units needed for these products and services also may be eliminated. Thus, in the decline stage the organizational chart is likely to be streamlined or shrunken.
RESTRUCTURING.
Restructuring occurs when an organization reduces its workforce by eliminating large numbers of management and line employees. Restructuring typically occurs when information technology can be used to achieve the same productivity outcomes with fewer people. With restructuring, management levels may be eliminated entirely, or entire departments may be removed. This particularly is true if outsourcing accompanies the restructuring.
SEE ALSO: Management Levels ; Organizational Structure
Marcia J. Simmering
FURTHER READING:
DuBrin, Andrew J. Essentials of Management. 7th ed. Cincinnati, OH: Thomson/South-Western, 2004.
Jones, Gareth R., and Jennifer M. George. Contemporary Management. 4th ed. New York: McGraw-Hill/Irwin, 2006.
Rue, Leslie W., and Lloyd L. Byars. Management: Skills and Application. 10th ed. New York: McGraw-Hill/Irwin, 2003.
Williams, Chuck. Management. 3rd ed. Mason, OH: Thomson/South-Western, 2005.