STATISTICAL PROCESS
CONTROL AND SIX SIGMA
SIX SIGMA
The term six sigma (6σ) originated as a performance measure or a measure of quality. Using six sigma, process goals are set in parts per million (PPM) in all areas of the production process. Since its origin, six sigma has now evolved into a methodology for improving business efficiency and effectiveness by focusing on productivity, cost reduction, and enhanced quality.
Six Sigma has its roots back with the efforts of Joseph Juran and W. Edwards Deming. Their programs for Zero Defects and Total Quality Management in Japan, lead to the adoption of the six sigma philosophy by Motorola. Motorola was able to achieve a 200-fold improvement in production quality and saved a reported $2.2 billion using this tool. General Electric has also become the strong proponent of six sigma where it claims extensive successes. GE used six sigma during the reign of Jack Welch, where he made it the biggest corporate initiative in GE's history and received global recognition. Other users include Texas Instruments and Allied Signal. Allied took six sigma to an even higher level by incorporating it not just in production but by making it a system of leadership. Other current users include JP Morgan Chase, Sun Microsystems, American Express, and Lloyds TSB. Today, six sigma is branded as a management methodology that utilizes measures as a foundational tool for business process reengineering.
The name six sigma comes from the statistical use of the sigma (σ) symbol, which denotes standard deviations. The six identifies the number of standard deviations around the mean. Hence, six sigma says that you have to go out beyond six standard deviations around the mean before you find failure. With a high enough number of sigmas (beyond six), you would approach the point of "zero defects." For example, a move from 3σ to 4σ represents an 11-fold improvement; a move from 4σ to 5σ represents another 27-fold improvement; and a move from 5σ to 6σ represents an additional 69-fold improvement. Thus the overall improvement from 3σ to 6σ is more than 20,000-fold.
At the 3σ level, the number of defects per million totals 66,807 (or 93.3 percent accuracy). At the 4σ level the number of defects drops to 6,210 (or 99.4 percent accuracy). At the 5σ level the number of defects drops still further to 233 (or 99.97 percent accuracy). At the 6σ level the number of defects would be 3.4 per million. This equates to a 99.9997 percent accuracy. In today's world, where 98 percent or 99 percent accuracy is considered excellent, 6σ is now becoming the universally recognized standard of quality.
THE PRINCIPLES OF SIX SIGMA
A key principle of six sigma is measurement. Unfortunately that also means that if you measure the wrong things, you'll get the wrong results. For example, measuring throughput may speed up production, but at the cost of quality. Measuring quality may increase quality, but decrease customer service. So one of the toughest challenges in six sigma measurement is to identify the measurement system that will trigger the correct collection of responses.
A second key principle of measures in the six sigma environment is that all the measures should be openly visible. Openly displaying all measures on charts and graphs is a primary motivator toward the correct response.
A third principle to remember is that the change curve applies. When change happens, performance will initially go down before it recovers and goes back up. This drop in performance is often scary, but a little patience will soon see its recovery.
A principle of success or failure in the six sigma world is the requirement for cultural change or change readiness. If the organization is not primed for change, then an environment for change must be instilled prior to starting six sigma, or the project is doomed to failure. This requires training, team bonding, and team based goal setting. The resistance that exists because of a lack of understanding of what the six sigma process is attempting to achieve, can be avoided with proper training.
Six sigma concentrates on measuring and improving those outputs that are critical to the customer. The tools to accomplish this include a range of statistical methodologies that are focused on continuous improvement using a statistical thinking paradigm. This paradigm includes the following principles:
- Everything is a process.
- All processes have variations that are inherent within them.
- Data analysis is a key tool in understanding the variations in the process and in identifying improvement opportunities.
It is in the management methodology where the key, underlying benefits of six sigma can be found, which includes a problem solving and process optimization methodology. Six sigma creates a leadership vision utilizing a set of metrics and goals to improve business results by using a systematic five-phased problem solving methodology. There are two common problem solving project management methodologies that are commonly associated with six sigma. The first is DMAIC (Define, Measure, Analyze, Improve, Control), and the second is DMADV (Define, Measure, Analyze, Design, Verify). We will discuss the most common, DMAIC.
Six sigma is a measurement-based strategy that focuses on reducing variations through monitoring and measurement tools. It is based on a philosophy that holds that every process can and should be repeatedly evaluated and significantly improved, with a focus on time required, resources, quality, cost, etc. The philosophy prepares employees with the best available problem-solving tools and methodologies using the five-phased DMAIC process. Explaining each of the steps in the process in more detail we have:
- Define—At the first stages of the process we look for and identify poorly performing areas of a company. We then target the projects with the best return and develop articulated problem and objective statements that have a positive financial impact on the company.
- Measure—At this stage we are trying to tie down the process under consideration. Where does it start and end? What should we be measuring to identify the deviation? What data characteristics are repeatable and identifiable? What is the capability of the process? We use tools like process mapping, flow charting, and FEMA (Failure Model Effects Analysis). We develop a baseline for the targeted area and implement an appropriate measurement system.
- Analyze—Having identified the who and what of this problem, we now target the where, when, and why of the defects in the process. We use appropriate statistical analysis tools, scatter plots, SPC and SQC, Input / Output matrixes, hypothesis testing, etc., and attempt to accurately understand what is happening in the process.
- Improve—At this point we should have identified the critical factors that are causing failure in the process. And, through the use of experiments, we can systematically design a corrective process that should generate the desired level of improvement. This improvement will then be monitored to assure success.
- Control—In the control phase we implement process control tools that can manage and monitor the process on an ongoing basis. The DMAIC process is now in full operation, but it does not stop here. The continuous monitoring of the process will not only assure the success of this change process, but it will also identify future opportunities for improvement.
Six sigma is an organization-wide strategy that develops employees and gives them the tools and capabilities to solve complex problems in a rapid fashion. Employees now have the capabilities to improve overall performance through their step-by-step improvements, always from a customer and financial perspective. Six sigma helps employees use statistical and measurement tools to deliver breakthrough results throughout the organization.
Six sigma requires full participation, from senior management to the factory floor workers. Each assumes a specific role in the six sigma process. At the top of the pecking order we find the Champions. These individuals are responsible for coordinating the business goals and objectives, which are set towards achieving the six sigma standard within the organization. They are responsible for providing the logistics and informational resources that will be needed for the successful completion of the project. They also select the project and identify the scope of the projects to be worked on. They identify the team that should work on the project, and work to remove barriers that may block the success of the project.
Most companies go on to use a classification methodology similar to the one created by Motorola to describe the abilities of their six sigma user. For example, classifications like Green Belt (part-time user) or Black Belt (full-time user) are common. Each level requires an improved mastery of the six sigma tools and skill set, as well as the roles and responsibilities of the individual in the improvement process. The objective is to create a methodology for defining the skill set of the users.
The Master Black Belt is the guru of the six sigma methodology. This individual works as a coach, leader, and teacher for the other individuals on the team. The Black Belt is the change agent for the six sigma process. This individual is a high performer and has a dedicated position that is responsible for six sigma projects. The Green Belt is a specially trained member of the team and usually sits on a function-specific part of the organization. The Green Belt works under the Black Belt on specific aspects of the six sigma projects. The Yellow Belt represents the remainder of the organization, which has been trained on some of the basic skills. These individuals are working their way towards becoming knowledgeable in the six sigma process.
Each of the successful six sigma users have customized the process to fit their own culture and methodology. In order to accomplish this, it is important to identify the key business goals and objectives of the organization, and then to adapt the six sigma methodology and philosophy to fit this goal set. We need to develop an action plan identifying how we are going to focus the six sigma tool so as to focus on the big returns and avoid any waste in investment. Hence, it is useful to identify the areas where six sigma performs well. These include:
- Transformation of the level of customer awareness and expectation throughout all the employees of the organization.
- Improved customer-supplier relationship.
- Drives operational process improvements with savings in cost, improvements in service and productivity, and increased returns.
- Drives information flow improvements.
- Drives a deeper, organization wide understanding of the organization's operation.
- Improved sales force effectiveness.
- Introduces all employees to new tools that will enhance performance.
- Provides a vehicle for the development of a training program.
Six sigma is not an all or nothing venture. Six sigma is a collection of tools and you pick selectively from those tools in order to gain the desired result. It is also not an increase in the level of organization bureaucracy. In fact, if use properly, it will reduce the level of bureaucracy within the organization.
STATISTICAL PROCESS CONTROL
Statistical Process Control (SPC), and its companion Statistical Quality Control (SQC), are tools utilized by a six sigma process. They are not the invented creations of the Japanese or of Edward Deming. However, Ed Deming taught SPC techniques to Japanese manufacturing, and, as a result, has become the default father of the SPC process. The original objective of SPC is to provide productivity and quality information about a production process real-time. The focus was on process control and continuous improvement. The operators become their own inspectors and control their own processes.
The SPC process should collect data and report results as the process is occurring, so that immediate action can be taken. This should help a process, and its quality measures, avoid straying beyond acceptable limits and would avoid the production of bad parts. When appropriately applied, SPC can virtually eliminate the production of defective parts. Additionally, SPC creates visibility of the cause of the failure. Since an operator is able to immediately recognize that a failure is occurring, he would be able to react to that failure and observe the cause of the failure, and then take corrective action. As Peter Drucker emphasizes, the "operators become the 'owners' of not just the process, but also the parts they produce."
Because of its success, SPC has found application in other industries, including service industries, transportation industries, deliver services, and can even be found in fast food and baggage handling. For example, on-time delivery performance can be monitored on an SPC chart.
Within the SPC process there are several tools. These tools include a change management process, the collection of data, and the display of the data. In the change management process we find the use of PDCA (Plan-Do-Check-Act). The objective is to solve problems by trial and error. The process includes (P) planning a work change, (D) executing the change, (C) monitoring the effects of the change to assure that the desired results are occurring, and taking corrective (A) action in the event that the desired results are not occurring—in effect repeating the PDCA cycle. The PDCA cycle is repeated until the error is reduced to zero.
In the SPC data collection process, the objective is to collect the necessary data that will be needed to validate that a specific process is occurring correctly. The methodology for measurement is established at the point where the appropriate data is collected. Only the data that is required for the monitoring of the process is collected. An analysis of the specific reasons for collection the data is important because any additional, unnecessary data collection is considered to be a waste. The accuracy of the measurement process is also confirmed.
There are several tools available for the display of SPC data. These include:
- Graphs and Charts are used to display trends or to summarize the data. These tend to be bar or line graphs that report on a specific parameter of performance.
- Check Sheets or Tally Sheets are used to take the raw data and reorganize it into specific categories that are being observed.
- Histograms or Frequency distribution charts are used to translate raw data into a pictorial display showing the performance of specific quality characteristics.
- Pareto Principles are used to prioritize the contribution effect of specific quality problems. This tool assists in identifying which problems have the largest impact on a specific quality problem under study.
- Brainstorming is used to generate ideas by taking advantage of the synergistic power of a team of people.
- Ishikawa Diagrams (Fishbone Charts) are used to create problem and solution visibility by grouping problem causes into branches. Often this is referred to as a cause and effect diagram. Using this tool in conjunction with the PDCA process helps to narrow down the root cause.
- Control Charts are used to validate that the variation of measurement of a specific parameter is kept within a set of control limits.
In SPC, the most critical part of the process is the validation that you are measuring the right thing and thereby motivating the correct response. Additionally, if one measure can take the place of several measures, then that one measure should be identified, thereby simplifying the measurement process. Once a measurement has been selected, then we are ready to set up the data collection process and to establish control charts that will monitor the performance of this data.
The control charts are built around a specific product parameter that requires monitoring because of its impact on the over-all quality of the product. The following discussion is an extremely basic overview of the SPC process, and should not be considered to be sufficient for implementing an SPC process. Rather, this discussion is simply intended to give the reader and basic overview of the process.
The next step in the SPC process is to establish a set of control variables that includes an average (X) and a range (R). These can be established by going to the drawings are reviewing the initial part specifications using the expected value as X and the tolerance range as R. Or, these variables can be established using historical values and calculating the historical average (X) and range (R) for the data.
Having established an X and R value, we can calculate an Upper Control
Limit (UCL) and a Lower Control Limit (LCL).
UCL = X + R
LCL = X-R
From these values, a pair of control charts is created. These charts are used to plot the SPC data as it occurs. They are used as a visual tool to monitor the process. Chart 1 is an example of two basic SPC charts which are monitoring a process. For these charts we will use X=1.23 and R=.45.
From Chart 1 we can see how the measurement data is recorded on the chart at the time each measurement occurs. The objectives behind this data collection process are several. One is to catch outliers in the
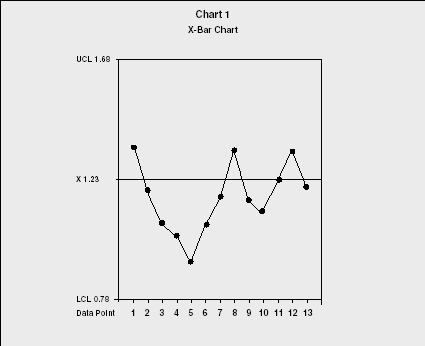
X-Bar Chart
Another methodology for applying SPC processes is by collecting data, not on every event, but on a random sampling of the event. This occurs when there is a large volume of activity and the time required to measure each event is too burdensome. A statistical sample is taken, and from that sample the average of the sample data (X) and the range of that sample (R = highest minus lowest measure) is calculated. For example, if our random sample size was 5 data points and our sample included the measures of 1.4, 1.45, 1.2, 1.3, and 1.65, then X = 1.4 and R = 1.65−1.2 = .45. This X value would then be the first data point plotted on Chart 1.
Using the statistical random sample, a Range chart would also need to be created. Chart 2 is an example of a range chart and the first data point of Chart would be the plot of the data corresponding to the example given. For this example, the lower limit is zero, which states that there is no deviation between each of the data points of that sample. The center point is R (.45) and the UCL is equal to 2 time R (.90).
In the example of the Range Chart (R Chart), the lower the value is better. A lot of vibration all over the chart suggests that the process may be going out of control. Also, a trend moving upwards as we see from data points 5 through 10 would indicate that a process is starting to go out of control and corrective action should be taken immediately.
With the X-Bar and R Charts, we can now create summarized reports, like the Histograms and Frequency Distributions that were discussed earlier. This allows a long term, summarized perspective of the process, rather than the chronological time-line that the X-Bar and R Charts offer.
There are systems and philosophies that go beyond SPC, which includes "Design of Experiments (DOE)" and "Concept Management." In DOE the
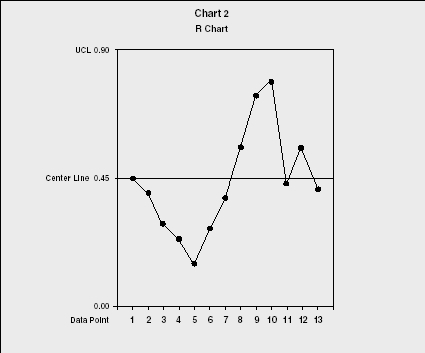
R Chart
Six Sigma, and one of it's primary tools SPC, have their roots in Japanese manufacturing process. But they have since become a key quality standard for the United States and Europe through their use of management principles and effective measurement tools.
SEE ALSO: Quality and Total Quality Management ; Quality Gurus
Gerhard Plenert
FURTHER READING:
Antony, Dr. Jiju, and Mukkarram Bhaiji. "Key Ingredients for a Successful Six Sigma Program." Available from http://one-sixsigma.com.
Bothe, Keki R. World Class Quality. NY: AMACOM, 1991.
Drucker, Peter. "The Emerging Theory of Manufacturing." Harvard Business Review, May/June 1990, 95.
Kullmann, John. "An Introduction to Six Sigma." Available from http://onesixsigma.com.
Plenert, Gerhard. The eManager: Value Chain Management in an eCommerce World. Dublin, Ireland: Blackhall Publishing, 2001.
——. International Operations Management. Copenhagen, Denmark: Copenhagen Business School Press, 2002.
Plenert, Gerhard, and Shozo Hibino. Making Innovation Happen: Concept Management Through Integration. DelRay Beach, FL: St. Lucie Press, 1997.
Pyzdek, Thomas. "Cargo Cult Six Sigma." Quality Digest.
Robustelli, Peter, and John Kullmann. "Implementing Six Sigma to Affect Lasting Change." Available from http://onesixsigma.com.
Ross, Joel E. Total Quality Management. Delray Beach, FL: St. Lucie Press, 1995.
Venturehaus. "An Introduction to Six Sigma." Available from http://onesixsigma.com.
Comment about this article, ask questions, or add new information about this topic: