Parts Manufacturer
BUSINESS PLAN
ZEMENS METAL CORPORATION
177 Hill St.
Rochester, MN 87882
This business plan is a good example of an established business re-visiting goals and objectives to achieve continuous improvment. Note that all phases of operation, from production and safety to cash flow and employee relations, are examined for opportunities for growth. This an exemplary plan for a business in any industry to use as a starting point for measuring their own business' health and well-being.
- COMPANY VISION
- COMPANY MISSION STATEMENT
- DEPARTMENTAL GOALS AND MEASURES
- MARKET STRATEGY AND FUTURE PLANS
- FINANCIAL PROJECTIONS
COMPANY VISION
To set the standard for industries we serve and to be the organization against which others are measured.
To continually strive for excellence in all that we do.
To provide the highest quality deep drawn components and assemblies to our customers.
To provide the highest level of customer service in the industry.
To maintain the highest standards of honesty and integrity in all our relationships.
COMPANY MISSION STATEMENT
It is the goal of Zemens Metal Corporation to set the standard for the industries we serve and to be the organization against which others are measured.
The following principles will dictate our actions as we continue our quest for excellence in all we do:
- Strive to achieve a company-wide commitment to continuous improvement in all areas of our business.
- Maintain the highest standards of honesty and integrity in all relationships with our employees, customers, suppliers, service groups and community.
- Utilize the best technologies in mechanical, statistical and management techniques to effectively bring high quality products to the marketplace and to ensure employee and customer satisfaction.
- Embrace change as a vehicle to the future.
- Dedicate ourselves to the principle of craftsmanship and the notion that the customers, suppliers and the work force, being brought together with mutual respect for each one's contribution, has created today what is Zemens Metal Corporation.
DEPARTMENTAL GOALS AND MEASURES
The following section contains the goals which have been identified for each individual department within the company. The method of measuring each goal is also identified. It is assumed that attainment of these goals supports our efforts towards continuous improvement andmaintains our status as the premier manufacturer of deep drawn metal components. Implied in all of these goals is our commitment to the highest level of service to our customers.
The goals established should not be viewed as static; rather they should be seen as a living expression of our attempts to identify opportunities for ongoing improvement and growth of the company.
These goals will be assessed on a regular basis (i.e. quarterly) and modified, deleted, or new goals established as current situations dictate.
Engineering Department
I. TO INTEGRATE ENGINEERING FUNCTION IN All ASPECTS OF A JOB-QUOTING, DESIGN, TOOLING, GAUGING, PRODUCTION, AND CLEANING/SHIPPING.
Goal
Increase engineering's technical knowledge of their total function in the manufacturing of deep drawn metal components and assemblies.
Current
We currently have a total quality systems manual which details the comprehensive function of the Engineering Department.
Measures
- Adhere to the advanced quality principles detailed in the Quality Manual.
- Maintain engineering turnaround time of 24 hours on quotes.
- Establish a thru production feedback loop/team consisting of an engineer, quality represen tative, toolmaker and setup technician. This team will meet during the engineering, toolmaking and first setup of the job and document these meetings. The goal is 100% compliance by June 1, 1995. This will be monitored by the quality systems manager as part of the yearly audit of the TQS Plan.
- Assess setup time and running efficiency between actuals and quote estimate. This data will be gathered starting 1/1/96 after proper education of production personnel.
Tooling Department
1. ANALYSIS OF INTERNAL vs. EXTERNAL TOOLING USE AND EFFICIENCY OF BOTH
Goal
Assure the healthy and proper mix of internal and external tooling to provide for the company's long term profitability.
Current
ABD is our first outside source for new tooling based on their ability to meet our budget and time frame.
Measures
- Actual cost of tooling versus budgeted tooling.
- Delivery date versus stated need time specified on sales order.
Apprenticeship Program
Goal
To have an established training program, approved by the Department of Labor, which meets our needs for quality tool & die makers.
Current
We currently have three people enrolled in our training program.
Measures
- To have one person at each of the 4 levels of the program.
- Apprentices are adhering to the established time lines.
- Regular (semiannual) evaluation of an apprentice's performance within the program.
- Yearly assessment of the effectiveness of the program with any necessary modifications reviewed.
Production Department
SAFETY
Goal
Zero accidents (injury-free work environment).
Current
3 year (1992-1994) average of 26 accidents per year.
Measures
-
Reduction of 5 accidents per year to goal.
- 1995 - 21 meets, 19 exceeds, 17 excellent
- 1996 - 16 meets, 14 exceeds, 12 excellent
- 1997 - 11 meets, 9 exceeds, 7 excellent
- Measure quarterly during course of year and publicize.
HOUSEKEEPING
Goal
On a scale of 1 (low) to 10 (high) we strive for perfection, but establish a minimum standard of 8 on this scale.
Current
No current measure.
Measure
A housekeeping committee will be established and will rate each department on a monthly basis. A deduction of .5 points will be taken for each housekeeping deficiency. Department performance, and the company as a whole performance, will be publicized monthly.
PRESS UPTIME
Goal
A goal of 75% uptime of gross press capacity (# of presses x 20 hours = total press time per day x 5 = gross capacity).
Current
We currently average 60% uptime of available hours worked based on # of presses x 17 hours
Measure
We will measure uptime for each of our 3 production units. This measure will be the uptime hours as a percentage of gross press capacity.
COMMUNICATION
Goal
A board visible within the plant and office areas to show performance in the areas of safety, housekeeping, and press uptime on a monthly basis. Discussion at State-of-the-Business Meeting three times yearly.
Measure
Board kept current.
IDENTIFY NEEDS FOR IMPROVEMENT
Goal
Develop an effective plan to identify individual strengths and weaknesses as they relate to standards established for the department.
Measure
A matrix of essential and desired skills for each job will be established and each team member will be assessed in these areas during their semiannual performance review.
RECOGNITION OF POSITIVE PERFORMANCE
Goal
Consistent and regular recognition (feedback) of positive performance. This recognition can be tangible rewards or intangible rewards.
Measure
Written feedback for outstanding performance will be placed in each team members personnel file.
Quality Department
PROMOTE QUALITY THROUGHOUT THE ORGANIZATION
Goal
Increased awareness of quality issues for all Zemens Metal personnel.
Current
We currently compile monthly scrap reports.
Measures
- Attain QS-9000 certification in 1995. Need a milestone record and list of achievements towards milestones.
- Pursue Malcolm-Baldridge Award. Need a milestone record and list of achievements towards milestones.
- Item related to quality improvements in each newsletter.
-
Monthly internal quality newsletter.
Integration results - examples include:- Production - scrap report, production uptime.
- Shipping - periodic audit once a quarter.
-
Reduce total scrap (rejects, sorting & rework costs, machine
scrap)
- 1995 - 2.05% (of sales)
- 1996 - 1.90% (of sales)
- 1997 - 1.80% (of sales)
-
Audit the execution of the quality systems as detailed in the existing
Quality Manual on an annual basis. This process will be segmented for
quarterly review. The results of the audit will be provided to senior
management who, in turn, will review with department managers. The
quality systems manager will monitor adherence to any follow-up actions
identified through the audit. The total quality goal will be:
- 85% compliance - 1995
- 90% compliance - 1996
- 95% compliance - 1997
Shipping Department
TO IDENTIFY PHYSICAL AND PERFORMANCE BARRIERS WHICH IMPEDE ON-TIME SHIPMENT
Goal
To have 100% on-time shipment.
Current
We estimate that we are near 95-96% on-time at this time.
Measures
- Assess daily shipments versus shipping schedule.
-
Any product received by Shipping (including outside services) will be
packaged and ready to ship within 24 hours.
- 24 hours - meets
- 20 hours - exceeds
- 16 hours - excellent
Sales Department
IMPROVE OUR RESPONSE TO CUSTOMERS
Goals
-
To improve customer service through:
- Accurate lead times.
- Streamlined communications
- To improve our quote and no quote ratio.
- Monitor customer potential.
- To increase sales.
Measures
- Quotes will be completed within 3 days. Quote log maintained by Sales.
- Production job new order completed within 4-6 weeks. This will be measured by customer order and initial M.F.C. ship date.
- Improve the ratio of accepted quotes by 15% over 1993 and 1994 levels without reducing the number of new tooling jobs.
- Sales to have regular contact with new and existing customers regarding availability of other work possible within that company. Sales will provide monthly feedback to senior management regarding their assessment of long term potential for selected customers. Log kept available at all times updated by Sales at all times.
-
Sales will increase to the following levels:
- 1995 - $21.0MM
- 1996 - $24.0MM
- 1997 - $28.0MM
- Customer surveys will be completed on a yearly basis.
Purchasing Department
TO ESTABLISH STANDARDS FOR INVENTORY TURN RATIOS. TO IMPROVE LEVEL OF COORDINATION WITH SUPPLIERS TO MANAGE COSTS AND ASSIST WITH TURN RATIO GOAL.
Goal
To have a 7-10 day period for material on-site to production. 10 days (fully effective), 8 days (exceeds), 7 days (exceptional). Zero stock outs.
Current
We are currently at 20 days. We currently have stock outs and need to establish baseline incidence figures.
Measures
- The Purchasing Department will gather cumulative data related to date material received and date used in production. This information will be reported weekly.
- Measure stock outs - zero stock outs. Reported weekly.
Accounting Department
TO MAINTAIN A FINANCIAL REPORTING SYSTEM TO SERVE AS A BASIS FOR CONTINUOUS IMPROVEMENT
Goals
- Accurate and timely reports.
- Develop a costing system with senior management.
Measures
- End of month report available within 10 working days from last day of the month. This report will include trends against goals and action items to address trends.
- Preliminary report on a costing system by 7/1/95.
Human Resources Department
MAINTAIN AN EFFECTIVE WORK FORCE MAINTAIN EFFECTIVE AND TIMELY COMMUNICATIONS
Goals
- To have a well trained and sufficient work force.
- To have a well informed work force.
Measures
- Newsletter - 4 times a year (January, April, July and October).
- State-of-the-Business Meetings - 3 times a year (January, May and September).
- Develop and monitor apprenticeship programs in tool & die and setup specialist.
- Provide feedback to senior management on cost of benefits, benefit enhancements, and comparison of M.F.C. wage and benefits with local companies and PMA companies. This will be done at least once a year.
- Assist all members of the Zemens Metal team in remaining cognizant of our responsibility to provide timely and appropriate motivational enhancements to all Zemens Metal personnel.
MARKE STRATEGY AND FUTURE PLANS
Zemens Metal Corporation is keenly aware of the continued and increasing trend of globalization within the automotive industry. Competitive pricing, cost containment and continuous improvement are on-going initiatives; the successful supplier now has to satisfy the industry's demands for shorter lead times coupled with more frequent, on-time deliveries.
Zemens Metal will blend its' sales, scheduling, purchasing and shipping departments towards the goal of providing on-time parts within 4-6 weeks of order placement. To accomplish this goal, the following changes will be made:
- Sales will get more involved with customer releasing departments to obtain realistic part usage rates and build schedules.
- Scheduling will encompass three separate, but interactive areas: order entry, produc tion and shipping scheduling, and customer service.
- Purchasing will assume responsibility for all outside services including, but not limited to, expediting and receiving functions.
- Shipping will focus on cleaning parts, packaging and shipping.
While our dependency on the highly cyclical automotive market continues, it has not been a detriment to us. In fact, it has fueled our rapid growth in the past few years. Nevertheless, we continue to diversify our product base outside the automotive industry and have set a goal of 12% non-automotive business by 1997. To accomplish this, we will seek out sales agencies associated with diverse industries in various geographic areas with a goal of adding at least one new agency per year. We will attend at least two domestic trade shows per year, one of which will be in an area new to us, to continue our exposure in new markets and industries.
Zemens Metal realizes that, as it moves into new markets and expands its' customer base, competition with other metal forming companies will intensify. Our efforts towards continuous improvement in the areas of pricing, quality and delivery are constants. We will focus future efforts on developing new processes and capabilities which allow us to expand our product Offerings. Along these lines, securing work for our new, larger presses and expanding our value-added assembly capabilities will allow us to offer a wide range of complete products to our customers. With all projects, our emphasis will be on high volume and emerging product lines while minimizing our reliance on maturing product lines.
Integral to all future plans is maintaining the highest level of customer service. We will intensify our efforts to cultivate long-term relationships with existing and new customers by involving personnel at all levels of our organization in assuring customer satisfaction with our products and service. We will continue to monitor our performance and customer satisfaction with an annual survey sent to all customers in the fall of each year. Our goal will be to improve our ratings by 1/4 of 1 point (5 point scale) in each of the next 3 years.
Our sales dollar objectives, along with targeted automotive to non-automotive sales mix, is shown below. We will monitor our margins closely and, if it becomes apparent that shifting away from automotive work tends to decrease these margins, a restructuring of our strategy will be needed.
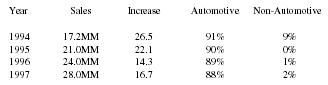
| Year | Sales | Increase | Automotive | Non-Automotive |
| 1994 | 17.2MM | 26.5 | 91% | 9% |
| 1995 | 21.0MM | 22.1 | 90% | 0% |
| 1996 | 24.0MM | 14.3 | 89% | 1% |
| 1997 | 28.0MM | 16.7 | 88% | 2% |
Given the projected annual growth from 1995 through 1997 and our desire to expand our customer and product base, additional personnel and equipment will be needed. We anticipate that our current facility will adequately accommodate our growth. However, changes in the existing facility, due for completion in 1995, include the addition of a health center and air-conditioning for the manufacturing area. These changes are seen as enhancements to our facility which benefit all of our personnel and helps them achieve the goals established in this business plan. Anticipated equipment and personnel needs are detailed below.
Personnel
Production
- 3-4 experienced die-setters each year at a cost of approximately $37,000 per person.
- 2 production apprentices per year at a cost of approximately $21,000 per person.
Toolroom
- 3 machinists by late 1995 at an approximate cost of $30,000 per person.
- 2 toolroom apprentices per year at an approximate cost of $21,000 per person.
Engineering
- 1 tooling engineer by June 1996 at an approximate cost of $33,000.
Purchasing
- 1 "Buyer" by mid-1996 at an approximate cost of $36,000.
Quality Assurance
- 1 final auditor by late 1995 at an approximate cost of $27,000.
- 2 floor inspectors by mid-1996 at an approximate cost of $27,000 each.
Shipping/Cleaning
- none anticipated with equipment purchases.
FINANCIAL PROJECTIONS
Forecast of Major Balance Sheet Categories
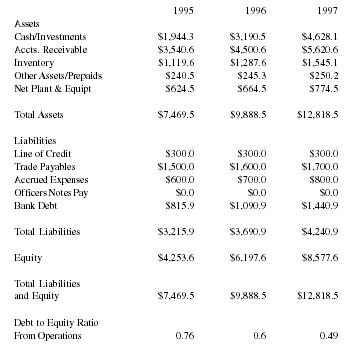
| 1995 | 1996 | 1997 | |
| Assets | |||
| Cash/Investments | $1,944.3 | $3,190.5 | $4,628.1 |
| Accts. Receivable | $3,540.6 | $4,500.6 | $5,620.6 |
| Inventory | $1,119.6 | $1,287.6 | $1,545.1 |
| Other Assets/Prepaids | $240.5 | $245.3 | $250.2 |
| Net Plant & Equipt | $624.5 | $664.5 | $774.5 |
| Total Assets | $7,469.5 | $9,888.5 | $12,818.5 |
| Liabilities | |||
| Line of Credit | $300.0 | $300.0 | $300.0 |
| Trade Payables | $1,500.0 | $1,600.0 | $1,700.0 |
| Accrued Expenses | $600.0 | $700.0 | $800.0 |
| Officers Notes Pay | $0.0 | $0.0 | $0.0 |
| Bank Debt | $815.9 | $1,090.9 | $1,440.9 |
| Total Liabilities | $3,215.9 | $3,690.9 | $4,240.9 |
| Equity | $4,253.6 | $6,197.6 | $8,577.6 |
| Total Liabilities and Equity | $7,469.5 | $9,888.5 | $12,818.5 |
| Debt to Equity Ratio From Operations | 0.76 | 0.6 | 0.49 |
Forecast of Cash Flows
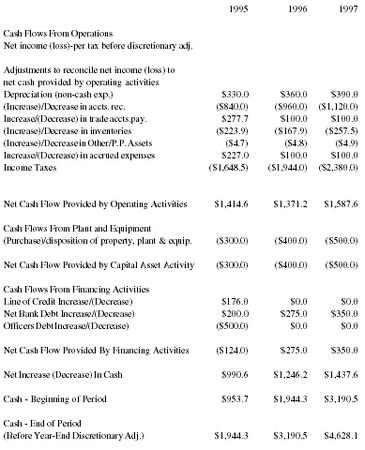
| 1995 | 1996 | 1997 | |
| Cash Flows From Operations | |||
| Net income (loss)-per tax before discretionary adj. | |||
| Adjustments to reconcile net income (loss) to net cash provided by operating activities | |||
| Depreciation (non-cash exp.) | $330.0 | $360.0 | $390.0 |
| (Increase)/Decrease in accts. rec. | ($840.0) | ($960.0) | ($1,120.0) |
| Increase/(Decrease) in trade accts.pay. | $277.7 | $100.0 | $100.0 |
| (Increase)/Decrease in inventories | ($223.9) | ($167.9) | ($257.5) |
| (Increase)/Decrease in Other/P.P. Assets | ($4.7) | ($4.8) | ($4.9) |
| Increase/(Decrease) in accrued expenses | $227.0 | $100.0 | $100.0 |
| Income Taxes | ($1,648.5) | ($1,944.0) | ($2,380.0) |
| Net Cash Flow Provided by Operating Activities | $1,414.6 | $1,371.2 | $1,587.6 |
| Cash Flows From Plant and Equipment (Purchase)/disposition of property, plant & equip. | ($300.0) | ($400.0) | ($500.0) |
| Net Cash Flow Provided by Capital Asset Activity | ($300.0) | ($400.0) | ($500.0) |
| Cash Flows From Financing Activities | |||
| Line of Credit Increase/(Decrease) | $176.0 | $0.0 | $0.0 |
| Net Bank Debt Increase/(Decrease) | $200.0 | $275.0 | $350.0 |
| Officers Debt Increase/(Decrease) | ($500.0) | $0.0 | $0.0 |
| Net Cash Flow Provided By Financing Activities | ($124.0) | $275.0 | $350.0 |
| Net Increase (Decrease) In Cash | $990.6 | $1,246.2 | $1,437.6 |
| Cash - Beginning of Period | $953.7 | $1,944.3 | $3,190.5 |
| Cash - End of Period (Before Year-End Discretionary Adj.) | $1,944.3 | $3,190.5 | $4,628.1 |
Forecast of Personnel Needs
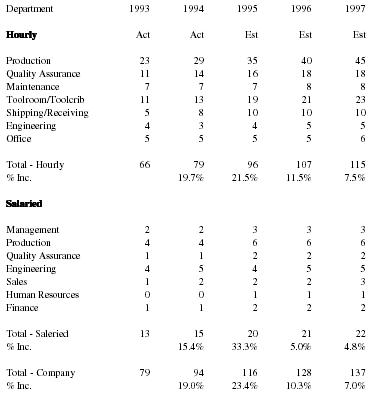
| Department | 1993 | 1994 | 1995 | 1996 | 1997 |
| Hourly | Act | Act | Est | Est | Est |
| Production | 23 | 29 | 35 | 40 | 45 |
| Quality Assurance | 11 | 14 | 16 | 18 | 18 |
| Maintenance | 7 | 7 | 7 | 8 | 8 |
| Toolroom/Toolcrib | 11 | 13 | 19 | 21 | 23 |
| Shipping/Receiving | 5 | 8 | 10 | 10 | 10 |
| Engineering | 4 | 3 | 4 | 5 | 5 |
| Office | 5 | 5 | 5 | 5 | 6 |
| Total - Hourly | 66 | 79 | 96 | 107 | 115 |
| % Inc. | 19.7% | 21.5% | 11.5% | 7.5% | |
| Salaried | |||||
| Management | 2 | 2 | 3 | 3 | 3 |
| Production | 4 | 4 | 6 | 6 | 6 |
| Quality Assurance | 1 | 1 | 2 | 2 | 2 |
| Engineering | 4 | 5 | 4 | 5 | 5 |
| Sales | 1 | 2 | 2 | 2 | 3 |
| Human Resources | 0 | 0 | 1 | 1 | 1 |
| Finance | 1 | 1 | 2 | 2 | 2 |
| Total - Saleried | 13 | 15 | 20 | 21 | 22 |
| % Inc. | 15.4% | 33.3% | 5.0% | 4.8% | |
| Total - Company | 79 | 94 | 116 | 128 | 137 |
| % Inc. | 19.0% | 23.4% | 10.3% | 7.0% |
Forecast of Capital Asset Needs
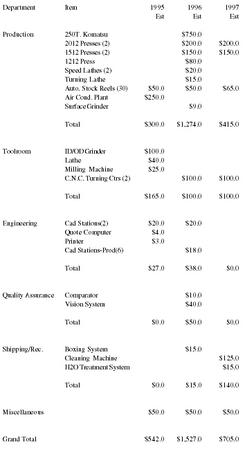
| Department | Item | 1995 | 1996 | 1997 |
| Est | Est | Est | ||
| Production | 250T. Komatsu | $750.0 | ||
| 2012 Presses (2) | $200.0 | $200.0 | ||
| 1512 Presses (2) | $150.0 | $150.0 | ||
| 1212 Press | $80.0 | |||
| Speed Lathes (2) | $20.0 | |||
| Turning Lathe | $15.0 | |||
| Auto. Stock Reels (30) | $50.0 | $50.0 | $65.0 | |
| Air Cond. Plant | $250.0 | |||
| Surface Grinder | $9.0 | |||
| Total | $300.0 | $1,274.0 | $415.0 | |
| Toolroom | ID/OD Grinder | $100.0 | ||
| Lathe | $40.0 | |||
| Milling Machine | $25.0 | |||
| C.N.C. Turning Ctrs (2) | $100.0 | $100.0 | ||
| Total | $165.0 | $100.0 | $100.0 | |
| Engineering | Cad Stations(2) | $20.0 | $20.0 | |
| Quote Computer | $4.0 | |||
| Printer | $3.0 | |||
| Cad Stations-Prod(6) | $18.0 | |||
| Total | $27.0 | $38.0 | $0.0 | |
| Quality Assurance | Comparator | $10.0 | ||
| Vision System | $40.0 | |||
| Total | $0.0 | $50.0 | $0.0 | |
| Shipping/Rec. | Boxing System | $15.0 | ||
| Cleaning Machine | $125.0 | |||
| H2O Treatment System | $15.0 | |||
| Total | $0.0 | $15.0 | $140.0 | |
| Miscellaneous | $50.0 | $50.0 | $50.0 | |
| Grand Total | $542.0 | $1,527.0 | $705.0 |
Equipment
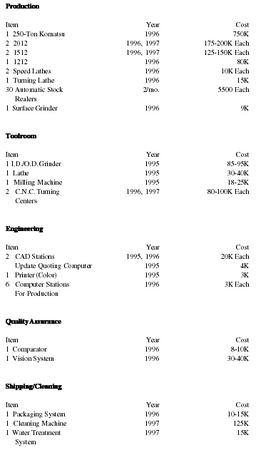
| Production | ||
| Item | Year | Cost |
| 1 250-Ton Komatsu | 1996 | 750K |
| 2 2012 | 1996, 1997 | 175-200K Each |
| 2 1512 | 1996, 1997 | 125-150K Each |
| 1 1212 | 1996 | 80K |
| 2 Speed Lathes | 1996 | 10K Each |
| 1 Turning Lathe | 1996 | 15K |
| 30 Automatic Stock Realers | 2/mo. | 5500 Each |
| 1 Surface Grinder | 1996 | 9K |
| Toolroom | ||
| Item | Year | Cost |
| 1 I.D./O.D. Grinder | 1995 | 85-95K |
| 1 Lathe | 1995 | 30-40K |
| 1 Milling Machine | 1995 | 18-25K |
| 2 C.N.C. Turning Centers | 1996, 1997 | 80-100K Each |
| Engineering | ||
| Item | Year | Cost |
| 2 CAD Stations | 1995, 1996 | 20K Each |
| Update Quoting Computer | 1995 | 4K |
| 1 Printer (Color) | 1995 | 3K |
| 6 Computer Stations | 1996 | 3K Each |
| For Production | ||
| Quality Assurance | ||
| Item | Year | Cost |
| 1 Comparator | 1996 | 8-10K |
| 1 Vision System | 1996 | 30-40K |
| Shipping/Cleaning | ||
| Item | Year | Cost |
| 1 Packaging System | 1996 | 10-15K |
| 1 Cleaning Machine | 1997 | 125K |
| 1 Water Treatment System | 1997 | 15K |
Income Statement Recap From Operations
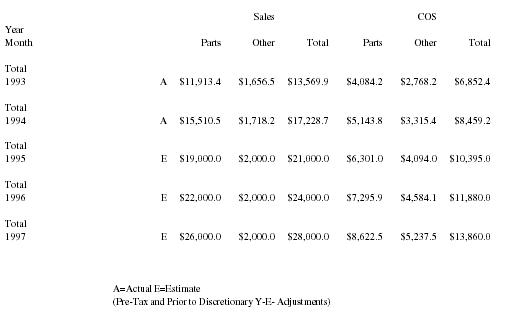
| Sales | COS | ||||||
| A=Actual E=Estimate | |||||||
| (Pre-Tax and Prior to Discretionary Y-E-Adjustments) | |||||||
|
Year
Month |
Parts | Other | Total | Parts | Other | Total | |
|
Total
1993 |
A | $11,913.4 | $1,656.5 | $13,569.9 | $4,084.2 | $2,768.2 | $6,852.4 |
|
Total
1994 |
A | $15,510.5 | $1,718.2 | $17,228.7 | $5,143.8 | $3,315.4 | $8,459.2 |
|
Total
1995 |
E | $19,000.0 | $2,000.0 | $21,000.0 | $6,301.0 | $4,094.0 | $10,395.0 |
|
Total
1996 |
E | $22,000.0 | $2,000.0 | $24,000.0 | $7,295.9 | $4,584.1 | $11,880.0 |
|
Total
1997 |
E | $26,000.0 | $2,000.0 | $28,000.0 | $8,622.5 | $5,237.5 | $13,860.0 |
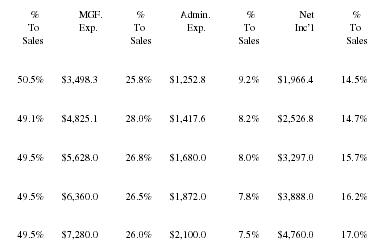
| % To Sales | MGF. Exp. | % To Sales | Admin. Exp. | % To Sales | Net Inc'l | % To Sales |
| 50.5% | $3,498.3 | 25.8% | $1,252.8 | 9.2% | $1,966.4 | 14.5% |
| 49.1% | $4,825.1 | 28.0% | $1,417.6 | 8.2% | $2,526.8 | 14.7% |
| 49.5% | $5,628.0 | 26.8% | $1,680.0 | 8.0% | $3,297.0 | 15.7% |
| 49.5% | $6,360.0 | 26.5% | $1,872.0 | 7.8% | $3,888.0 | 16.2% |
| 49.5% | $7,280.0 | 26.0% | $2,100.0 | 7.5% | $4,760.0 | 17.0% |
Comment about this article, ask questions, or add new information about this topic: