CONFIDENCE INTERVAL

The confidence interval is a tool of probability that is used to express the certainty or uncertainty of an estimated number. The lack of absolute certainty stems from the statistical method of using random samples or limited numbers of subjects from much larger groups when making statistical determinations and inferences. The goal of this method is for the average or mean of the sample to equal or closely approximate the mean of the total number of subjects from which the sample was obtained (the true mean). The confidence interval is the range of numbers needed to specify with varying degrees of probability (or confidence) that the sample mean closely approximates the true mean.
For example, political pollsters find it impossible to query every adult in the United States about whether or not they approve of the performance of the president. Such a poll would require asking more than 200 million people whether they approved or disapproved of the president's performance.
Instead, pollsters sample only a small number of people, typically 5,000 people, and draw statistical inferences for the entire population based on the results of that sample. As long as the sample population is chosen at random and the number is significant (more than 30 people), pollsters may be reasonably assured that the opinions expressed by the sample population will be normally distributed and therefore usefully indicative of the opinions of the entire population.
Assume that a telephone poll is conducted in which 5,000 randomly selected people are asked to express approval, disapproval, neutrality, or no opinion about the performance of the president. The sample reveals that 2,000, or 40 percent, approve of the president's performance, while 2,250, or 45 percent, disapprove. Meanwhile, 450, or 9 percent, are neutral, and the remaining 300, or 6 percent, have no opinion about how the president is doing.
The figures are 100 percent accurate only for the sample population because every one of the 5,000 has been asked. But when attempting to draw an inference for the entire population based on this sample data, the pollsters cannot be absolutely sure the proportions will remain accurate.
Instead, pollsters try to express the likelihood that these numbers are accurate for the entire population. This likelihood results from the confidence interval, which enables the pollster or statistician to estimate the population mean—the true mean—based on a sample mean. As a result, presidential approval ratings are commonly expressed with degrees of accuracy that are reflections of the confidence interval. The results always include an indication of the error (plus or minus a percentage) that may exist in the poll.
It is logistically very difficult to measure values for entire populations. Rather than attempting to find the correct value for an entire population, the statistician may attempt to find only the "most correct" value for the population using only a sample of the population, and use the confidence interval to determine whether or not the sample value is absolutely correct.
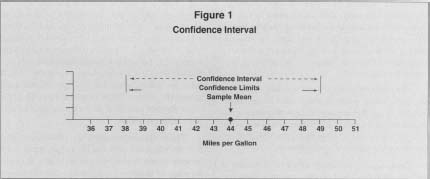
To use a somewhat different example from the presidential opinion poll, assume that an automobile manufacturer has developed a new car and must provide an estimate of the mileage that drivers can expect from this model. A sample of 100 cars is taken from the assembly line and given test runs on a closed track. The worst performing car among the sample gets 39 miles per gallon, while the best gets 49 miles per gallon. The average for the sample of the entire population (the total mileage of all the cars divided by 100) is 44 miles per gallon.
The results can be expressed as: Mileage = 39 < Χ̅ < 49, which indicates that the sample mean Χ̅ lies between 39 and 49 miles per gallon. In fact, the wider the range of numbers greater or less than the sample mean, the greater the chance that it includes the true mean μ For example, there is a greater likelihood that the true mean μ falls between 35 and 53, than there is that it falls between 41 and 47. Moreover, there is 100 percent certainty that the true mean falls between 0 and infinity. Nevertheless, these considerations do not provide a useful estimate of the likelihood that the true mean μ for the entire population equals the sample mean Χ̅, or 44.
To be useful, the interval estimate must include a specification of limits or boundary values for the interval as well as a probability that the interval of values contains the true mean. The interval of values is the "confidence interval," and its boundaries of values are called "confidence limits" of the interval.
The confidence interval is a range of numbers above and below the sample mean with a specific likelihood that it contains the true mean. As a measure of probability, it is usually expressed as a percentage and referred to as the "confidence level." The confidence interval, confidence limits, and mean may be diagrammed as in Figure 1.
The width of the confidence interval is determined by the degree of confidence. A 95 percent confidence interval will be narrower than a 99 percent confidence interval, indicating that there is a greater probability that the true mean lies within a wider confidence interval.
The difference between the sample mean Χ̅ and the true mean
μ is attributable to an unknown variable degree of error ϵ.
This relationship may be expressed as:
The error ϵ is essential to defining a confidence interval for the true mean μ. But while the error ϵ for the sample mean Χ̅ is unknown, statisticians can make assumptions about the size of the errors if they know the mean, standard deviation, and shape of the distribution of those errors. For example, just by using the
Confidence Interval
Statisticians often set the confidence interval they want in advance—that is, they select the probability they want that the true mean will be included in the interval. Then they determine how wide the interval must be to have the desired probability (e.g., a 95 percent chance) that true mean will be included. Hence, statisticians can choose between a narrow confidence interval with a confidence level of 85 percent or a wide confidence interval with a confidence level of 99 percent. Once this information is determined, statisticians can compute how large a sample they would need in order to achieve the desired confidence interval and level of confidence.
[ John Simley ,
updated by Karl Heil ]
FURTHER READING:
Downing, Douglas. Statistics the Easy Way. Hauppauge, NY: Barron's Educational Services, 1983.
Johnson, Robert. Elementarv Statistics. 3rd ed. North Scituate, MA: Duxbury Press, 1980.
Kachiga, Sam Kash. Statistical Analysis. New York: Radius Press, 1986.
Kazmier, Leonard J. Basic Statistics for Business and Economics. New York: McGraw-Hill, 1990.
Weaver, Jefferson Hane. Conquering Statistics: Number without the Crunch. New York: Plenum Publishing, 1997.
Comment about this article, ask questions, or add new information about this topic: