FLOW CHARTS
Flow charts are graphical representations of a process that illustrates the sequence of steps needed to reach the process's outcome. A flow chart may include a sequence of operations, machines, materials, or information; it can document a physical process like a manufacturing cycle or it can illustrate an abstract process like an algorithm used in a computer program. Because they break processes down into discrete steps and an observable sequence, flow charts serve themselves well as tools for process analysis and improvement. They help work teams identify the different elements of a process and understand the interrelationships among the different steps. Flow charts may also be used to gather information and data about a process or process performance that will greatly aid in decision making regarding the process.
Constructing flow charts requires the use of different symbols. The main symbols that are used to construct flow charts are shown in Figure 1. They are:
- Starting and ending activities are signified by a rounded-edge rectangle or an oval. These are sometimes called terminal activities.
- Activities or steps are indicated by a rectangle. Each step is shown in a single rectangle. These symbols may also be called activity or process symbols.
- Diamonds are decision symbols. The question to be answered or decision to be made is written inside the diamond. The answer determines the path that will be taken as a next step.
- Deliverable outcomes appear as parallelograms. These include any steps in the process that yield tangible output, such as the customer receiving the product, a committee issuing a status report, or the organization realizing cost savings.
- Circles designate a continuation of a process in detail somewhere else in the diagram. A number or letter inside the circle indicates where the chain picks up elsewhere on the page or on another page.
- Written information or documents related to the activity or the process are indicated by a document symbol.
- The progression from one step to another is indicated by flow lines with directional arrows.
In addition, dozens of more specialized symbols exist for more elaborate charts.
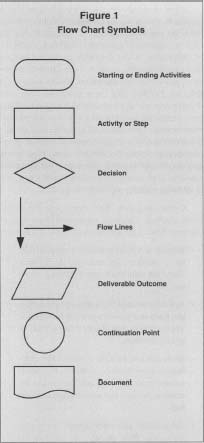
Flow Chart Symbols
To construct a flow chart, the following main steps are required:
- Define the process and identify the scope of the flow diagram.
- Identify project team members who are to be involved in the construction of the process flow diagram.
- Define the different steps involved in the process and the interrelationships between the different steps. All team members should develop and agree upon the different steps for the process.
- Finalize the diagram. Get other concerned individuals involved as necessary. Modify the diagram as needed.
- Use the flow diagram and continuously update as needed.
Figure 2 shows a flow chart for a hypothetical research and development process.
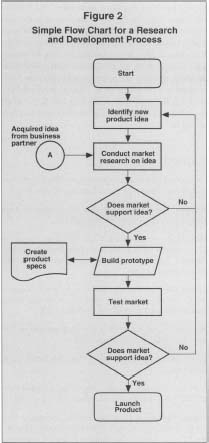
Simple Flow Chart for a Research
and Development Process
FURTHER READING:
Damelio, Robert. The Basics of Process Mapping. New York: Quality Resources, 1996.
Galloway, Dianne. Mapping Work Processes. Milwaukee: American Society for Quality, 1994.
Comment about this article, ask questions, or add new information about this topic: