SPECTRAL ANALYSIS
Spectral analysis is an advanced mathematical technique for studying phenomena that occur in cycles. As used in business and economics, it is concerned with forecasting outcomes based on time-series data, such as quarterly sales, exchange rates, stock prices, or growth in the gross domestic product. Spectral analysis is also widely used in engineering and sciences in fields like signal processing. Understanding the underlying mathematics requires intermediatelevel undergraduate course work in statistics and calculus. Spectral methods are related to a broader class of time-series models known as autoregressive integrated moving average (ARIMA) models.
Although it has wide-reaching applications in the sciences, the beginnings of spectral analysis lie in the observance of nature. Ancient humans became aware of cycles with the changing of the seasons, the rising of tides, and the movement of the stars. Early astronomers and people living in agriculture-based civilizations first learned the values of recognizing patterns and of being able to make predictions and forecasts based on empirical observations of cyclic trends.
The foundations of spectral analysis lie in the broader area of times series analysis. The Fourier theorem, named for Baron J.B.J. Fourier (1768-1830), a French geometrician and physicist, states that periodic functions can be defined by the mathematical components of cyclical series decomposed, or broken down, into multiples of the functions sine and cosine. These are the components which create the spectrum which is analyzed. Astronomers, physicists, mathematicians, and other scientists grasped this concept and have used it extensively ever since, but it did not readily lend itself to economic studies.
Another major step in the development of time series analysis came with the work of Sir Arthur Shuster from 1898 to 1906. Shuster popularized the use of the periodogram method. In the 1920s, further advances were made by grappling mathematically with the ideas of the ebbs and flows of business economics. E. Slutsky and G.U. Yule made advances on previous methods with the idea of an auto regressive moving average.
FUNDAMENTALS OF SPECTRAL
ANALYSIS
Waves on a pond have the physical shape characteristic of cycle, or wave, phenomena. By using this pond wave model, one can observe that while the waves are constant, they vary in their pitch, or distances apart, and their heights. These variations are termed wave frequency and amplitude, respectively. Frequency is measured in cycles per time unit, also referred to as the time period of a cycle. Amplitude is measured in the indexes relative to the variable of interest, such as unemployment expressed as a percentage, interest rates also expressed as a percentage, capital expenditures expressed in currency, and so on. By plotting historical data, it can be seen that variables change relative to the constant measure of time. A point can be found on the wave by a given value of one variable when the equation is used that describes the function of the sine wave. This equation expresses the effect of change on one variable relative to the other, or codependency with, the functions of sine and cosine. Nevertheless, business or economic conditions do not behave in a smooth, regular, cyclic pattern. They are irregular and, like the pond wave model, are stochastic, or random.
Economic statisticians plot variables of business interest against time and through the use of mathematical refinement techniques—such as smoothing and filtering—that produce the sine wave cycles. Some of the items or occurrences the statistician would be likely to filter out are cycles with wildly exaggerated amplitude, or noise, such as the price of steel during World War II. Noise can be compared to someone throwing a stone into the pond wave model. It cannot be predicted or taken into account in plotting general trends.
Analysis can be undertaken considering the entire time plot limits or at specific times or time intervals. These are termed the continuous spectrum and
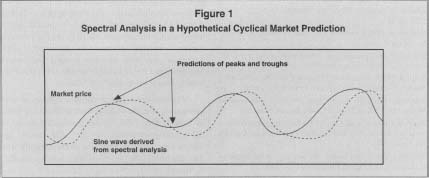
Spectral Analysis in a Hypothetical Cyclical Market Prediction
SAMPLE APPLICATION
As with all forecasting models, spectral analysis does not always yield accurate predictions, but it has been used in a wide number of business and economic applications that involve time-series data. One of the simplest, and perhaps least scientific, uses is in software designed to signal optimal trading times in financial markets, i.e. buying near the lowest price and selling near the high point in a cycle. Experts debate the validity of such methods, which have no consistent track record of success, but proponents claim that under the right conditions spectral based systems can be useful trading aids. Figure 1 shows in simplified terms how such software might approach a cyclical pricing problem. In this example, mathematical properties of the real price cycle are assumed to be useful in determining its future path, and in particular, its peaks and troughs. Theoretically, a real up-down cycle can be identified by ignoring white noise or random movements. This method is of course far from foolproof, as the forecast peaks or troughs may never pan out. Indeed, some have argued that stock price movements are nearly all random and that no such cycles can be accurately calculated or predicted.
SEE ALSO : Forecasting ; Stochastic Processes
[ Karen L. Boyd ]
FURTHER READING:
Horn, Robert V. Statistical Indicators for the Economic and Social Sciences. New York: Cambridge University Press, 1993. Kennedy, Peter. A Guide to Econometrics. 4th ed. Cambridge, MA: MIT Press, 1998.
Ruggiero, Murray A. "Forget the Dream: Now You Can Predict Tops and Bottoms." Futures, April 1997.
Stoica, Peter, and Randolph J. Moses. Introduction to Spectral Analysis. Upper Saddle River, NJ: Prentice Hall, 1997.
Comment about this article, ask questions, or add new information about this topic: