SIC 3644
NONCURRENT-CARRYING WIRING DEVICES
The noncurrent-carrying wiring devices industry is made up of companies that primarily manufacture hardware used to support electrical systems. Popular products include electrical conduits and fittings, boxes for outlets, switches, and fuses, and pole and transmission line devices. Insulators are also included in this industry, with the exception of those made from glass or ceramics. For information about the history of electrical systems, see SIC 3641: Electric Lamp Bulbs and Tubes and SIC 3643: Current-Carrying Wiring Devices.
NAICS Code(s)
335932 (Noncurrent-Carrying Wire Device Manufacturing)
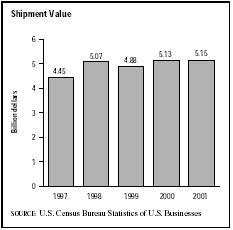
According to the U.S. Census Bureau, 180 firms operated 235 establishments in this category for some or all of 2001. Industry-wide employment totaled nearly 23,000 workers receiving a payroll of well over $800 million. Almost 17,000 of these employees worked in production, putting in more than 33 million hours to earn wages of $480 million. Overall shipments for the industry were valued at $5.1 billion.
Most noncurrent-carrying wiring products are consumed by the nonresidential construction sector. A leading 51 percent of industry output in the mid-1990s was attributed to electrical conduit and fittings, which includes conduit, connectors, junction boxes and related products. Pole and transmission line hardware, which was purchased by cable television and utility companies, comprised about 17 percent of production. The remainder of the market was highly fragmented. Store and restaurant construction, for example, accounted for about 1 percent of sales, as did construction related to mobile homes. Other industry outputs included highway and street construction, sewer system development, industrial controls, and lawn and garden equipment.
Rampant infrastructure growth and commercial development following World War II helped the industry attain revenues of $2 billion by the late 1970s. Moreover, steady market growth during the 1980s generated average annual revenue growth of about 4.5 percent. By 1989, industry participants were shipping about $3.4 billion worth of goods per year.
A severe depression in commercial development and stagnant institutional construction markets contributed to the industry's decline in the early 1990s. Sales slipped by about 2.5 percent in 1990 and continued to fade approximately 1.5 percent per year through 1993. Although sales reached nearly $4.0 billion in 1994, growth in 1995 was nearly flat, with revenues increasing only 2.0 percent.
The total value of shipments in 2001 reached $5.1 billion. About 180 companies competed in the noncurrent-carrying wiring device industry in that year, with about 23,000 employees. The majority of the companies employed fewer than 20 workers, and there were only 23 firms with more than 500 employees.
McDATA Corp. of Broomfield, Colorado, led the industry with $328 million in revenue during 2001. In second place was Cleveland-based Lamson and Sessions Co., with revenue of $315 million. Rounding out the top
three was Allied Moulded Products Inc. of Bryan, Ohio, with $73 million in revenue.
Prospects for employment in this industry were relatively poor. Although output increased during the 1980s, employment declined from about 26,000 in the early 1980s to around 22,000 a decade later. Overall outlook for employment in the miscellaneous electrical equipment and component manufacturing industry was for a small but steady rate of annual decline into 2012. Productivity gains, management restructuring, automation, and the movement of some manufacturing activities to foreign countries were the primary reasons for expected workforce reductions. Although the Bureau of Labor Statistics predicted many labor positions would be eliminated by 2005, jobs for sales and marketing professionals were expected to increase.
Further Reading
Baker, Deborah J., ed. Ward's Business Directory of US Private and Public Companies. Detroit, MI: Thomson Gale, 2003.
Darnay, Arsen J., ed. Manufacturing and Distribution USA. Detroit: Thomson Gale, 2003.
Hoover's Company Fact Sheet. "McDATA Corp." 3 March 2004. Available from http://www.hoovers.com .
Infotrac Company Profiles. 2000. Available from http://web4.infotrac.galegroup.com .
U.S. Census Bureau. Statistics of U.S. Businesses: 2001. 1 March 2004. Available from http://www.census.gov/epcd/susb/2001/us/US332311.htm .
U.S. Department of Commerce. Annual Survey of Manufactures. Washington: GPO, 2002.
U.S. Department of Labor, Bureau of Labor Statistics. Economic and Employment Projections. 11 February 2004. Available from http://www.bls.gov/news.release/ecopro.toc.htm .
Comment about this article, ask questions, or add new information about this topic: