SIC 3547
ROLLING MILL MACHINERY
This category covers establishments primarily engaged in manufacturing rolling mill machinery and processing equipment for metal production, such as cold forming mills, structural mills, and finishing equipment.
NAICS Code(s)
333516 (Rolling Mill Machinery and Equipment Manufacturing)
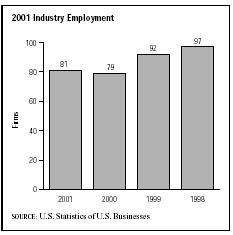
According to the Annual Survey of Manufactures , during the early 2000s industry-wide employment totaled approximately 3,000 workers receiving a payroll of about $140 million. Of these employees, nearly 1,800 worked in production, putting in almost 3.6 million hours to earn wages of nearly $70 million. Overall shipments for the industry were valued at more than $494 million. The U.S. Census Bureau showed 88 establishments operating in this category for some or all of 2001.
The U.S. government divides rolling mill machinery into four classifications: hot rolling mill machinery (except tube rolling), cold rolling mill machinery, other roll milling machinery (including tube mill machinery), and rolling mill machinery that is not classified elsewhere. In 1995, the value of shipments for these four classifications was $621 million. The most valuable classification was "other rolling mill machinery," with a product shipment value of $244.5 million.
The industry is relatively labor-intensive, having 30.0 percent as much investment per production worker as that for the manufacturing sector as a whole. Annual hours worked by production workers in the industry were 9 percent higher on average than those worked in the manufacturing sector at large, and hourly wages, at approximately $15 per hour, were 18.0 percent higher. By 2005, machinist jobs are expected to decrease 17.4 percent. Tool and die makers' jobs are expected to decrease 15.3 percent. A 37.7 percent increase is expected for combination machine tool operators. Employment projections for the metalworking machinery manufacturing industry as a whole were for a steady annual increase through the year 2012.
The capital requirements for the industry are relatively low, with average investment per establishment at 25 percent of that for the manufacturing sector as a whole. The clear industry leader in 2001 was Kent, Ohio-based RB & W Manufacturing LLC, with sales of $6.3 billion based on the strength of only 100 employees. In a distant second place was Morgan Construction Company of Worcester, Massachusetts, with $80 million in sales and 500 employees. Pines Manufacturing Inc. of Westlake, Ohio, was in third place, with $36 million in sales and 100 employees. Projections for the mid-2000s showed approximately 115 establishments producing $682 billion in total shipments.
The top rolling mill machinery products by share are hot rolling mill machinery (47 percent); rolling mill machinery, not elsewhere classified, including tube mill machinery, processing lines, and machined rolls for rolling mills (37 percent); and cold rolling mill machinery (12 percent). The states ranking in the top five, by number of industry establishments, are Ohio (with 16), Pennsylvania (with 10), Illinois (with 8), Michigan (with 7), and Massachusetts (with 6). Together, these five states account for 79 percent of total employment for the industry
in the United States. Ohio by itself accounts for about 31 percent of total employment.
The top five industries and sectors buying the industry's output were: gross fixed private investment, with a 75.4 percent share; exports, with a 17.8 percent share; change in business inventories, with a 3.7 percent share; rolling mill machinery, with a 2.6 percent share; and federal government purchases, for national defense, with a 0.1 percent share.
Some of the newer developments in this industry were designed not only to increase efficiency and productivity, but also to increase safety. One Ohio company in particular used a roller designed for large diameter pipes, and that was not designed with guards in place to prevent employees' hands from being pulled into the rollers. The violation was finally corrected in the early 2000s after a decade of risk. Other companies were developing products, some made specifically to retrofit existing machines, that enabled electronic load monitoring and inspection, not only of the rolling mills themselves, but also of the product being processed by the machines.
Further Reading
Baker, Deborah J., ed. Ward's Business Directory of US Private and Public Companies. Detroit, MI: Thomson Gale, 2003.
U.S. Department of Labor, Bureau of Labor Statistics. Economic and Employment Projections. 11 February 2004. Available from http://www.bls.gov/news.release/ecopro.toc.htm .
Darnay, Arsen J., ed. Manufacturing and Distribution USA. Detroit: Thomson Gale, 2003.
"En Route to 'Zero Defect Rolling'?" Aluminum International Today , Jan-Feb 2003.
"Roll Measurement for Old and New." Steel Times International , March 2002.
U.S. Census Bureau. Statistics of U.S. Businesses: 2001. 1 March 2004. Available from http://www.census.gov/epcd/susb/2001/us/US332311.htm .
U.S. Department of Commerce. Annual Survey of Manufactures. Washington: GPO, 2002.
"A Willful Violation? OSHA Thinks So." Safety Management , February 2003.
Comment about this article, ask questions, or add new information about this topic: