SIC 3089
PLASTICS PRODUCTS, NOT ELSEWHERE CLASSIFIED
This category covers establishments primarily engaged in manufacturing plastics products not classified elsewhere. Establishments primarily engaged in manufacturing artificial leather are classified in SIC 2295: Coated Fabrics, Not Rubberized.
Companies in this industry manufacture a multitude of items, ranging from clothespins and air mattresses to shoe soles and septic tanks. This industry accounted for approximately 60 percent of all plastics products sales in the early 1990s. For more information about manufacturing processes and the history of plastics products, see other entries in industry group 3080. For information regarding resin manufacturing, see SIC 2821: Plastics Materials, Synthetic Resins, and Nonvulcanizable Elastomers.
NAICS Code(s)
326122 (Plastic Pipe and Pipe Fitting Manufacturing)
326121 (Unsupported Plastics Profile Shape Manufacturing)
326199 (All Other Plastics Product Manufacturing)
Industry Snapshot
There are at least 12 major processing techniques used to form plastics goods. A traditional and popular technique is extrusion, which entails melting and compressing plastic granules in a tube. A screw conveyor inside the tube forces the plastic through a nozzle at the end of the tube. The physical characteristics of the plastic can be altered by applying heat or cold to the barrel, adjusting the screw pressure, or by using different types and sizes of screws. Extrusion processes are used to make pipe, sheeting, films, and various forms.
Another popular processing technique is blow-molding, whereby extruded plastic is forced into a bottle-shaped mold. Compressed air inflates the hot plastic and pushes it against the cold sides of the mold, resulting in thin-walled plastic containers. Injection molding, one of the most popular processing operations, entails extruding plastic directly into a mold, where it hardens into a solid form. Sheets of plastic are created through calendaring or film and sheet extrusion. Foam is made in a process called foaming. Other popular plastic processing techniques include film casting, rotational molding, laminating, and casting.
The two main classes of plastics are thermosets and thermoplastics. Thermosets, which account for only 10 percent of the material used in this industry, harden by chemical reaction and cannot be melted and reshaped once they are created. Primary products created with thermoset plastics are epoxies and phenol formaldehyde (Bakelite). Epoxies are used to manufacture flooring, protective coatings, adhesives and cements, electrical hardware, and particleboard. Bakelite is formed into electrical parts, pot handles, and various knobs.
Thermoplastics include acrylics, cellulose proportionate (Forticel), ABS (acrylonitrile-butadiene-styrene), polyphenylene oxide (Noryl), and polysulfone. Acrylics are utilized in the production of windows, signs, vehicle light covers, and textiles. Forticel is applied in the manufacture of items such as pens, typewriter keys, telephone housing, and other applications that require impact strength. ABS, which has very high impact resistance, is used to make drainpipes, automobile parts, and small appliances and tools. Noryl, which combines high impact strength with temperature stability, is used for products like machine parts and equipment housing. Lastly, polysulfone, which is heat resistant, is used in battery casings, smoke alarms, electronic connectors, and shower heads.
Although the markets for miscellaneous plastics products are extremely fragmented, a few major categories stand out. For instance, consumer, institutional, and commercial fabricated plastics products, except foam and wire coated, accounted for nearly 22 percent of industry shipments in 2001. Transportation fabricated plastics products, except foam and reinforced plastics, accounted for another 22 percent of overall shipments that year. Miscellaneous plastic packaging, such as caps, food trays, and bubble wrap, constituted 13 percent of shipments in 2001; building and construction fabricated plastics products, except foam, plumbing fixtures, hardware, or reinforced plastics, made up 12.4 percent; and plastics used to make electrical and electronic devices accounted for about 7 percent. Other major product groups included industrial machinery, shoe products, dinnerware and kitchenware, and plastic furniture parts.
Background and Development
Keratin, a natural plastic, was used in the United States to make lantern windows and other simple items as early as 1740. Gutta percha, or gum elastic, was first used during the mid-1850s to make billiard balls and ocean cable insulation. Manufacturers borrowed forming and processing techniques from Malayan natives. Shellac plastics, developed by Samuel Speck, also emerged during the mid-1800s, and were used to create goods such as checkers, buttons, and insulators.
Following the invention of the first synthetic plastics in the late 1870s (see SIC 2821: Plastics Materials, Synthetic Resins, and Nonvulcanizable Elastomers ), plastics products sales began to accelerate. American Dr. Baekland introduced the first moldable plastic, Bakelite, in 1909. Bakelite prompted a flurry of new molding techniques and resins during the early 1900s. Advances during World War II also bolstered the industry. The rampant proliferation of new synthetic chemicals and production processes during the 1950s, 1960s, and 1970s resulted in massive industry expansion. By the late 1970s, plastics products had become a staple of American life and were rapidly displacing conventional materials in a range of applications.
U.S. sales of miscellaneous plastics products expanded rapidly during the 1980s, but increased competition, both at home and abroad, contributed to lagging price growth. Total U.S. plastics products shipments were $105 billion by 1995. About 53 percent—or $55.3 billion—of that total was comprised of miscellaneous goods from this industry. Despite a late 1980s and early 1990s U.S. recession, shipment growth persisted as new additives and processing techniques were introduced.
Stiff competition and weak prices continued to plague manufacturers in the early 1990s, but increased sales of plastic goods for automobiles, packaged goods, and construction materials boosted margins for many competitors. Output of all plastics products grew throughout the 1990s and prices in some important market segments rose an estimated 3 percent to 5 percent per year. Sales in some depressed sectors, such as high-tech engineering plastics, were rebounding. Industry receipts were expected to climb at a rate of 3 percent to 6 percent annually through the mid-1990s.
In the long term, the use of plastics products was expected to proliferate. However, successful manufacturers will be forced to develop and implement improved processing techniques that reduce costs and improve quality. As foreign competition mounts—particularly for commodity-like products—U.S. technological superiority in plastics will become paramount.
Despite industry consolidation during the late 1980s and early 1990s, the miscellaneous plastics products industry remained relatively fragmented. About 8,330 companies competed going into the mid-1990s, up from only 8,045 in 1990. The number of companies was projected to drop slightly to about 8,200 by 1998. The average industry participant shipped about $6.6 million worth of goods, slightly less than 70 percent as much as the average U.S. manufacturer. The majority of producers are small and specialized.
Current Conditions
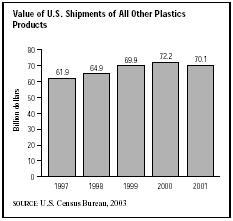
Sustained growth in plastic packaging sales fueled this industry in the late 1990s, as demand for durable, cost-effective packaging increased. Annual consumption of resins used to manufacture rigid and flexible packaging increased to more than 20 billion pounds. As the U.S. economy strengthened in the late 1990s, the value of plastics products shipments continued to grow. Shipments increased each year between 1997 and 2000, rising from $61.9 billion to $72.2 billion. However, when economic conditions began to deteriorate in the early 2000s, demand for plastics of all kind began to wane as the manufacturing sector as a whole underwent a dramatic slowdown. As a result, the value of shipments in 2001 declined to $70.1 billion.
Industry Leaders
The 948 workers at the Columbus, Ohio-based Core Molding Technologies, Inc., formerly known as Core Materials Corp., generated $948 million in 2003 sales, reflecting a 1.4 percent decline from the previous year. Moosup, Connecticut-based Griswold Rubber Company was another industry leader in the early 2000s, as was the much larger Philadelphia, Pennsylvania-based Crown Holdings Inc., previously named Crown Cork and Seal Company Inc., which posted 2003 sales of $6.6 billion and employed 27,500 workers. Lake Forest, Illinois-based Pactiv Corp., spun off from Tenneco Inc. in 1999,
employed 16,000 workers who produced $3.1 billion in 2003 sales.
Workforce
The industry's 555,600-member work force was expected to benefit in the 2000s from strong growth in demand for plastics products. However, productivity gains achieved through automation and the integration of more efficient processing techniques was expected to contribute to a lag between shipment growth and new jobs. Opportunities for laborers were predicted to expand 30 to 40 percent between 1990 and 2005, according to the U.S. Bureau of Labor Statistics. For example, jobs for molding machine operators—which account for about 17 percent of the workforce—are expected to grow by 30 percent, as were positions for managers and executives. Better yet, jobs for sales professionals, industrial machine operators, and machinery mechanics are anticipated to skyrocket 50 to 70 percent by 2005. Unfortunately, workers in this industry receive, on average, only 80 percent of the wages paid in other U.S. manufacturing industries. Per hourly wages in 2000 averaged $12.03.
America and the World
Although exports and imports have traditionally played a minor role in the plastics products industry, imports (excluding bottles and plumbing) into the United States swelled six-fold during the 1980s to about $3.8 billion by 1991. By the early 1990s, the U.S. plastics products industry trade surplus had been whittled to only $200 million. While a weak dollar and increased industry productivity helped to buoy the trade surplus in 1992 and 1993, foreign competition was expected to increase in the long term. According to a September 2003 issue of Plastics News , this trade surplus had deteriorated to a trade deficit of $4.2 billion in 1997, which jumped to $13.9 billion in 2002. "The U.S. plastics processing industry's trade position has worsened dramatically in the past five years, with U.S. manufacturers increasingly losing out to imports in areas such as automobiles, audio and video equipment and institutional furniture."
One of the regions of greatest growth was China. Its plastics products shipments soared more than 200 percent during the 1980s, reaching approximately 4.1 billion tons by the early 1990s and reflecting average annual growth of about 12.5 percent. Chinese manufacturers suffered, however, from a lack of production equipment and access to processed raw materials. Although China's economic growth stimulated increased imports, a low per capita plastic consumption kept overall growth to 7 percent annually between 1997 and 2001. As capacity accelerated to meet demand during the early 2000s, China became a formidable competitor in export markets, particularly in fast growing East Asian countries. Asia, in general, is a strong growth area, with predicted annual growth rates of 10 percent, especially in ethylene propylene, vinyl chloride, and acrylonitrile. Within the Asian market, the largest increases could occur among ASEAN (Association of Southeastern Asian Nations) members, as new complexes come online. The rapid increase of plastics consumption within the Asian market stimulated U.S. producers to look at investing in local production plants.
Imports also rose in the wake of the North American Free Trade Agreement, as U.S. manufacturers move production facilities south of the border to Mexico to take advantage of inexpensive labor and reduced environmental restrictions. After Canada, Mexico was the second biggest importer of plastics goods into the United States during the late 1990s. Mexican imports were expected to rise rapidly in the early 2000s as Asian producers infiltrate the Mexican market to meet NAFTA requirements that 6 percent of a duty-free product's components be made in North America. The General Agreement on Tariffs and Trade (GATT) treaty limited international import duties on resins to 6.5 percent as of the year 2000, down from an average of 12.5 percent. The impact of the new tariffs on the market structure is still uncertain, although most predictions lean toward further increases in international trade.
Research and Technology
Going into the mid-1990s, major technological trends in the plastics products industry included the ability to recycle and faster concept-to-production cycles. Indeed, many companies were ardently seeking flexible processing, extrusion, and molding techniques that would allow them to design and quickly manufacture new products. One of the most important recycling tactics was "design-for-recycling," whereby plastics products and devices are created in such a way that they can be efficiently ground, melted, and reused. For example, glue and adhesives that can contaminate reground materials were being eliminated from manufactured plastic goods.
Further Reading
"Industry Trade Deficit Skyrockets, Study Says." Plastics News, 22 September 2003.
U.S. Census Bureau. "Statistics for Industry Groups and Industries: 2000." February 2002. Available from http://www.census.gov/prod/2002pubs/m00as-1.pdf .
——. "Value of Shipment for Product Classes: 2001 and Earlier Years." December 2002. Available from http://www.census.gov/prod/2003pubs/m01as-2.pdf .
Comment about this article, ask questions, or add new information about this topic: