SIC 3295
MINERALS AND EARTHS, GROUND OR OTHERWISE TREATED
This category includes establishments operating without a mine or quarry and primarily engaged in crushing, grinding, pulverizing, or otherwise preparing clay, ceramic, and refractory minerals; barite; and miscellaneous nonmetallic minerals, excluding fuels. These minerals are the crude products mined by establishments of Industry Groups 145 (clay, ceramic, and refractory minerals) and 149 (miscellaneous nonmetallic minerals, except fuels), and by those mining barite in SIC 1479: Chemical and Fertilizer Mineral Mining, Not Elsewhere Classified. Also included in this category are establishments primarily crushing slag and preparing roofing granules. The improvement or preparation of the minerals and metallic ores and the cleaning and grading of coal are classified in Mining, whether or not the operation is associated with a mine.
NAICS Code(s)
327992 (Ground or Treated Mineral and Earth Manufacturing)
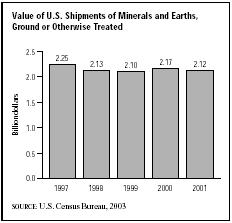
Products in this classification include barium, blast furnace slag, clay for petroleum refining, ground clay, activated clay desiccants, diatomaceous earth, filtering clays, Fuller's earth, kaolin, black lead, mica, pulverized earth, pumice roofing granules, talc, and vermiculite. The value of shipments in this industry tended to spike up and down throughout the 1980s and early 1990s, dropping as low as $1.17 billion in 1985 and rising as high as $1.85 billion in 1993. Fluctuations continued into the late 1990s and early 2000s, as shipments of $2.25 billion in 1997 fell to $2.1 billion in 1999, climbed to $2.17 billion in 2000, and fell to $2.12 billion in 2001.
No single product dominates this industry, with no product taking more than 15 percent of the market. Lightweight aggregate holds the largest share of the market, followed closely by crushed slag, dead-burned magnesia, and natural graphite. A wide range of other materials and earths holds the remaining share of the market. Kaolin was one of the biggest products within the industry in both intake and output, being an ingredient in several products. Once the kaolin was processed, it was sent to many different industries with a wide range of products. The biggest consumer in the early 2000s was the fiber-glass industry. Rubber and elastomeric industries took the next highest share, followed by sanitaryware and filler or extender, refractories, dinnerware, ceramic tile, and electrical porcelain.
The products produced by this industry tended to have a relatively low value compared to their weight. As a result of weight, truck transportation, warehousing, and rail transportation accounted for the highest percentage of the inputs used by the minerals and earths industry in the early 2000s. The raw materials accounted for the next highest percentage of all inputs. The power required to process ground mineral and earth products were also important inputs, with gas and electric utilities accounting for another high percentage of all inputs.
The production of ground minerals and earths was concentrated in five states, with Pennsylvania, Ohio, Illinois, Louisiana, and California accounting for roughly one-third of all product shipments. Pennsylvania was the largest single producing state.
In 2003 the leading companies in the ground minerals and earths industry included Eagle-Picher Industries Inc., of Cincinnati, Ohio, with $685 million in sales; Engelhard Corp. Pigments and Additives of Iselin, New Jersey, with $500 million in sales; and privately owned Edward C. Levy Co. of Detroit, Michigan, with sales of $200 million. Many companies operated out of the Southeastern and Midwestern United States, where abundant supplies of clay (kaolin) were located.
This industry employed an estimated 10,045 people in 2000. The total industry payroll was $368 million. Employment for production workers was expected to decline into the year 2006.
Further Reading
Bureau of the Census. Economic Census 1997. Washington, D.C.: GPO, 2000. Available from http://www.census.gov .
"Production Occupations Not Studied in Detail." 1998-99 Occupational Outlook Handbook, 2000. Available from http://stats.bls.gov .
U.S. Census Bureau. "Statistics for Industry Groups and Industries: 2000." February 2002. Available from http://www.census.gov/prod/2002pubs/m00as-1.pdf .
——. "Value of Shipments for Product Classes: 2001 and Earlier Years." December 2002. Available from http://www.census.gov/prod/2003pubs/m01as-2.pdf .
Comment about this article, ask questions, or add new information about this topic: