SIC 5149
GROCERIES AND RELATED PRODUCTS, NOT ELSEWHERE CLASSIFIED
This industry is comprised of wholesale distributors of groceries and related products, not elsewhere classified. Some of the products included in this category are: breakfast cereals, bottled water, canned goods, coffee, cookies, cooking oils, crackers, dairy products, pet food, flour, dried fruits, health foods, honey, macaroni and spaghetti, canned or dried milk, pickles, salad dressing, sauces, soft drinks, soups, refined sugar, and yeast. Establishments primarily engaged in the wholesale distribution of beer and ale are classified in SIC 5181: Beer and Ale. Wine is classified in SIC 5182: Wine and Distilled Alcoholic Beverages.
NAICS Code(s)
422490 (Other Grocery and Related Product Wholesalers)
Industry Snapshot
Grocery wholesalers and distributors buy grocery items from manufacturers or other distributors and typically resell them to retail—including grocery and convenience stores—or other commercial enterprises—including food service establishments—that in turn sell the goods to users. The wholesaling industry also includes many firms that import foreign goods or export U.S. products. In practice many wholesalers are integrated with manufacturing and retailing of grocery products as well.
Grocery wholesalers and distributors claim more than 50 percent of the complete grocery and related product sales. Manufacturers' sales offices and branches account for 25 percent, and brokers and agents share 19 percent.
Products within this industry are subdivided into six categories: coffee, tea, and spices (representing about 8.6 percent of the industry's sales volume); bread and baked goods (7.7 percent); soft drinks (13.5 percent); canned goods (23.0 percent); food and beverage basic materials (3.6 percent); and other grocery specialties (43.6 percent).
Background and Development
In 1997, Dun and Bradstreet listed 23,093 establishments engaged in the wholesale distribution of groceries and related products. The top 50 wholesale grocers shared 38.6 percent of the market in 1997, with each business averaging $1.62 billion in sales. The top 10 industry leaders totaled $54.2 billion in sales. Industry employment increased nearly 10 percent during the first half of the 1990s, reaching 270,000 workers with a payroll of $8.1 billion. Industry sales totaled more than $150 billion during the mid-1990s, which accounted for more than half of the broader grocery wholesaling market in the United States.
The industry faced diminished sales growth during the late 1990s. In 1997, the top 50 wholesale grocery giants reported sales of $81.1 billion, compared to $81 billion the previous year. One reason for the stagnation was competition from vertically integrated grocery retailers such as The Kroger Co. and Safeway Inc., which, because of their size, were able to buy goods directly from manufacturers—as well as to make many of their own private label products—rather than relying on other distributors. The warehouse clubs, such as Sam's Club, Costco, and BJ's also grabbed market share from traditional wholesalers by offering volume discounts to small businesses and consumers. In 1998 Sam's Club had 451 U.S. locations, BJ's had 96 U.S. locations, and Costco had 288 locations in the United States, Canada, the United Kingdom, Taiwan, Korea, and Mexico. Costco generated the most revenue in 1998, totaling $26 billion, while Sam's Club totaled $24.4 billion and BJ's $3.4 billion.
Current Conditions
According to the U.S. Census Bureau, there was a sharp decline in the total number of establishments in 2001, down to 13,703. There were approximately 301,333 employees with an annual payroll of $11.8 billion. By 2003, the total number of establishments had risen to 19,083, which together generated approximately $98 billion in sales, with the average sales per establishment totaling about $6.4 million. The total number of employees fell slightly to 256,719 people. California had the majority of the establishments with 3,427, followed by New York with 1,622, and Florida with 1,288.
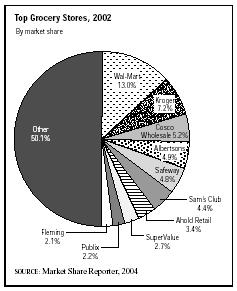
According to a report released from the U.S. Food Marketing System, the four largest U.S. grocery retailers accounted for 27.4 percent of sales. The eight largest accounted for 40.5 percent of sales, and the 20 largest controlled 52 percent of sales. The top ten grocery stores dominated almost 50 percent of the overall market and represented $728.7 billion in sales. According to the Market Share Reporter, the leading grocery stores in 2002 were Wal—Mart, Kroger, Costco Wholesale, Albertsons, Safeway, Sam's Clubs, Ahold Retail, Super-Value, Publix, and Fleming. States with the largest grocery markets according to the Market Share Reporter,
were California, Texas, Florida, New York, Pennsylvania, Ohio, Illinois, North Carolina, Michigan, and Georgia.
Canada exported a value of $2.5 million in food into the United States. Thailand was second, with $1.8 million, followed by Mexico with $659,321, China with $640,776, and Chile with $491,247. United States exports of miscellaneous food included Canada with $1.3 million, Japan with $1.3 million, South Korea with $282,582, Mexico with $206,005, and China with $144,133.
Industry Leaders
SuperValu Inc., of Minnesota, was the nation's largest grocery wholesale distributor in 1997, with more than 48,000 employees nationwide. Also a leading grocery retailer, SuperValu reported $16.6 billion in sales in that year, 71 percent of which was from its wholesale business. In 1999 SuperValu acquired Richfood Holdings Inc., of Virginia, the largest grocery wholesaler in the mid-Atlantic and the fourth largest overall, with $3.4 billion in sales during 1998. However, in 1999 Richfood lost a $600 million contract with its biggest customer, Giant Food Stores Inc., of Carlisle, Pennsylvania. The contract represented about 17 percent of Richfood's annual earnings.
Fleming Companies of Oklahoma City was the second largest U.S. grocery wholesaler in 1997, with approximately $13 billion in sales and a work force of 39,000 employees. But in 1999 Fleming announced a company-wide restructuring, cutting roughly 700 jobs and divesting itself of six supply centers and at least one retail operation. Fleming also said that it expected to lose $1 billion in sales over the next two years. In April of 2003, Fleming filed for bankruptcy protection, but planned to keep its Core—Mark convenience business. On August 26, 2003 C&S Wholesale Grocers announced its completed acquisition of the Fleming Companies. This acquisition allowed C&S Wholesale Grocers to expand its market presence into new areas. With Fleming no longer in the grocery arena that placed C&S Wholesale Grocers as the second largest U.S. grocery wholesaler, behind SuperValu Inc.
C&S Wholesale Grocers Inc., based in Brattleboro, Vermont, employed more than 2,800 workers and had annual sales of approximately $6 billion in 1998. The company provides customers with more than 53,000 food and non-food items, including meats, candy, tobacco, frozen foods, dairy, deli, and bakery products, and health and beauty aids.
The Food Institute reported there were a total of 40 mergers or acquisition in 2001, 35 in 2002, and 32 in 2003.
Further Reading
D&B Sales & Marketing Solutions, May 2004. Available from http://www.zapdata.com .
"Food Business Mergers & Acquisitions: 1997—2003." Food Institute, April 2004. Available from http://www.foodinstitute.com/merg2003.htm .
Lazich, Robert S. Market Share Reporter, Farmington Hills, MI: Gale Group, 2004.
U.S. Census Bureau. Statistics of U.S. Businesses 2001. April 2004. Available from http://www.census.gov/epcd/susb/2001/US421420.HTM .
Wistreich, Carl."C&S Wholesale Grocers Closes Fleming Acquisition and Begins Service to Fleming Customers in California and Hawaii." 26 August 2003. Available from http://www.cswg.com/pages/082603.htm .
Comment about this article, ask questions, or add new information about this topic: