COST-VOLUME-PROFIT ANALYSIS

Cost-volume-profit (CVP) analysis expands the use of information provided by breakeven analysis. A critical part of CVP analysis is the point where total revenues equal total costs (both fixed and variable costs). At this breakeven point (BEP), a company will experience no income or loss. This BEP can be an initial examination that precedes more detailed CVP analyses.
Cost-volume-profit analysis employs the same basic assumptions as in breakeven analysis. The assumptions underlying CVP analysis are:
- The behavior of both costs and revenues in linear throughout the relevant range of activity. (This assumption precludes the concept of volume discounts on either purchased materials or sales.)
- Costs can be classified accurately as either fixed or variable.
- Changes in activity are the only factors that affect costs.
- All units produced are sold (there is no ending finished goods inventory).
- When a company sells more than one type of product, the sales mix (the ratio of each product to total sales) will remain constant.
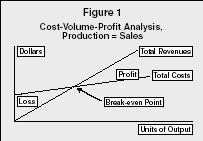
Cost-Volume-Profit Analysis, Production = Sales
In the following discussion, only one product will be assumed. Finding the breakeven point is the initial step in CVP, since it is critical to know whether sales at a given level will at least cover the relevant costs. The breakeven point can be determined with a mathematical equation, using contribution margin, or from a CVP graph. Begin by observing the CVP graph in Figure 1, where the number of units produced equals the number of units sold. This figure illustrates the basic CVP case. Total revenues are zero when output is zero, but grow linearly with each unit sold. However, total costs have a positive base even at zero output, because fixed costs will be incurred even if no units are produced. Such costs may include dedicated equipment or other components of fixed costs. It is important to remember that fixed costs include costs of every kind, including fixed sales salaries, fixed office rent, and fixed equipment depreciation of all types. Variable costs also include all types of variable costs: selling, administrative, and production. Sometimes, the focus is on production to the point where it is easy to overlook that all costs must be classified as either fixed or variable, not merely product costs.
Where the total revenue line intersects the total costs line, breakeven occurs. By drawing a vertical line from this point to the units of output (X) axis, one can determine the number of units to break even. A horizontal line drawn from the intersection to the dollars (Y) axis would reveal the total revenues and total costs at the breakeven point. For units sold above the breakeven point, the total revenue line continues to climb above the total cost line and the company enjoys a profit. For units sold below the breakeven point, the company suffers a loss.
Illustrating the use of a mathematical equation to calculate the BEP
requires the assumption of representative numbers. Assume that a company
has total annual fixed cost of $480,000 and that variable costs of all
kinds are found to be $6 per unit. If each unit sells for $10, then each
unit exceeds the specific variable costs that it causes by $4. This $4
amount is known as the unit contribution margin. This means that each unit
sold contributes $4 to cover the fixed costs. In this intuitive example,
120,000 units must be produced and sold in order to break even. To express
this in a mathematical equation, consider the following abbreviated income
statement:
Unit Sales = Total Variable Costs + Total Fixed Costs + Net Income
Inserting the assumed numbers and letting X equal the number of units to
break even:
$10.00X = $6.00X + $480,000 + 0
Note that net income is set at zero, the breakeven point. Solving this
algebraically provides the same intuitive answer as above, and also the
shortcut formula for the contribution margin technique:
Fixed Costs ÷ Unit Contribution Margin = Breakeven Point in Units
$480,000 ÷ $4.00 = 120,000 units
If the breakeven point in sales dollars is desired, use of the
contribution margin ratio is helpful. The contribution margin ratio can be
calculated as follows:
Unit Contribution Margin ÷ Unit Sales Price = Contribution Margin
Ratio
$4.00 ÷ $10.00 = 40%
To determine the breakeven point in sales dollars, use the following
mathematical equation:
Total Fixed Costs ÷ Contribution Margin Ratio = Breakeven Point in
Sales Dollars
$480,000 ÷ 40% = $1,200,000
The margin of safety is the amount by which the actual level of sales exceeds the breakeven level of sales. This can be expressed in units of output or in dollars. For example, if sales are expected to be 121,000 units, the margin of safety is 1,000 units over breakeven, or $4,000 in profits before tax.
A useful extension of knowing breakeven data is the prediction of target
income. If a company with the cost structure described above wishes to
earn a target income of $100,000 before taxes, consider the condensed
income statement below. Let X = the number of units to be sold to produce
the desired target income:
Target Net Income = Required Sales Dollars − Variable Costs
− Fixed Costs
$100,000 = $10.00X − $6.00X − $480,000
Solving the above equation finds that 145,000 units must be produced and sold in order for the company to earn a target net income of $100,000 before considering the effect of income taxes.
A manager must ensure that profitability is within the realm of possibility for the company, given its level of capacity. If the company has the ability to produce 100 units in an 8-hour shift, but the breakeven point for the year occurs at 120,000 units, then it appears impossible for the company to profit from this product. At best, they can produce 109,500 units, working three 8-hour shifts, 365 days per year (3 X 100 X 365). Before abandoning the product, the manager should investigate several strategies:
- Examine the pricing of the product. Customers may be willing to pay more than the price assumed in the CVP analysis. However, this option may not be available in a highly competitive market.
- If there are multiple products, then examine the allocation of fixed costs for reasonableness. If some of the assigned costs would be incurred even in the absence of this product, it may be reasonable to reconsider the product without including such costs.
- Variable material costs may be reduced through contractual volume purchases per year.
- Other variable costs (e.g., labor and utilities) may improve by changing the process. Changing the process may decrease variable costs, but increase fixed costs. For example, state-of-the-art technology may process units at a lower per-unit cost, but the fixed cost (typically, depreciation expense) can offset this advantage. Flexible analyses that explore more than one type of process are particularly useful in justifying capital budgeting decisions. Spreadsheets have long been used to facilitate such decision-making.
One of the most essential assumptions of CVP is that if a unit is produced in a given year, it will be sold in that year. Unsold units distort the analysis. Figure 2 illustrates this problem, as incremental revenues cease while costs continue. The profit area is bounded, as units are stored for future sale.
Unsold production is carried on the books as finished goods inventory. From a financial statement perspective, the costs of production on these units are deferred into the next year by being reclassified as assets. The risk is that these units will not be salable in the next year due to obsolescence or deterioration.
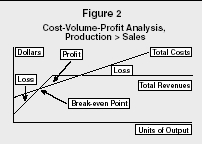
Cost-Volume-Profit Analysis, Production > Sales
While the assumptions employ determinate estimates of costs, historical data can be used to develop appropriate probability distributions for stochastic analysis. The restaurant industry, for example, generally considers a 15 percent variation to be "accurate."
APPLICATIONS
While this type of analysis is typical for manufacturing firms, it also is appropriate for other types of industries. In addition to the restaurant industry, CVP has been used in decision-making for nuclear versus gas- or coal-fired energy generation. Some of the more important costs in the analysis are projected discount rates and increasing governmental regulation. At a more down-to-earth level is the prospective purchase of high quality compost for use on golf courses in the Carolinas. Greens managers tend to balk at the necessity of high (fixed) cost equipment necessary for uniform spreadability and maintenance, even if the (variable) cost of the compost is reasonable. Interestingly, one of the unacceptably high fixed costs of this compost is the smell, which is not adaptable to CVP analysis.
Even in the highly regulated banking industry, CVP has been useful in pricing decisions. The market for banking services is based on two primary categories. First is the price-sensitive group. In the 1990s leading banks tended to increase fees on small, otherwise unprofitable accounts. As smaller account holders have departed, operating costs for these banks have decreased due to fewer accounts; those that remain pay for their keep. The second category is the maturity-based group. Responses to changes in rates paid for certificates of deposit are inherently delayed by the maturity date. Important increases in fixed costs for banks include computer technology and the employment of skilled analysts to segment the markets for study.
Even entities without a profit goal find CVP useful. Governmental agencies use the analysis to determine the level of service appropriate for projected revenues. Nonprofit agencies, increasingly stipulating fees for service, can explore fee-pricing options; in many cases, the recipients are especially price-sensitive due to income or health concerns. The agency can use CVP to explore the options for efficient allocation of resources.
Project feasibility studies frequently use CVP as a preliminary analysis. Such major undertakings as real estate/construction ventures have used this technique to explore pricing, lender choice, and project scope options.
Cost-volume-profit analysis is a simple but flexible tool for exploring potential profit based on cost strategies and pricing decisions. While it may not provide detailed analysis, it can prevent "do-nothing" management paralysis by providing insight on an overview basis.
SEE ALSO: Break-Even Point ; Cost Accounting
John M. Alvis
FURTHER READING:
Bahe, Anita R. "Markets for High Quality Compost." BioCycle 37, no. 7 (1996): 83.
Caldwell, Charles W., and Judith K. Welch. "Applications of Cost-Profit-Volume Analysis in the Governmental Environment." Government Accountants Journal, Summer 1989, 3–8.
Clarke, Peter. "Bring Uncertainty into the CVP Analysis." Accountancy, September 1986, 105–107.
Davis, Joseph M. "Project Feasibility Using Breakeven Point Analysis." Appraisal Journal 65, no. 1 (1998): 41–45.
Greenberg, Carol. "Analyzing Restaurant Performance: Relating Cost and Volume to Profit." Cornell Hotel & Restaurant Administration Quarterly 27, no. 1 (1986): 9–11.
Hanna, Mark D., W. Rocky Newman, and Sri V. Sridharan. "Adapting Traditional Breakeven Analysis to Modern Production Economics: Simultaneously Modeling Economies of Scale and Scope." International Journal of Production Economics 29, no. 2 (1993): 187–201.
Harris, Peter J. "Hospitality Profit Planning in the Practical Environment: Integrating Cost-Volume-Profit Analysis with Spreadsheet Management." International Journal of Contemporary Hospitality Management 4, no. 4 (1992): 24–32.
Horngren, Charles T., George Foster, and Srikant M. Datar. Cost Accounting: A Managerial Emphasis. 9th ed. Upper Saddle River, NJ: Prentice Hall, 1997.
Kabak, Irwin W., and George J. Siomkos. "Adapting to a Changing System Procedure." Industrial Engineering 25, no. 4 (1993): 61–62.
Kuehn, Steven E. "Nuclear Power: Running with the Competition." Power Engineering 14, no. 1 (1994): 14.
Mathews, Ryan. "Rationalizing SKUs." Progressive Grocer, February 1996, 43–46.
McMahon, Seamus P. "Marketing Perspectives: Setting Retail Prices." Bank Management, January 1992, 46–49.
Sherman, Lawrence F., Jae K. Shim, and Mark Hartney. "Short Run Break-Even Analysis for Real Estate Projects." Real Estate Issues, Spring/Summer 1993, 15–20.
Weygandt, Jerry J., Donald E. Kieso, and Paul D. Kimmel. Managerial Accounting: Tools for Business Decision Making. Hoboken, NJ: John Wiley & Sons Inc., 2005.
Comment about this article, ask questions, or add new information about this topic: