MODELS AND MODELING

A model is an abstraction of reality or a representation of a real object or situation. In other words, a model presents a simplified version of something. It may be as simple as a drawing of house plans, or as complicated as a miniature but functional representation of a complex piece of machinery. A model airplane may be assembled and glued together from a kit by a child, or it actually may contain an engine and a rotating propeller that allows it to fly like a real airplane.
Types of Models
A more useable concept of a model is that of an abstraction, from the real problem, of key variables and relationships. These are abstracted in order to simplify the problem itself. Modeling allows the user to better understand the problem and presents a means for manipulating the situation in order to analyze the results of various inputs ("what if" analysis) by subjecting it to a changing set of assumptions.
MODEL CLASSIFICATIONS
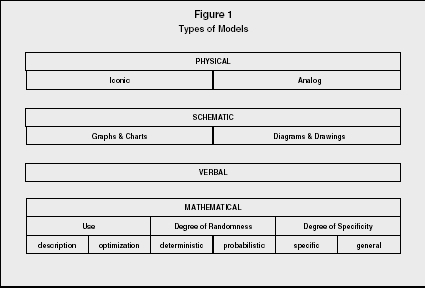
Some models are replicas of the physical properties (relative shape, form, and weight) of the object they represent. Others are physical models but do not have the same physical appearance as the object of their representation. A third type of model deals with symbols and numerical relationships and expressions. Each of these fits within an overall classification of four main categories: physical models, schematic models, verbal models, and mathematical models.
PHYSICAL MODELS.
Physical models are the ones that look like the finished object they represent. Iconic models are exact or extremely similar replicas of the object being modeled. Model airplanes, cars, ships, and even models of comic book super-heroes look exactly like their counterpart but in a much smaller scale. Scale models of municipal buildings, shopping centers, and property developments such as subdivisions, homes, and office complexes all hopefully look exactly as the "real thing" will look when it is built. The advantage here is the models' correspondence with the reality of appearance. In other words, the model user can tell exactly what the proposed object will look like, in three dimensions, before making a major investment.
In addition to looking like the object they represent, some models perform as their counterparts would. This allows experiments to be conducted on the model to see how it might perform under actual operating conditions. Scale models of airplanes can be tested in wind tunnels to determine aerodynamic properties and the effects of air turbulence on their outer surfaces. Model automobiles can be exposed to similar tests to evaluate how wind resistance affects such variables as handling and gas mileage. Models of bridges and dams can be subjected to multiple levels of stress from wind, heat, cold, and other sources in order to test such variables as endurance and safety. A scale model that behaves in a manner that is similar to the "real thing" is far less expensive to create and test than its actual counterpart. These types of models often are referred to as prototypes.
Additionally, some physical models may not look exactly like their object of representation but are close enough to provide some utility. Many modern art statues represent some object of reality, but are so different that many people cannot clearly distinguish the object they represent. These are known as analog models. An example is the use of cardboard cutouts to represent the machinery being utilized within a manufacturing facility. This allows planners to move the shapes around enough to determine an optimal plant layout.
SCHEMATIC MODELS.
Schematic models are more abstract than physical models. While they do have some visual correspondence with reality, they look much less like the physical reality they represent. Graphs and charts are schematic models that provide pictorial representations of mathematical relationships. Plotting a line on a graph indicates a mathematical linear relationship between two variables. Two such lines can meet at one exact location on a graph to indicate the break-even point, for instance. Pie charts, bar charts, and histograms can all model some real situation, but really bear no physical resemblance to anything.
Diagrams, drawings, and blueprints also are versions of schematic models. These are pictorial representations of conceptual relationships. This means that the model depicts a concept such as chronology or sequence. A flow chart describing a computer program is a good example. The precedence diagrams used in project management or in assembly-line balancing show the sequence of activities that must be maintained in order to achieve a desired result.
VERBAL MODELS.
Verbal models use words to represent some object or situation that exists, or could exist, in reality. Verbal models may range from a simple word presentation of scenery described in a book to a complex business decision problem (described in words and numbers). A firm's mission statement is a model of its beliefs about what business it is in and sets the stage for the firm's determination of goals and objectives.
Verbal models frequently provide the scenario necessary to indicate that a problem is present and provide all the relevant and necessary information to solve the problem, make recommendations, or at least determine feasible alternatives. Even the cases presented in management textbooks are really verbal models that represent the workings of a business without having to take the student to the firm's actual premises. Oftentimes, these verbal models provide enough information to later depict this problem in mathematical form. In other words, verbal models frequently are converted into mathematical models so that an optimal, or at least functional, solution may be found utilizing some mathematical technique. A look in any mathematics book, operations management book, or management science text generally provides some problems that appear in word form. The job of the student is to convert the word problem into a mathematical problem and seek a solution.
MATHEMATICAL MODELS.
Mathematical models are perhaps the most abstract of the four classifications. These models do not look like their real-life counterparts at all. Mathematical models are built using numbers and symbols that can be transformed into functions, equations, and formulas. They also can be used to build much more complex models such as matrices or linear programming models. The user can then solve the mathematical model (seek an optimal solution) by utilizing simple techniques such as multiplication and addition or more complex techniques such as matrix algebra or Gaussian elimination. Since mathematical models frequently are easy to manipulate, they are appropriate for use with calculators and computer programs. Mathematical models can be classified according to use (description or optimization), degree of randomness (deterministic and stochastic), and degree of specificity (specific or general). Following is a more detailed discussion of mathematical model types.
TYPES OF MATHEMATICAL MODELS
DESCRIPTIVE MODELS.
Descriptive models are used to merely describe something mathematically. Common statistical models in this category include the mean, median, mode, range, and standard deviation. Consequently, these phrases are called "descriptive statistics." Balance sheets, income statements, and financial ratios also are descriptive in nature.
OPTIMIZATION MODELS.
Optimization models are used to find an optimal solution. The linear programming models are mathematical representations of constrained optimization problems. These models share certain common characteristics. Knowledge of these characteristics enables us to recognize problems that can be solved using linear programming.
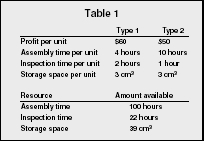
For example, suppose that a firm that assembles computers and computer equipment is about to start production of two new types of computers. Each type will require assembly time, inspection time, and storage space. The amounts of each of these resources that can be devoted to the production of the computers is limited. The manager of the firm would like to determine the quantity of each computer to produce in order to maximize the profit generated by their sale. In order to develop a suitable model, the manager has obtained the information in Table 1.
| Type 1 | Type 2 | |
| Profit per unit | $60 | $50 |
| Assembly time per unit | 4 hours | 10 hours |
| Inspection time per unit | 2 hours | 1 hour |
| Storage space per unit | 3 cm 3 | 3 cm 3 |
| Resource | Amount available | |
| Assembly time | 100 hours | |
| Inspection time | 22 hours | |
| Storage space | 39 cm 3 | |
In this problem, the total impact of each type of computer on the profit and each constraint is a linear function of the quantity of that variable. By completing the model with the relevant constraints, the user has a suitable model for determining the quantity of each computer to produce in order to maximize (the optimum) the firm's profit. Optimization also can mean minimization when referring to financial losses, scrap, rework, time, or distance. Again, optimization models may be used in this sense.
DETERMINISTIC MODELS.
Deterministic models are those for which the value of their variables is known with certainty. In a previous example, the manager knew profit margins and constraint values with certainty. This makes the linear programming model a deterministic optimization model.
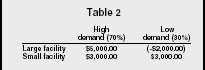
Models that have values that are not known with certainty are said to be stochastic or probabilistic models. For example, a manufacturer that is having trouble deciding whether to build a large or small facility knows that the solution to this capacity problem depends upon the volume of demand that materializes. High demand would require a large facility while low demand would require a small facility. While the manufacturer has no way of knowing with certainty what demand will be, it can at least determine the probability of the occurrence of each. For example, if the manufacturer estimates that the probability of the occurrence of high demand is 70 percent and the occurrence of low demand is 30 percent, it can use this information along with the monetary value (expected payoff) of each situation to construct mathematical models such as payoff matrices or decision trees to find an optimal decision (see Table 2).
| High demand (70%) | Low demand (30%) | |
| Large facility | $5,000.00 | (-$2,000.00) |
| Small facility | $3,000.00 | $3,000.00 |
This type of model can be said to be a stochastic optimization model. Some models can even be very similar with the degree of randomness being the key differentiator. For example, in project management techniques, program evaluation and review technique (PERT) and the critical path method (CPM) are very similar except that CPM is used whenever the required time to complete the activities is known and PERT is used whenever the required activity times are not known but can be estimated. CPM is considered to be deterministic while PERT generally is said to be probabilistic. Once the activity times are established, the two techniques are virtually the same throughout the remainder of the problem's completion.
SPECIFIC MODELS.
Specific models apply to only one situation or model one unique reality. The previous examples of profit function (descriptive), objective function (optimization), and payoff matrix (probabilistic) are all specific models. In other words, the values established in the model are relevant for that one unique situation. Linear programming models can be said to be deterministic specific, while decision trees can be called probabilistic specific models.
GENERAL MODELS.
General models can be utilized in more than one situation. For example, the question of how much to order is determined by using an economic order quantity (EOQ) model. EOQ models identify the optimal order quantity by minimizing the sum of certain annual costs that vary with order size. On the other hand, the question of how much should be ordered for the next (fixed) interval is determined by the fixed order interval (FOI) model, which is used when orders must be placed at fixed time intervals (weekly, twice, etc.).
USING THE CLASSIFICATIONS
Knowing the type of model that is required provides the user with some advantage when converting a verbal model to a mathematical model. For example, if the decision maker reads the verbal model and determines that the situation is probabilistic and uses situation-specific variables, he or she might seek to convert the verbal model to a payoff matrix or a decision tree (both examples of stochastic/probabilistic specific models).
BENEFITS OF MODEL USE
The goal of modeling use is to adequately portray realistic phenomenon. Once developed properly, a great deal can be learned about the real-life counterpart by manipulating a model's variables and observing the results.
Real-world decisions involve an overwhelming amount of detail, much of which may be irrelevant for a particular problem or decision. Models allow the user to eliminate the unimportant details so that the user can concentrate on the relevant decision variables that are present in a situation. This increases the opportunity to fully understand the problem and its solution.
In his book, Operations Management, William J. Stevenson lists nine benefits of models:
- Models generally are easy to use and less expensive than dealing with the actual situation.
- Models require users to organize and sometimes quantify information and, in the process, often indicate areas where additional information is needed.
- Models provide a systematic approach to problem solving.
- Models increase understanding of the problem.
- Models enable managers to analyze "what if" questions.
- Models require users to be very specific about objectives.
- Models serve as a consistent tool for evaluation.
- Models enable users to bring the power of mathematics to bear on a problem.
- Models provide a standardized format for analyzing a problem.
MODEL CONSTRUCTION
The accuracy of the results of the model analysis is dependent upon how well the model represents reality. The closer the model is to its actual counterpart, the more accurate the conclusions drawn and the predictions made about the object of attention. Hence, the model user must strive for the most accurate representation possible. Model users also must be careful to identify the decision variable values that provide the best output for the model. This is referred to as the model's optimal solution. However, the model user also must be careful not to include irrelevant variables that may cloud the picture and cause inaccurate conclusions or force the model user to spend an unnecessary amount of time in analysis.
In their book Operations Management: Concepts, Methods, and Strategies, Mark Vonderembse and Gregory White present a step-by-step process for successfully building a useful model:
- Define the problem, decision, situation, or scenario and the factors that influence it.
- Select criteria to guide the decision, and establish objectives. A perfect example of this is the use of heuristics in assembly-line balancing to guide the decision and the criteria of maximizing efficiency/minimizing idle time as an objective.
- Formulate a model that helps management to understand the relationships between the influential factors and the objectives the firm is trying to achieve.
- Collect relevant data while trying to avoid the incorporation of superfluous information into the model.
- Identify and evaluate alternatives. Once again, the example of assembly-line balancing is appropriate. The user can manipulate the model by changing the heuristics and comparing the final results, ultimately finding an optimal solution through trial-and-error. However, the production of alternatives may not be necessary if the model in use initially finds an optimal solution.
- Select the best alternative
- Implement the alternative or reevaluate
If the user is not familiar with models and their use, he or she would be wise to study the variety of models that are available for use and seek to understand their purpose and how each is used to generate results. Additionally, the user would be well served to learn how the individual model's results are interpreted and used, and what assumptions and limitations apply to each.
ADVANTAGES AND DISADVANTAGES
Models provide the most effective means developed for predicting performance. It is hard to conceive a prediction system that is not finally a model. To construct a model of a real process or system, careful consideration of the system elements that must be abstracted is required. This in itself usually is a profitable activity, for it develops insights into the problem. When building a model, we are immediately struck with the magnitude of our ignorance. What do we really know? Where are the gaps in available data? It is often impractical or impossible to manipulate the real world system in order to determine the effect of certain variables. Business systems are typical, for in order to use the business system itself as a laboratory could be disastrous and very costly. The dangers in using predictive models lie in the possibility of oversimplifying problems to keep models in workable form. The decision maker may place too much faith in a seemingly rigorous and complete analysis.
It is important for the model user to realize that model development and model solution are not completely separable. While the most accurate representation possible may seem desirable, the user still must be able to find a solution to the modeled problem. Model users need to remember that they are attempting to simplify complex problems so that they may be analyzed easily, quickly, and inexpensively without actually having to perform the task. Also desirable is a model that allows the user to manipulate the variables so that "what if" questions can be answered.
Models come in many varieties and forms, ranging from the simple and crude to the elegant and exotic. Whatever category they are in, all models share the distinction of being simplifications of more complex realities that should, with proper use, result in a useful decision-making aid.
Models are important and widely used in management. Marketing managers utilize the product life cycle model to facilitate understanding of the phases of product life. Accounting managers use ratios, such as the current ratio and the quick ratio, to quickly grasp the ability of an organization to pay its bills in the short term. Information systems managers have flow diagrams to depict the logic needed to develop a computerized order-entry system. Financial managers use net present value and internal rate of return in analyzing investment alternatives. Operations managers have precedence diagrams, decision trees, lot sizing models, material requirements planning, assembly-line balancing, and a host of other models they can use to make better decisions. Organizational performance is a result of the decisions that management makes. Models make these decisions easier to understand and often can lead to an optimal choice.
Kyriaki Kosmidou and
Constantin Zopounidis
FURTHER READING:
Buffa, Elwood S. Operations Management: Problems and Models. 3rd ed. New York: Wiley, 1972.
Meredith, Jack R., and Scott M. Shafer. Operations Management for MBAs. New York: John Wiley & Sons, 1999.
Stevenson, William, J. Operations Management. 7th ed. Boston: McGraw-Hill/Irwin, 2002.
Vonderembse, Mark A., and Gregory P. White. Operations Management: Concepts, Methods, and Strategies. 3rd ed. Minneapolis/St. Paul, MN: West Publishing Company, 1996.