Photo Framing
BUSINESS PLAN
TALKING PHOTO TECHNOLOGY
17351 Sunset Blvd. #404
Pacific Palisades, CA 90272
(310)573-9898
October 1992
This business plan for a mulitmedia application for photo displays outlines how extensive market research and an advanced product launch can create a profitable place in the booming photograph frame industry. The plan features discussions of the company's two products and its marketing strategy. This business plan has not been disguised, but the product names have been changed.
- SUMMARY
- THE MANAGEMENT TEAM
- THE PRODUCTS
- INITIAL MARKET PENETRATION
- ADVANCED MARKETING
- ADDITIONAL MARKETS
- SALES PLAN AND COMMISSIONS
- THE INDUSTRY
- MARKET SIZE AND LONGEVITY
- PROTECTION OF PRODUCTS
- MANUFACTURING
- COMPETITION
- RESELLERS
- END USERS
- PRICING
- INCENTIVES
- KEY PERSONNEL
- STANDARD PERSONNEL
- LOCATION OF FACILITY
- QUALITY CONTROL
- INSURANCE
- ADDITIONAL PRODUCTS
- BREAK EVEN ANALYSIS
- USE OF FUNDS
- ECONOMIC FORECAST
- FINANCIALS
- CONTINGENCIES
- ALTERNATIVE DEAL
- EXIT
- ASSUMPTIONS
SUMMARY
Talking Photo Technology is focused on the manufacturing and marketing of patentable products that integrate multiple pictures with sound or speech at an affordable price. The simplicity of the technology, though designed for the consumer market, can easily be adapted for business applications. The first two products are "PortraiTalk" and "SoundPhoto."
The photo-frame business has doubled every year for the last ten years. We have advanced the current stage of high-tech "talking picture frames" to the next level with our unique multi-photo talking concept. "PortraiTalk" is a wall-mounted eight-picture photo display. Each of the standard size, 3.5" × 5" pictures, is set within a light-illuminating frame. A different 20-second recorded message, synchronized to the lighted plexiglass shell, plays back when that photo frame is illuminated. Each picture can be recorded or rerecorded independently from the others. "PortraiTalk" has a high perceived value so it can easily be sold at the full price of $79.95 or a discounted price of $69.95.
"SoundPhoto," the desktop version, displays photos in a continuous loop. As each picture is displayed within the window, a 20-second synchronized message plays back the message attached to that 3.5" × 5" photo. This smaller version, holding the same number of portrait photos as the wall unit, is ideally suited for an office or coffee table. "SoundPhoto" can be sold at the full price of $49.95 or a discounted price of $39.95.
The company has dramatically broadened the photo frame market by combining multiple pictures with recorded messages. This combination has merged the simplicity of individual photos and the sound recording of a VCR into a visually appealing product. Offering two different but similar products to retailers at two different price points greatly enhances the company's chances of success. Both of these low-tech tape products have distinct advantages over the high-tech digital products in cost, recording longevity, twin channels or simulated stereo, and the adaptability to other markets.
The estimated number of projected sales during the first five full years, through all channels of distribution, could reach two million for the desktop unit and one million for the wall unit. The estimated cost of manufacturing and assembly, in minimum production, is $9.00 for "SoundPhoto" and $15.00 for "PortraiTalk."
Larry Koenig, the CEO and inventor, has over 12 years in cataloging and selling cutting-edge consumer products. Ken Tarlow, the prototype designer and engineer, has over 20 years in product development. Jules Sacks, Bill Adelman and Sam Friedman, the marketing and sales team, have 60 years in the combined fields.
The company is seeking investment capital of $600,000 for tooling and molding, marketing, operations, preliminary orders for 25% of the company's stock. This should return $5.9 million after an IPO at the end of the third full year, representing a 9.8% return on investment, based upon a 10 to 1 ratio.
THE MANAGEMENT TEAM
Larry Koenig, CEO and creator of the products in Talking Photo Technology, has over 12 years of experience in selecting, marketing, and selling high and low tech products. His knowledge in marketing and promotion came as the founder and president of The Price of His Toys, a nationally known catalog company and retail operation. His use of creative promotions and public relations made his company appear like a giant in the industry to its competitors, suppliers and customers.
Mr. Koenig has been involved with marketing and cataloging since the late 1970s. During this period he occasionally developed and successfully sold original products through his catalog and retail operation. As president of this 30-person company, Mr. Koenig has had to wear many hats from CEO, CFO, and computer programmer to catalog designer and writer.
During and before this period, Mr. Koenig had successfullyowned and operated a series of small professional pharmacies in the Southern California area.
Kenneth Tarlow, the prototype designer, has over 20 years experience in the field. He was founder and president of T-2 Design, where for eight years he worked with hundreds of inventors by guiding them through the various stages of product development.
Prior to T-2 Design, Mr. Tarlow was President of Olympic Group, Inc., a full service and product development company. He was responsible for the aesthetic and engineering design of over 15 consumer products, some of which are still on the market today. Mr. Tarlow was directly or indirectly responsible for the design, production and marketing of over 200 successful products. These products resulted in $400 million in retail sales.
Jules Sacks, VP for Sales and Marketing, is thoroughly experienced in sales, marketing and product development. He has recruited, trained and managed a large sales force for several successful companies. Mr. Sacks has developed excellent national contacts among power retailers, discount chains, mass merchandisers, department stores, membership clubs, and home shopping networks. He achieved a marked degree of success as Executive Vice President at Datawave where he increased their business by 230% and reduced their expenses by 30% over a three year span. Before that, he had worked for Sanyo Fisher (USA) for five years, with his last year as a National Sales Manager, Special Markets. He has always managed to increase sales and reduce overhead in the five major companies he has worked for since 1980.
Bill Adelman, National Sales Manager, has spent the last 13 years working as regional manager for Jack Carter Associates, where he has been exposed to all types of consumer electronic and personal care products from manufacturers like Sharp, Nintendo, Maxell, Harmon Kardon, Bell Atlantic, Mitsubishi and Betty Crocker. In many instances, he has managed to increase sales volumes within his territories by improving merchandising concepts and acquiring new accounts. Mr. Adelman has developed a personal relationship with many large and small accounts in California and across the country. He has never worked less than five years with any company since 1970, and has always improved their financial and customer relations positions.
Sam Friedman, computer coordinator, has an extensive background in sales, marketing and computer integration. He was president of Datacon Computer System, a three million dollar marketing and graphic company. He has a degree in advanced programming and systems design, and has worked for a variety of major companies from Coca-Cola Bottling Company and TRW Information Systems Group to Universal Studio/MCA and Ralphs Markets. Mr. Friedman has set up direct sales systems and has worked with a number of sales representatives from various fields.
Rob Frankel, president of Frankel & Anderson, is an experienced marketing/advertising person with a broad range of capabilities. He has worked with a variety of startup companies ranging from computer software to catalogs. He understands their needs and budgets by focusing on strategic planning. Mr. Frankel has run his company since 1986. He has started in the advertising field as an entry level writer and worked his way up to a creative director. He has held that position in several top level firms.
Additional management professionals, ranging from regional managers to financial experts, can be hired from the vast pool of talented people available due to the recession.
THE PRODUCTS
The prototypes stages have evolved from an initial book version to the free standing unit, using eight wallet pictures, to the final version wall unit. The evolution was necessary to determine how the public perceived the product and to finalize the mechanical system. Prototyping is the only effective way to prove the product would work cost effectively. The mechanics and the lighting system work the same in the prototype and the final version of "PortraiTalk."
"PortraiTalk" uses standard size 3.5" × 5" photos that are set within their own light-illuminating frame. Starting with the first of six vertical pictures and ending with two horizontal pictures, the frames light up sequentially. This illumination is synchronized to a 20-second message that can be recorded and/or rerecorded independently from the other pictures, so a total story can be told. The controls are set on the right hand side for easy access while the unit hangs on the wall. The frames are illuminated by separate back lights, which can be clear or in color. The customer can determine this by inserting the desired colored filters.
"SoundPhoto," is the lower priced, desktop version. Eight 3.5" × 5" vertical pictures are set in a continuous loop inside of a cube, measuring 6" × 6" × 7.5". As each photo is displayed in the framed window, a 20-second synchronized message plays back the recorded information attached to that individual picture. The desktop version has a different design, but still takes advantage of the mechanical principle used in the wall unit.
The 20-second record/playback message was chosen based upon testing with shorter and longer play time. A 30-second message is approximately 100 words based upon a prewritten script. A 20-second message equals 60 to 65 words or four to five independent sentences. This will depend on the clarity of thoughts and the speed of speech.
Kodak recently did a test and selected a 30-second record/playback for their single photo based upon a test market survey of over 1,000 people. The company feels that viewers' attention spans are very short. While 30 seconds might work for a single photo it would be too long for multiple pictures. This was further proven after demonstrating multiple photos with either seven or 30 second recording. Four sentences (60 words) was the maximum amount of time that people would stay focused on a picture. The company's initial prototype was seven seconds, which was too short. The second prototype had used 30 seconds (100 words) per photo, and appeared to lose the focus of the audience after two photos.
The company's patentable concept allows for easy recording and rerecording of any of the individual time slots. The tape and pictures can be easily removed and replaced by a new combination. Additionally, as both units use mechanical synchronization, the assembly can be readjusted for a longer or shorter record/playback time for the next generation. This can be done by having an inset gear assembly designed to change speeds. An eight-photo display was chosen for each unit based upon the ratio of perceived value to size and cost.
The twin channel recording capability of the products allows for the overlay of music on one channel while speech can be recorded on another. This concert-hall effect, which is not available with digital technology in this price range, adds to the enjoyment of the products.
INITIAL MARKET PENETRATION
The marketing of new products is rapidly changing. The uses of advertising and public relation's editorial copy are the recognized formulas that still work in promoting retail and catalog sales. New methods consist of infomercials, TV shopping services, multi-level marketing, interactive computer sales, and interactive TV. Most of these new ways, though sales oriented themselves, can be uses as a bridge for promoting the retail market, which accounts for 75% of total sales.
Manufacturers' representatives are the primary sales people that small- and medium-sized companies use to sell their products within the retail and catalog markets. It is important to coordinate with the representative who has major connections and who can meet with top level buyers. The company's sales team can set up a national organization.
The company feels it could have preproduction units within 60 to 90 days from initial funding. If time is available, these units can be used to solicit last minute wholesale orders from the retailers and catalogers for the Christmas season.
TV home shopping can be solicited quite late into the Christmas buying season. The two major TV home shopping companies operate under different premises. Home Shopping Network places an order and buys the product directly on a guaranteed sales basis (they can return what doesn't sell). TV shopping does not have the same time constraints that retailers or catalogers have. They usually expect a 40% discount off of the retail price, with another 10% going for commissions.
The company feels that the direct sales method will be the initial marketing direction for the first Christmas season regardless of wholesale, catalog, or TV home shopping. Direct sales establishes the correct markets, the proper pricing and the initial advertising for retail. Promotions and sales at the end of the first year for these year-round products serve as an excellent jumping-off point for the following year.
The direct marketing promotions will start 60 days before the product is received by using the pre-production models. Brochures can be printed, ads can be designed and placed in magazines, short-form infomercials (one minute spots) can be produced, and TV air time can be bought or bartered.
The brochures for each product will be produced in individual full-color one-page format. These brochures can be used as part of the direct sales campaign, informational public relation pieces, bounce back inserts for selective catalogers, and a wholesale marketing campaign.
The print advertisements consist of a variety of small placement ads inserted in newspapers and magazines. These are more effective than only a few large ones. The company hopes to place as many as possible through barter and PI (per inquiry), with the balance purchased directly.
Direct TV sales for short form (one minute spot) can be produced for under $5,000. The company intends to place as many of these spots through barter and PI as possible. Both items will be tested in different locals, time slot, and prices. A bounce back advertisement could be inserted in the orders for the version not offered in that particular ad.
Bounce back inserts is a method many catalogers use during the fulfillment process. This method of generating extra revenue can be used at the last minute as long as a deal can be structured with certain catalogers.
Life Extensions, a Multi Level Marketing (MLM) company has expressed an interest in the product and in promoting it to their 50,000 downline members.
The company's catalog knowledge and writing skills will aid us in these areas. A public relation campaign will start 30 days before receiving our first shipment and will continue through year end in hope of enticing retailers and direct sales.
ADVANCED MARKETING
Once the products have been launched and the retail and catalog sales force are in place, the next stage will be emphasized. Major resellers from department stores to catalogers will be contacted directly and through trade shows.
To ensure the success in selling to the larger companies, a number of separate deals will have to be worked out. Price and terms are their primary concerns. The negotiations will depend on how successful the products appear to be initially and their perceived value or recognition in the marketplace.
The company's projected sales are driven in the two following ways. The first is through advertising and promotion.

| Type | Driven By |
| Direct Sales | Consumer Advertising |
| Catalog | Trade Advertising and Sales Marketing |
| Retailers or Resellers | Trade Advertising and Sales Marketing |
| Specialty and Premium | Promotions |
The second is based on the time of year. The following chart will illustrate the months of the year versus the percentages of sales and the reasons. The last three months of the year are approximately equal to the first nine months in sales volume. The percentages could vary depending on promotions and seasonal events.
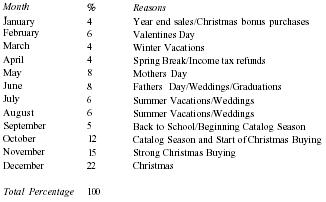
| Month | % | Reasons |
| January | 4 | Year end sales/Christmas bonus purchases |
| February | 6 | Valentines Day |
| March | 4 | Winter Vacations |
| April | 4 | Spring Break/Income tax refunds |
| May | 8 | Mothers Day |
| June | 8 | Fathers Day/Weddings/Graduations |
| July | 6 | Summer Vacations/Weddings |
| August | 6 | Summer Vacations/Weddings |
| September | 5 | Back to School/Beginning Catalog Season |
| October | 12 | Catalog Season and Start of Christmas Buying |
| November | 15 | Strong Christmas Buying |
| December | 22 | Christmas |
| Total Percentage | 100 |
Media Results
The price of a direct sales ad is related to size, media circulation, and use of four-color printing. A small ad (2" × 2" or 1/12 page for a magazine) will probably average $500, based upon a 500,000 circulation. This should return ten orders for the desktop or five orders for the wall unit in the base months of January, March or April (4%). February (the 6% month) will show a 50% increase for the same amount of advertising. These assumptions are based upon a quality ad placed in a receptive media.
Wholesale and catalog sales are more difficult to measure when matched against trade advertising. These ads usually just open doors for sales reps to close the deals. The sales of retail versus catalog have a ratio of 4 to 1. Therefore 20% of every trade advertisement will be devoted to catalog sales and 80% to retail. These trade expenses are listed as a single entry but drive the combination of both products, since many companies are active in both fields. Direct mail is the optimum method of solicitation to this industry. Every $500 spent should generate 1,000 direct mail pieces. This should produce a 0.75% return or 7.5 orders per 1,000, especially if some form of telemarketing was used as reenforcement. The average order should be ten desktop units and five wall units per order. The same seasonality that affects direct sales also affects wholesale and catalog sales.
The company will initially focus on the prestigious resellers. These resellers set a pricing standard and have customers who can afford the higher perceived value of the products. These non-discount retail stores and premium catalogs should establish and retain the full price for the first year or two. It is important to keep that level of distribution because once the discounters enter the market the price will drop. If that happens a majority of the initial resellers either cannot or will not sell the product. Additionally, the discounters do not want a product that either is not well recognized or is priced higher than they feel their customers will pay.
Catalogers may have several other requirements besides the lowest wholesale cost. They sometimes request a product placement fee and/or an exclusive. The exclusive can only be done within the first partial year, and only if a large enough order is received. A product placement fee will depend on the following:
- Size of the order
- Amount of the fee
- The success of other similarly priced products
- Time of year
- Size of the picture
- Location within the catalog
- Final negotiated price
- The number of insertions into additional issues
Locating Resellers
The simplest way to access the numerous resellers are through CD-ROM databases like Marketplace Business or American Business. Specific business types can be located with an 8-digit classification called Standard Industrial Classification, which is commonly known as the SIC code. Telemarketers can contact the best qualified companies by overlaying specific classifications over Scan/US, a database mapping program that contains multiple income levels and census statistics for the area.
Catalogers can be cross-referenced with the same systems if they maintain retail locations. Additionally, the company is more concerned with the quality of the catalogs and products in them.
ADDITIONAL MARKETS
The wall unit is ideally suited for commercial applications such as the following:
- Point-of-purchase displays in retail locations
- Promotional information pieces in hotels
- Product promotions at trade shows
- Sales promotions at seminars or special events
This product will probably have to be modified and reinforced to withstand the constant use for these applications.
The patentable technology can be used to reconfigure either unit for the children's market, ages four to ten. Each frame will act as a separate stage setting where characters and scenery from cut-out books can be displayed. This combination of pictures and words are set as scenes within a play. Kids can use their imagination to tell an unlimited number of stories.
The singles and related industries are also ideally suited for this product. Individuals can present themselves in pictures while voicing their description.
The premium markets range from photographic and film companies promoting photo development to pharmaceutical manufacturers demonstrating new drugs to doctors. Kodak has recently entered the consumer field and has an Imagining Division designed for developing new products. Motion picture companies are always looking for new ways to promote their latest entry. Either of the units can be customized by placing company logos in key locations on the frame.
SALES PLAN AND COMMISSIONS
The company will use manufacturers representatives and will hire specialized sales people called "in-house" sales reps. The "in-house" reps will be divided between "outside" and "inside" sales.
The average commission will be 15% of sales based upon paid invoices by the resellers. The commissions will range from 10% for quantity and catalog orders to 15% and 20% for small orders. The Consumer Electronic representatives usually receive 10% while the Gift representatives range from 15 to 20%. This also depends on services and trade shows where the products are displayed. The income statements use 15% as an average. Direct expenses will be reimbursed, especially for "in-house" reps. The reps must fill out their itinerary, the amount spent, the results and the reasons.
Telemarketers can be employed as either lead generators or closers. As lead generators they will receive a small portion of the sales rep commission, usually 20% of it. The sales refer to wholesale and/or direct sale retail. In response to growing direct sales or problems that arise a verifier can be used for spot verifications. The company's outside and inside sales reps and telemarketers will receive a starting salary against commissions for 60 days and then straight commissions. The management team, in addition to their salary, will receive a yearly bonus based upon gross profit, starting with the first full year.
THE INDUSTRY
Picture Frame Market
The photo picture frame industry is a booming industry in a niche marketplace. Major manufacturers are reporting profits in a down economy. The price, an increase in amateur photography, and an upgrade in design contributed to the photo and picture frame industry's 4.6 percent growth from 1991 to 1992, industry sources said. These factors, along with mass merchants' increasing control of overall market share, helped lift wholesale dollar volume to $730.8 million in 1992, and will assure growth of 1993 sales, vendors said.
Summary of report: Photo frame vendors have unveiled a diverse assortment of products this spring. From trendy theme offerings to the juvenile market to sophisticated woods, manufacturers have managed to present fresh collections of frames and albums for summer and fall delivery.
Talking Picture Frames
Talking picture frames have been available for several years. Almost all the focus has been on digital and solid state technology. Sharper Image sold a ten-second version in their June 1993 catalog at $39.95. The starting prices for wallet-size digital picture frames are $19.95 with a ten-second recorded message.
Hallmark Cards recently marketed a line of greeting cards at $ 14.00 that allows a person to record and playback a ten-second message with each card. Hallmark claims that the four batteries can be replaced without loss of memory. A backup system stays active for a limited period for battery replacement probably by keeping a capacitor charged. As the batteries drain from constant use, the effect of this method is extremely questionable.
Kodak is testing a true non-volatile (no loss of memory) photo card as a joint venture with Information Storage Devices (ISD). ISD sells non-volatile 14-second chip at $3.00. Their 90-second non-volatile chip is selling for $ 10.00 and they expect the introduce a 300-second non-volatile chip for $25.00 by the middle of 1995.
Several Taiwan companies have recently introduced a four-picture frame unit wholesaling from $29.00 to $32.00 FOB, with a suggested retail of $99.00. The disadvantages are that this product has no way of distinguishing which picture is talking and the volatile memory chip will eventually lose its memory. A new volatile chip was recently introduced by a Taiwan company with a 600-second recording time for $2.00. All prices are for quantity orders in the millions over several years.
Regardless of the chip used, it still has to be integrated through hardware and software with a microphone and a speaker, plus an on/off, a play/record, and a start/stop button. This integration can probably be configured for $3.00 per unit plus the initial R & D. Therefore, an eight-photo frame using eight non-volatile chips and the same set of buttons would cost $27.00 plus the costs of the individual frame holders and some form of photo recognition such as lights. This would probably drive the manufactured price above $32.00. The chips with longer recording time do not appear to have any price advantage. They also have to be integrated with a "location access" feature for the recorded messages. Volatile chips are really not suitable for this application even with battery backup, unless the company wants to explain to grandmothers, parents, and lovers why those precious voice recordings were suddenly lost after several years.
Based upon the five to one formula of retail sales to manufactured cost, the cost of using solid state non-volatile technology is still too expensive for home use. However, it would probably work in business applications such as point-of-purchase displays.
MARKET SIZE AND LONGEVITY
The company's product line appears to be in a niche market by bridging the easy viewing of separate photos with the full viewing of multiple sound pictures on a VCR recording. This hybrid market is almost unlimited as indicated by the fact that the standard photo frame market is rapidly expanding, along with the video camera market.
Summary of report: Picture frames had double-digit growth for almost ten years, and as the economy recovers, picture frames are expected to be even stronger sellers, according to Bill Johnson of Intercraft Industries. The frame market is dominated by discount stores, which account for 24% of all sales, while drug stores account for 15%. Of frames sold, 2% are through supermarkets, with the rest sold through photography dealers, card and gift stores, variety stores, and arts and craft's shops. According to Popular Photography's "The Wolfman Report," 66% of shoppers buy more than one frame at a time and 33% of consumers buy frames as gifts. Frame suppliers say that it is essential to position the products near a main aisle in the front of the store. The move toward fashion frames is also focused.
The talking photo business is in its infancy. This was demonstrated by a recent sale on QVC of several thousand single-photo talking frames that sold at $39.95 in less than 10 minutes. As the variations increase the market will expand. Basic single photo frames start under $ 10.00 and a number of decorator frames are priced over $50.00.
The bridging of sound with photos will change the way people look at and remember those special pictures. It will also expand the concept of perceived value for a photo frame, especially one with talking multiple photos.
Retailers' Preference
Retailers prefer companies with two or more products in different price points, especially if they start under $49.95. This price point appeals to a larger customer base than those over $49.95. The $79.95 wall unit fits that slightly higher marketplace of people who prefer a product with more aesthetic value.
It is just as easy for these retailers to enter a new company in their computers with one SKU as it is with two or more SKUs. Additionally, the retailers have the benefits of stock balancing and market testing.
Retailers feel that people could easily use multiples of this product either for special events like weddings, family celebrations, or vacations. Desktop and wall units expand the consumer line dramatically. The longevity of this product should greatly exceed the norm for new products, which is usually three to five years.
PROTECTION OF PRODUCTS
Both products are made using standard tape recorders and a patentable drive and display mechanism. This low-tech method is much less expensive than the high-tech solid state format. In addition, the patent should slow or prevent other companies from entering the field from this direction.
A utility patent will be applied when all the engineering drawings are completed. A patent search has shown that no competitive product using the same or even similar technology currently exists. The patent laws provide a 12-month "window of protection" for well documented products. The final patent should protect the products since these laws have become greatly strengthened over the years. The patents will remain with Larry Koenig but will be fully assigned to the corporation. The investors can secure their investments with the rights to the patents. This will remain in effect until the investors have received a reasonable return on their investment.
MANUFACTURING
Both products will probably have to be manufactured overseas to save on tooling, molding, and assembly. The company has contacted a manufacturer who lives in the U.S. but has a factory in Indonesia, where the daily labor costs are less than the hourly labor costs in the United States. China is another potential place for manufacturing. China would like to gain larger inroads in the U.S. as compared with Taiwan, Hong Kong, or Korea. Mexico is also a distinct possibility.
The advantage of manufacturing in these countries is price. The disadvantage is the lack of control, potential for mistakes, and problems with shipping.
The company would prefer to locate a manufacturer in this country if the final cost of production is within 5% of the offshore counterpart. Mr. Tarlow has used manufacturers in Utah and Arizona where the labor costs are less.
The completed engineering drawings will be sent out to bid when they are finished. Based on Mr. Tarlow's 20 years of experience, the final costs should not exceed $15.00 for the wall unit and $9.00 for the desktop version. He also believes the tooling and molding for the wall unit should not exceed $85,000 offshore or $125,000 in the United States. The desktop unit should be less than one-half of the wall unit based upon its size.
The actual tooling and molding will be probably take eight weeks, once all agreements are completed. Production will take 30 days and shipping by boat will also take 30 days.
Prior to production the preproduction units can be shipped by air for evaluation, corrections, initial sales through wholesale channels, brochure pictures, and short-form infomercial production.
For several select retailers and catalogers initial shipments can be shipped by air. Usually these companies want only a few hundred for testing. The reorders can be fulfilled from the main shipment arriving by boat.
If the product is very successful the company may experience a problem of short supply. Short supply has the following advantages:
- The creation of an over demand
- Elimination on overstocking
- Elimination of stock balancing
- Prompt payment of bills
History has shown where companies with successful products became even more successful when they kept their products scarce. The classic case is Nintendo. Successful products, where the supply eventually caught up with and passed the demand, demonstrate how these products quickly fell from desire. The best examples are The Rubik Cube, Trivial Pursuit, and the original hand-held electronic games. The theory of short supply is not the company's intention but it feels that if handled correctly it could be a decided advantage.
COMPETITION
The competition will come from photo picture frame manufacturers who produce singular or multiple picture frames and consumer electronic manufacturers who want to enter the talking picture frame field.
The company feels that most if not all of these competitors will attack the marketplace using solid state technology. Currently, as was explained earlier, that form of technology does not appear to poise a threat until the prices drop.
Companies like Kodak would probably prefer a joint venture or licensing agreement with Talking Photo Technology rather than producing a similar product, as indicated through conversation with the division involved with photo frames.
RESELLERS
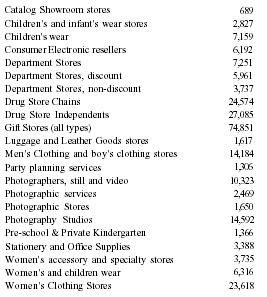
The following is a list of potential resellers compiled from Dun & Bradstreet and Hayes Druggist Guide:
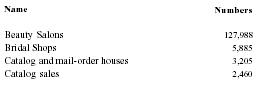
| Name | Numbers |
| Beauty Salons | 127,988 |
| Bridal Shops | 5,885 |
| Catalog and mail-order houses | 3,205 |
| Catalog sales | 2,460 |
| Catalog Showroom stores | 689 |
| Children's and infant's wear stores | 2,827 |
| Children's wear | 7,159 |
| Consumer Electronic resellers | 6,192 |
| Department Stores | 7,251 |
| Department Stores, discount | 5,961 |
| Department Stores, non-discount | 3,737 |
| Drug Store Chains | 24,574 |
| Drug Store Independents | 27,085 |
| Gift Stores (all types) | 74,851 |
| Luggage and Leather Goods stores | 1,617 |
| Men's Clothing and boy's clothing stores | 14,184 |
| Party planning services | 1,306 |
| Photographers, still and video | 10,323 |
| Photographic services | 2,469 |
| Photographic Stores | 1,650 |
| Photography Studios | 14,592 |
| Pre-school & Private Kindergarten | 1,366 |
| Stationery and Office Supplies | 3,388 |
| Women's accessory and specialty stores | 3,735 |
| Women's and children wear | 6,316 |
| Women's Clothing Stores | 23,618 |
For clarity purposes and to remove overlapping SIC codes, certain categories have been combined. The numbers represent the number of businesses (except for drug stores) not locations. These numbers serve to illustrate the number of potential resellers.
END USERS
The following is a partial list of the type of consumers who would be targeted initially:
- Parents with children
- Grandparents
- Newlyweds
- Single mothers
- Single women (21 to 39)
- Teenage girls (13 to 18)
Based upon a demographic and statistical analysis of the U.S. supplied by Scan/US, there are 32.8 million households with children. The highest concentrations are the northeastern section of the U.S. The second heaviest concentrations are in the southeast, California and Texas, followed by the South and the Midwest. The highest income levels are in California, New York, and Pennsylvania.
PRICING
Price is based upon three factors. The first is perceived value or what the market will bear. The second is the manufacturing cost. The last is the desired profit structure of the company balanced against what the resellers need.
The final price is usually five times the final production cost including boxing and landing charges in the U.S. There is some room since most of today's retailers work on margins of 30 to 40% for smaller and 50% for larger quantities. Catalogers usually work on 50%. Sales rep's commissions range from 10% in the consumer electronic field to 15 to 20% for the gift industry. A stocking distributor usually buys the product for 50% and an additional 10% off the retail. A master distributor's discount is negotiable but could be an extra 10 to 20% off the retail.
Each level of discount requires a larger initial and continued commitment from that particular buyer. The company feels that $79.95 for the wall unit and $49.95 for the desktop is reasonable, based upon the cost to manufacture, box, and ship. We may find by doing final test evaluations through direct sales and short-form infomercial that the market may accept a higher retail than what we indicated. The final suggested retail price will be the one determined during test with preproduction units. Test marketing and focus groups can be used but they do not always convey what people will actually spend. The wall unit could be retailed at $69.95 and the desktop at $39.95, without any significant loss in revenue.
INCENTIVES
Resellers
Incentives for advertising and promotion range from a cash discount to free goods included within the order. These incentives are usually designed for the major customers and catalogers. They are based upon either larger orders or proof of performance such as print advertisements or catalog inserts. Three to five percent is acceptable but each deal may have to be negotiated separately provided the company stays within the legality of the law.
Some companies also want exclusives for a period of time. Considering the size of the order, the particular marketplace and the length of the exclusive and the starting time, this is possible.
In addition, certain retailers will only place orders on a "guaranteed sales" basis where units not sold can be returned for cash refunds. Talking Photo Technology feels that by having two products "stock balancing" will be an alternative. For the important retailers who insist on this mode, Talking Photo Technology will require a minimum test purchase with a larger non-returnable backup purchase order, if the test is successful.
The company will produce its own point-of-purchase (POP) display to aid in the selling of the products to consumers. These POP displays will be sold to the retailers and offset with free goods. The POP is a modified unit, designed for continuous AC operation.
Consumer
Direct sales and short form TV infomercials will also help to drive the retail sales. Additionally, the company will investigate the use of cross promotion incentives with photo companies for film discounts, and photo developers for processing discounts.
A direct sales promotion targeted to grandparents, new parents, and newly weds can be accomplished by mail and telemarketing. The campaign can include photo discounts with the product purchase, discounts off the second units of equal or lesser value, and a joint venture promotion with a particular retail chain or group of catalogs.
KEY PERSONNEL
The key personnel are the members of the management team. Securing additional management personnel who can help advance the company along each level should not be difficult with the current state of the economy. Many qualified people are either looking for work or working in low paying positions.
As the company advances beyond the start-up phase it will need a Chief Financial Officer. Larry Koenig has worn many hats in the past and in the initial stages is fully capable of handling or assisting in many areas for a portion of the first year or longer if necessary.
STANDARD PERSONNEL
The company will contract out many of the services during the initial year or two, including direct sales, fulfillment, and telemarketing.
As the company grows and the product line increases it may be more beneficial to bring these various services within one facility. The following is a partial list of prospective employees and department types, the numbers, and the estimated monthly salaries that could be brought in at various stages:
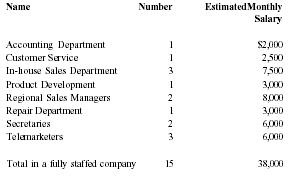
| Name | Number | Estimated Monthly Salary |
| Accounting Department | 1 | $2,000 |
| Customer Service | 1 | 2,500 |
| In-house Sales Department | 3 | 7,500 |
| Product Development | 1 | 3,000 |
| Regional Sales Managers | 2 | 8,000 |
| Repair Department | 1 | 3,000 |
| Secretaries | 2 | 6,000 |
| Telemarketers | 3 | 6,000 |
| Total in a fully staffed company | 15 | 38,000 |
LOCATION OF FACILITY
The company would prefer not to store or ship the majority of the product. It would be cheaper to let the manufacturer ship FOB to our larger customers. Talking Photo Technology prefers to conserve capital by starting in smaller or shared quarters. Products would be sent directly to our contracted fulfillment center except for a smaller quantity that can be stored in a local warehouse. For the next stage of the company's growth it can relocate to a larger facility where it can do local shipping, set up an accounting department, and handle returns. Additional departments can be added with each stage of growth.
QUALITY CONTROL
The company intends to set up a series of controls starting by using only manufacturers with proven performances. Dealing directly with the owner of the manufacturing facility and not going through an agent is a advantage. The initial preproduction run should expose most problems.
The company will institute a series of quality control check points at various stages of production, shipping, and receiving, and not depend on the manufacturers' guarantee. The cost of verification and spot checking will be more intensive in the early stages of growth. This is important because resellers will not give the company a second chance if they receive a large number of defective products.
The company will source a second manufacturer in case the first one is unable to maintain production or for reasons beyond his control he can not produce. In theory, the two products can be manufactured by two manufacturers. Once the tooling is paid for, and becomes the property of Talking Photo Technology it can be relocated to another facility. This would be difficult but not impossible.
INSURANCE
Besides standard insurance, our intention is to bond key manufacturers against production problems, at least on the onset, if possible. The company will pay for business interruption insurance, where feasible. Key personnel will have special insurance. Product liability should not be a problem since everything is battery operated. Since we are not doing manufacturing we don't expect labor or union problems.
ADDITIONAL PRODUCTS
"PortraiTalk" and "SoundPhoto" are the first in a series of high-profile products that the company will produce. Multiple versions of the wall unit can be produced so they can be interconnected. Volatile digital technology is probably best suited for the premium, point-of-purchase and area where memory loss is not essential. The non-volatile chips should be in the usable price range in 18 to 24 months.
Price versus performance is always the key factor. Incorporating digital technology with long term memory on a magnetic media at an affordable price would be ideal. If made small enough, these pieces can be retrofitted to existing photo albums or attached to store shelves as a sales tool.
Another area of exploration is the health industry. Some elderly people take a number of different prescriptions. In cases where a patient may become confused as to which prescription they took, their next dose, and when they should get the medication refilled, a voice memory product with a possible picture of the particular medication can inform the patients on the status of their drug intake.
The multiple talking photo concept can be used with coffee mugs, daily notepads, and phone dialers.
Any product or idea that appears to have potential will be test marketed before and after prototyping. Only then will the company invest time or money into the concept. Product potential will be rated on the following 12 areas:
- Exciting patentable feature
- Fills a real need
- Easily manufacturable
- Aesthetically appealing
- Simple to operate
- Psychologically fulfilling
- Simple to understand
- No new parts to reinvent
- Center of attraction in retail environments
- No safety problems
- Great price to value ratio
- Excellent gift idea
BREAK EVEN ANALYSIS
The sales of the company are driven by advertising, marketing, promotion, and time of year. Breaking even in December is not the same as breaking even in March. Additionally, direct sales produce a higher gross profit than wholesale sales. Therefore, by comparing the income statements of 1995 and 1996 of slow months versus better months, it is safe to assume that a break-even position will not occur until the last quarter of 1995. This assumes that the products were sold at the ratio of two desktop units to one wall unit and that the majority of orders would come through the wholesale route.
Based upon the estimate of the first year the company feels that 15,000 total units would be required as an initial inventory consisting of 10,000 desktop and 5,000 wall units. This initial revolving inventory should prevent any normal out-of-stock situation from occurring in the start up year, especially since merchandise could take 60 to 90 days from purchase order to actual receipt.
The company can use purchase order financing and factoring as a means of handling cash flow problems for its second Christmas.
USE OF FUNDS
The following is a list of how the funds will be used and allocated to reach a positive cash flow:
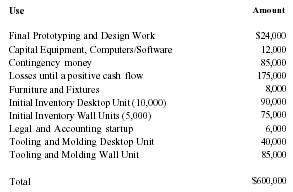
| Use | Amount |
| Final Prototyping and Design Work | $24,000 |
| Capital Equipment, Computers/Software | 12,000 |
| Contingency money | 85,000 |
| Losses until a positive cash flow | 175,000 |
| Furniture and Fixtures | 8,000 |
| Initial Inventory Desktop Unit (10,000) | 90,000 |
| Initial Inventory Wall Units (5,000) | 75,000 |
| Legal and Accounting startup | 6,000 |
| Tooling and Molding Desktop Unit | 40,000 |
| Tooling and Molding Wall Unit | 85,000 |
| Total | $600,000 |
ECONOMIC FORECAST
The Economy in 1993
A brief review of economic developments in 1993 provides a helpful introduction to the projections of 1994. As of late October 1993, it appeared that growth in 1993 would be somewhat less than was projected in Outlook '93, not only in the United States, but also in the rest of the industrial world generally. Following strong growth in the United States during late 1992 (some of which stemmed from reconstruction associated with hurricane damages earlier in the year) the nation's economic activity slowed considerably during the first half of 1993. The annual rate of growth in real gross domestic product (GDP) fell below 1 percent in the first quarter, partly reflecting a record decline in defense spending and disruptions caused by a severe storm along the Eastern seaboard. Growth then rose to an annual rate of approximately 2 percent in the second quarter, and was expected to average approximately 3 percent during the second half of 1993.
Economic Outlook for 1994
Commerce Department analysts developed their industry projections for 1994 against the background of expected overall growth of close to 3 percent-the Blue Chip consensus as of July 1993. In September, forecasts of real GDP growth for 1994 over 1993 remained in that range: the International Monetary Fund (IMF) projected a 2.6 percent growth for the United States; the Blue Chip consensus was shaded to 2.7 percent (the same as that of the Congressional Budget Office); and the Administration's mid-session forecast called for a 3 percent increase. As the analysis below suggests, the economy is likely to expand moderately-in the range of 2.5 to 3 percent-in 1994. On the policy side, the Budget Act of 1993 is expected to restrain growth modestly in 1994. The estimated deficit reduction is about $47 billion or 0.7 percent of projected current-dollar GDP. However, the deficit-reduction program has contributed to a decrease in long-term interest rates to their lowest levels in many years. The stimulus provided by these low rates will tend to offset the fiscal restraint. Several other factors may continue to contain growth in the United States. These include the following:
- Further corporate restructuring, limiting growth in employment and wages (related to this are uncertainties about the costs to businesses associated with the proposed health care reform package)
- Continued weakness in the commercial real estate market, which was heavily overbuilt during the 1980s
- Continued cutbacks in defense purchases, possibly on an accelerated basis, and limitations on spending by governments at all levels due to budget constraints
- Weaker-than-expected recoveries in the economies of some major U.S. trading partners, especially Japan and Western Europe
No single sector stands out as the principal engine of growth in 1994, though gross private domestic investment is projected to increase twice as fast as overall GDP (much less, however, than in 1993). In general, interest-sensitive components of spending are expected to provide much of the impetus to overall growth. Consumer purchases of durable goods, producers' durable equipment, and residential investment all are expected to show fairly good growth in 1994. State and local government expenditures, also interest-sensitive to some extent, grow much faster in 1994 after a modest gain in 1993.
Total personal consumption expenditures are projected to increase a little faster than disposable personal income. Sales of new cars and light trucks, which are reflected in both consumer durables and producers' equipment, are expected to rise approximately 6 percent in 1994. Vehicles built in North America (considered to be domestically produced) account for all of the gain. The sharp decline in the value of the dollar against the yen during 1993 increased prices of imported Japanese models relative to prices of domestic U.S. cars, while consumers began to perceive quality improvements in U.S. models. This development is expected to reduce further exports of Japanese motor vehicles to the United States in 1994.
On the investment side, another healthy gain expected for corporate profits in 1994 will help to sustain solid growth in private nonresidential fixed investment. The rate of increase in investment in producers' equipment will slow in 1994, while investment in nonresidential structures should undergo little change. Ongoing weakness in the construction of office buildings, hotels and motels, and other commercial structures should be largely offset by modest gains in construction of most other nonresidential structures. Housing is expected to post another moderate increase in 1994, primarily in the construction of single-family units and in remodeling. Growth in multi-family housing will remain modest, given the continuation of high vacancy rates in rental housing during 1993.
Exports of goods and services are expected to increase in line with overall GDP in 1994, weakening slightly from their growth in 1993. These developments stand in sharp contrast to the strong U.S. export performance from 1985 to 1992, when the dollar was declining and real exports of goods and services rose five times as fast as GDP. The dollar showed little change during 1993. Although it weakened considerably in relation to the yen, it appreciated against most European currencies.
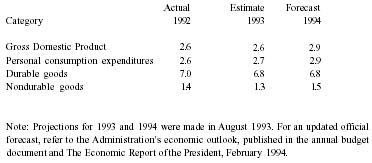
| Table 1: Gross Domestic Product 1992-1994 | |||
| Note: Projections for 1993 and 1994 were made in August 1993. For an updated official forecast, refer to the Administration's economic outlook, published in the annual budget document and The Economic Report of the President, February 1994. | |||
| Category | Actual 1992 | Estimate 1993 | Forecast 1994 |
| Gross Domestic Product | 2.6 | 2.6 | 2.9 |
| Personal consumption expenditures | 2.6 | 2.7 | 2.9 |
| Durable goods | 7.0 | 6.8 | 6.8 |
| Nondurable goods | 1.4 | 1.3 | 1.5 |
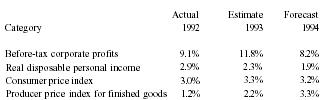
| Table 2: Key Economic Indicators 1992-1994 | |||
| Category | Actual 1992 | Estimate 1993 | Forecast 1994 |
| Before-tax corporate profits | 9.1% | 11.8% | 8.2% |
| Real disposable personal income | 2.9% | 2.3% | 1.9% |
| Consumer price index | 3.0% | 3.3% | 3.2% |
| Producer price index for finished goods | 1.2% | 2.2% | 3.3% |
FINANCIALS
The financials are structured in a calendar year format because of the influence that Christmas has upon yearly sales. The sales after the startup partial year should dramatically increase in the first full year. The second full year should increase by a minimum of three times the previous year. This is the year that the mass merchants, discounters, and large chains start to sell the product. By the end of the third year the sales should reach 15 times the original investment. The projected financials are for three years plus the initial startup year. These factors, along with the economy and technology, really prevent long range forecasts. The company also feels that the end of the third year would be an ideal time for either an IPO, investor buyout, merger, or sale to a larger company. Any of these avenues would present an exit for the investor.
CONTINGENCIES
Potential Problems
The company wants to get the products on the market quickly yet it is imperative that it keeps mistakes to a minimum. Though these products will sell better at Christmas they are also year-round items for weddings, special events, graduations, holiday vacations, Valentines Day, Mother's Day, and Father's Day. On some of these occasions multiples can be purchased. If the Christmas season is missed the break-even time will take longer but the company should not be seriously affected.
Copy-cat products will arrive on the scene usually 12 to 18 months after our product is launched provided it is successful. Some will even attempt to circumvent the patent laws, but most will use digital technology and some method of picture synchronization. A few may even foster a margin of success. Their major problem will be the retention of memory after the batteries wear out for the products using volatile memory or the higher cost of the products using non-volatile memory. The company intends to use solid state technology for point-of-purchase displays. This research should enable it to stay in the forefront of technology and switch over to solid state when feasible.
New Products
Traditionally, within 18 to 24 months the company should be ready to launch the next series of products and open up additional markets. These products should be more advanced versions of the original products, different but similar products for other markets (health industry), and modifications of the original for other markets (point-of-purchase display). New products should keep the company in the forefront.
The success and longevity of our current products will determine the amount of resources placed on any new products. It takes from six to twelve months to place a new product on the market. The company does not believe in the shot gun approach of new products. Marketing is too expensive; therefore an initial and a secondary evaluation must decide if a product is viable.
If the perceived value is not as apparent with the current models or the solid state technology advances faster than expected, then the company will have to incorporate digital technology into the product more rapidly than expected.
Alternative Marketing Concept
After 12 months, if the company feels is has not penetrated the market successfully using conventional methods of direct sales and wholesales then it could opt to go in the direction of multi-level marketing (MLM) or network marketing. It would have to bring in experienced people in that arena or merge with a current company. MLM companies require products with high appeal, easily sold on a one-to-one method, and a minimum of a 5 to 1 ratio. In addition, the company would produce a catalog of available high and low-tech products. This formula has been accomplished very successfully by a company called Quorum. Talking Photo Technology would need at least 10,000 but preferably 20,000 multi-level sales people called its downline.
The company would produce a standard size 64-page catalog with products ranging from it own line of proprietary products to other consumer electronics. It would also include the areas of computers and/or accessories, children's toys, health, beauty, kitchen, dietary and food items, plus recreational products. The catalog would have a minimum of 150 products besides its own. The only requirements are that the acquired selections must be shippable, and have a minimum of 50% margins (a $50.00 retail item would cost $25.00).
The main thrust of the catalog would be its line of proprietary products that it could produce or acquire from investors on a royalty basis. The downline people would receive a similar profit structure that would have been set up for resellers and commissioned sales people.
The cost for producing one million catalogs including product selection, copy writing, layout and design, photography, models, color separation, order form, printing, and binding is estimated at $400,000. The shipping of the catalog, based on 20,000 members with 50 catalogs per person, is approximately $0.19 each, which is paid for by the people. In addition, they would be charged a fee of $.0.75 per catalog, equating to a $350,000 net profit for your company.
The people would be allowed to buy a maximum of one of each of the products in the catalog at a 40% discount for their use. Regular orders would start with a profit structure of 20% to the seller followed by 5% for the next in line and ending at 1%. Let's take an example of a product with a wholesale of $50.00 and a retail of $c 100.00. Here is a possible way distribution could work with the individual profit margins.
| Seller | 1st in Line | 2nd in Line | 3rd in Line | 4th in Line | 5th in Line |
| $20.00 | $5.00 | $4.00 | $3.00 | $2.00 | $1.00 |
This leaves a gross profit of 15%, or in this example $15.00. The cost of order processing and fulfillment, by an outside company, should not exceed 5% or $5.00 in this example. There will some additional operating expenses (credit card processing) and/or overhead, estimated to be 3%, leaving a 7% or $7.00 per $100.00 per order.
Assuming the average retail sale is $100.00 and the number of unit sold per product is 200, then a catalog containing 150 products should gross $3,000,000. This would produce a net profit of $210,000 for the company per season.
These estimates and catalog pricing are based upon the Quorum catalog and their items selected and initial returns. The net profit could increase by three to four times that amount for Christmas, based upon conventional catalog sales. The main income for the multi-level people and the company would come from its proprietary product line. Successful MLM companies make millions. An original product company not in the health and beauty field could do exceptionally well.
Another source of revenue is a product placement fee which Larry Koenig accomplished very successfully in his previous catalogs, The Price of His Toys. Within several years the company should be able to receive $300,000 or equivalent from product placement.
A major source ofre venue that Sharper Image had ($1,000,000 per year) was from its list name rental.
The success of any catalog requires the correct product selection, good design, selling copy and a quality customer base. The company either has or can acquire people with that expertise.
It would take a minimum of six months to set up the MLM organization provided it did not have to start from the beginning. The major expense would be the catalog that should be prepaid by the downline people.
Product ordering is a little tricky and requires a certain amount of expertise in this area. If the company is not careful a portion of its profit can be sitting in some warehouse as inventory. There are ways of disposing of extra inventory with minimum risk, especially through its downline.
Within several years the company could be generating four to five million as net profit on the catalog and outside product alone. This method has been proven successful by Quorum and they just focus on consumer electronics. A multi-style catalog should out-perform a single style, especially since half the people in MLM are women who do not buy electronics.
THE DEAL
Desired Method
The company is seeking an investment of $600,000 and is offering 25% of its stock for this money. The investment can be made in several payments. The repayment options are explained under the EXIT section. The company plans to operate in Southern California but can be incorporated in any state. This will be done after the first round of capital is raised and all the investors are in place, thereby saving on legal fees.
ALTERNATIVE DEAL
Purchase Order Financing and Factoring
The following is a list of how the funds will be used and allocated to reach break even if the company uses purchase order financing (POF) and factoring:

| Use | Amount |
| Tooling and Molding Wall Unit – Balance from Profits | $60,000 |
| Tooling and Molding Desktop Unit – Balance from Profits | $30,000 |
| Losses prior to cash flow | 175,000 |
| Contingency money | 25,000 |
| First Payment Prototyping/Design Products balance over time | 5,000 |
| POF/Factoring on Wall Units (4,500) | 9,000 |
| POF/Factoring on Desktop Unit (8,500) | 11,000 |
| Total | 315,000 |
The company has arranged for purchase order financing and factoring. The manufacturer should cooperate, provided money is received from the purchase orders. This method is not the first choice but can be accomplished. The company would only be willing to offer 15% of its stock based upon this proposal. The other 10% would be needed for a second round of financing in case projected results are not achieved.
EXIT
The company would prefer to go public sometime after the third full year or sooner if the profits can attract a substantial IPO. this will depend on the economy, the public market, and the company's perceived potential.
The first alternative to a normal IPO would be a SCOR (Small Company Offering Registration) offering. This is a limited public offering done on at the State level for a registration fee of $2,500 in California (other states may be different). Attorneys charge $5,000 to $15,000. The company must sell its own stock initially. The state approval is somewhat difficult unless the company is profitable and has a two-year track record. The company can raise a maximum of $1,000,000 per year by selling its shares of stock at a fixed price of $5.00 per share. The company can not use any of this money to payoff investors unless the money came from a financial institution (bank) as a loan.
The company feels that the potential stock purchasers in this case would be resellers of its product line, end users, and other interested parties who feel that the company is a prudent investment. The company can solicit a market marker from a major investment house when it has a minimum number of stock holders (estimated to be 500 or more).
The SCOR idea would work exceptionally well with the MLM format described under Contingencies.
Based upon the above premise the investors could lend the money to the company through a bank secured by a CD. After two or three years the investors would receive their initial investment back, yet still retain an interest in the company.
The second alternative would entail a straight pay back over a period of years with a substantial return on investment.
The third alternative would consist of a merger or buyout with a larger company.
The rights to patents (assigned to the investors until their investment is recovered) should generate enough income on a royalty basis if they sold to another company.
ASSUMPTIONS
The retail price for the wall unit is $79.95 with an average wholesale price of $48.00 for retailers and $40.00 for catalogers. The retail price for the desktop unit is $49.95 with an average wholesale price of $30.00 for retailers and $25.00 for catalogers. The company assumes Christmas sales will be minimal for the initial year but direct sales could sustain it until the resellers come on board.
The company did not allocate funds for use of purchase order financing (POF) in the Income Statements. Factoring is used at the end of the first full year. POF can only be used for orders over $50,000 by a qualified buyer, which has been approved by a factor. This is an alternative method.
The company assumes sales of 13,000 units for the balance of the first year in all fields. This is very conservative as the company feels that if it had at least 50 preproduction models of each unit (before the end of the third quarter) it could set up a national marketing campaign throughout the country.
The company assumes total sales of just under 100,000 units for the first full year for both models, 200,000 for the second year and 360,000 for the third year. This is very conservative based upon the average market potential of 2,000,000 sales for a five-year period for a single good product.
The company feels that "SoundPhoto" (the desktop version) will outsell "PortraiTalk" (the wall model) by a ratio of 2 to 1, provided both units are available and shown. The company also feels that the sales of both will be higher when both are shown. As the products go into wider distribution, the percentages of consumer and trade advertising dollars will rise from less than 0.5% to over 1% in sales.
An extensive patent search was performed by Macro-Search on 2/9/94 to determine the feasibility of proceeding with a patent. No conflicting patents were shown. This does not guarantee that either a similar product was in the pending stage or a patent had expired. Due to the length of the patent search, it is not included in this plan.
Units Sales 1994
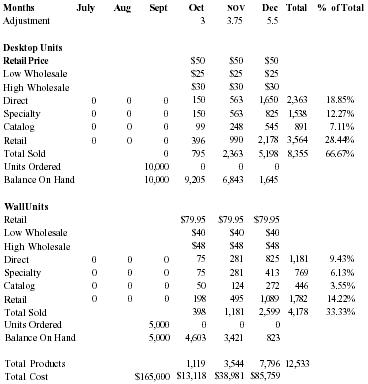
| Months | July | Aug | Sept | Oct | Nov | Dec | Total | % of Total |
| Adjustment | 3 | 3.75 | 5.5 | |||||
| Desktop Units | ||||||||
| Retail Price | $50 | $50 | $50 | |||||
| Low Wholesale | $25 | $25 | $25 | |||||
| High Wholesale | $30 | $30 | $30 | |||||
| Direct | 0 | 0 | 0 | 150 | 563 | 1,650 | 2,363 | 18.85% |
| Specialty | 0 | 0 | 0 | 150 | 563 | 825 | 1,538 | 12.27% |
| Catalog | 0 | 0 | 0 | 99 | 248 | 545 | 891 | 7.11% |
| Retail | 0 | 0 | 0 | 396 | 990 | 2,178 | 3,564 | 28.44% |
| Total Sold | 0 | 795 | 2,363 | 5,198 | 8,355 | 66.67% | ||
| Units Ordered | 10,000 | 0 | 0 | 0 | ||||
| Balance On Hand | 10,000 | 9,205 | 6,843 | 1,645 | ||||
| Wall Units | ||||||||
| Retail | $79.95 | $79.95 | $79.95 | |||||
| Low Wholesale | $40 | $40 | $40 | |||||
| High Wholesale | $48 | $48 | $48 | |||||
| Direct | 0 | 0 | 0 | 75 | 281 | 825 | 1,181 | 9.43% |
| Specialty | 0 | 0 | 0 | 75 | 281 | 413 | 769 | 6.13% |
| Catalog | 0 | 0 | 0 | 50 | 124 | 272 | 446 | 3.55% |
| Retail | 0 | 0 | 0 | 198 | 495 | 1,089 | 1,782 | 14.22% |
| Total Sold | 398 | 1,181 | 2,599 | 4,178 | 33.33% | |||
| Units Ordered | 5,000 | 0 | 0 | 0 | ||||
| Balance On Hand | 5,000 | 4,603 | 3,421 | 823 | ||||
| Total Products | 1,119 | 3,544 | 7,796 | 12,533 | ||||
| Total Cost | $165,000 | $13,118 | $38,981 | $85,759 |
Income 1994
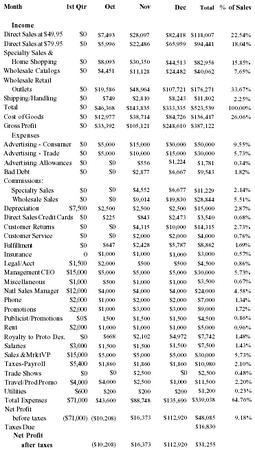
| Month | 1st Qtr | Oct | Nov | Dec | Total | % of Sales |
| Income | ||||||
| Direct Sales at $49.95 | $0 | $7,493 | $28,097 | $82,418 | $118,007 | 22.54% |
| Direct Sales at $79.95 | $0 | $5,996 | $22,486 | $65,959 | $94,441 | 18.04% |
| Specialty Sales & Home Shopping | $0 | $8,093 | $30,350 | $44,513 | $82,956 | 15.85% |
| Wholesale Catalogs | $0 | $4,451 | $11,128 | $24,482 | $40,062 | 7.65% |
| Wholesale Retail Outlets | $0 | $19,586 | $48,964 | $107,721 | $176,271 | 33.67% |
| Shipping/Handling | $0 | $749 | $2,810 | $8,243 | $11,802 | 2.25% |
| Total | $0 | $46,368 | $143,835 | $333,335 | $523,539 | 100.00% |
| Cost of Goods | $0 | $12,977 | $38,714 | $84,726 | $136,417 | 26.06% |
| Gross Profit | $0 | $33,392 | $105,121 | $248,610 | $387,122 | |
| Expenses | ||||||
| Advertising - Consumer | $0 | $5,000 | $15,000 | $30,000 | $50,000 | 9.55% |
| Advertising - Trade | $0 | $5,000 | $10,000 | $15,000 | $30,000 | 5.73% |
| Advertising Allowances | $0 | $0 | $556 | $1,224 | $1,781 | 0.34% |
| Bad Debt | $0 | $0 | $2,877 | $6,667 | $9,543 | 1.82% |
| Commissions: | ||||||
| Specialty Sales | $0 | $0 | $4,552 | $6,677 | $11,229 | 2.14% |
| Wholesale Sales | $0 | $0 | $9,014 | $19,830 | $28,844 | 5.51% |
| Depreciation | $7,500 | $2,500 | $2,500 | $2,500 | $15,000 | 2.87% |
| Direct Sales Credit Cards | $0 | $225 | $843 | $2,473 | $3,540 | 0.68% |
| Customer Returns | $0 | $0 | $4,315 | $10,000 | $14,315 | 2.73% |
| Customer Service | $0 | $0 | $2,000 | $2,000 | $4,000 | 0.76% |
| Fulfillment | $0 | $647 | $2,428 | $5,787 | $8,862 | 1.69% |
| Insurance | 0 | $1,000 | $1,000 | $1,000 | $3,000 | 0.57% |
| Legal/Acct | $1,500 | $2,000 | $500 | $500 | $4,500 | 0.86% |
| Management CEO | $15,000 | $5,000 | $5,000 | $5,000 | $30,000 | 5.73% |
| Miscellaneous | $1,000 | $500 | $1,000 | $1,000 | $3,500 | 0.67% |
| Natl Sales Manager | $12,000 | $4,000 | $4,000 | $4,000 | $24,000 | 4.58% |
| Phone | $2,000 | $1,000 | $2,000 | $2,000 | $7,000 | 1.34% |
| Promotions | $2,000 | $1,000 | $3,000 | $3,000 | $9,000 | 1.72% |
| Publicist/Promotions | $0$ | 1,500 | $1,500 | $1,500 | $4,500 | 0.86% |
| Rent | $2,000 | $1,000 | $1,000 | $1,000 | $5,000 | 0.96% |
| Royalty to Proto Des. | $0 | $668 | $2,102 | $4,972 | $7,742 | 1.48% |
| Salaries | $3,000 | $1,500 | $1,500 | $1,500 | $7,500 | 1.43% |
| Sales & Mrkt VP | $15,000 | $5,000 | $5,000 | $5,000 | $30,000 | 5.73% |
| Taxes - Payroll | $5,400 | $1,860 | $1,860 | $1,860 | $10,980 | 2.10% |
| Trade Shows | $0 | $0 | $2,500 | $0 | $2,500 | 0.48% |
| Travel/Prod Promo | $4,000 | $4,000 | $2,500 | $1,000 | $11,500 | 2.20% |
| Utilities | $600 | $200 | $200 | $200 | $1,200 | 0.23% |
| Total Expenses | $71,000 | $43,600 | $88,748 | $135,690 | $339,038 | 64.76% |
| Net Profit before taxes | ($71,000) | ($10,208) | $16,373 | $112,920 | $48,085 | 9.18% |
| Taxes Due | $16,830 | |||||
| Net Profit after taxes | ($10,208) | $16,373 | $112,920 | $31,255 | ||
Balance Sheet 1994
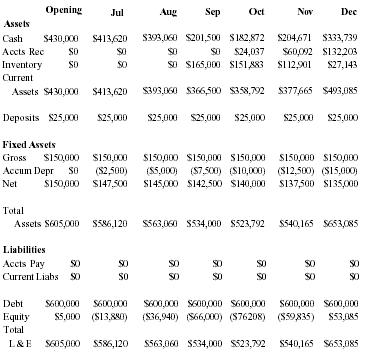
| Opening | Jul | Aug | Sep | Oct | Nov | Dec | |
| Assets | |||||||
| Cash | $430,000 | $413,620 | $393,060 | $201,500 | $182,872 | $204,671 | $333,739 |
| Accts Rec | $0 | $0 | $0 | $0 | $24,037 | $60,092 | $132,203 |
| Inventory | $0 | $0 | $0 | $165,000 | $151,883 | $112,901 | $27,143 |
| Current Assets | $430,000 | $413,620 | $393,060 | $366,500 | $358,792 | $377,665 | $493,085 |
| Deposits | $25,000 | $25,000 | $25,000 | $25,000 | $25,000 | $25,000 | $25,000 |
| Fixed Assets | |||||||
| Gross | $150,000 | $150,000 | $150,000 | $150,000 | $150,000 | $150,000 | $150,000 |
| Accum Depr | $0 | ($2,500) | ($5,000) | ($7,500) | ($10,000) | ($12,500) | ($15,000) |
| Net | $150,000 | $147,500 | $145,000 | $142,500 | $140,000 | $137,500 | $135,000 |
| Total Assets | $605,000 | $586,120 | $563,060 | $534,000 | $523,792 | $540,165 | $653,085 |
| Liabilities | |||||||
| Accts Pay | $0 | $0 | $0 | $0 | $0 | $0 | $0 |
| Current Liabs | $0 | $0 | $0 | $0 | $0 | $0 | $0 |
| Debt | $600,000 | $600,000 | $600,000 | $600,000 | $600,000 | $600,000 | $600,000 |
| Equity | $5,000 | ($13,880) | ($36,940) | ($66,000) | ($76,208) | ($59,835) | $53,085 |
| Total L & E | $605,000 | $586,120 | $563,060 | $534,000 | $523,792 | $540,165 | $653,085 |
Cash Flow 1994
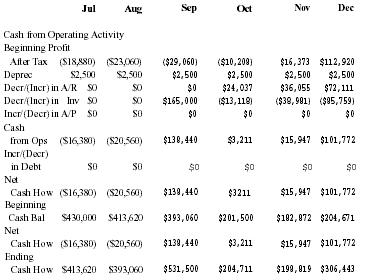
| Jul | Aug | Sep | Oct | Nov | Dec | |
| Cash from Operating Activity | ||||||
| Beginning Profit After Tax | ($18,880) | ($23,060) | ($29,060) | ($10,208) | $16,373 | $112,920 |
| Deprec | $2,500 | $2,500 | $2,500 | $2,500 | $2,500 | $2,500 |
| Decr/(Incr) in A/R | $0 | $0 | $0 | $24,037 | $36,055 | $72,111 |
| Decr/(lncr) in Inv | $0 | $0 | $165,000 | ($13,118) | ($38,981) | ($85,759) |
| Incr/(Decr) in A/P | $0 | $0 | $0 | $0 | $0 | $0 |
| Cash from Ops | ($16,380) | ($20,560) | $138,440 | $3,211 | $15,947 | $101,772 |
| Incr/(Decr) in Debt | $0 | $0 | $0 | $0 | $0 | $0 |
| Net Cash How | ($16,380) | ($20,560) | $138,440 | $3,211 | $15,947 | $101,772 |
| Beginning Cash Bal | $430,000 | $413,620 | $393,060 | $201,500 | $182,872 | $204,671 |
| Net Cash How | ($16,380) | ($20,560) | $138,440 | $3,211 | $15,947 | $101,772 |
| Ending Cash How | $413,620 | $393,060 | $531,500 | $204,711 | $198,819 | $306,443 |
Units Sales 1995
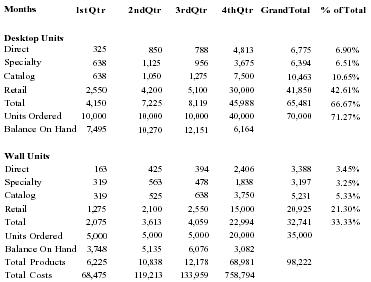
| Months | lst Qtr | 2nd Qtr | 3rd Qtr | 4th Qtr | Grand Total | % of Total |
| Desktop Units | ||||||
| Direct | 325 | 850 | 788 | 4,813 | 6,775 | 6.90% |
| Specialty | 638 | 1,125 | 956 | 3,675 | 6,394 | 6.51% |
| Catalog | 638 | 1,050 | 1,275 | 7,500 | 10,463 | 10.65% |
| Retail | 2,550 | 4,200 | 5,100 | 30,000 | 41,850 | 42.61% |
| Total | 4,150 | 7,225 | 8,119 | 45,988 | 65,481 | 66.67% |
| Units Ordered | 10,000 | 10,000 | 10,000 | 40,000 | 70,000 | 71.27% |
| Balance On Hand | 7,495 | 10,270 | 12,151 | 6,164 | ||
| Wall Units | ||||||
| Direct | 163 | 425 | 394 | 2,406 | 3,388 | 3.45% |
| Specialty | 319 | 563 | 478 | 1,838 | 3,197 | 3.25% |
| Catalog | 319 | 525 | 638 | 3,750 | 5,231 | 5.33% |
| Retail | 1,275 | 2,100 | 2,550 | 15,000 | 20,925 | 21.30% |
| Total | 2,075 | 3,613 | 4,059 | 22,994 | 32,741 | 33.33% |
| Units Ordered | 5,000 | 5,000 | 5,000 | 20,000 | 35,000 | |
| Balance On Hand | 3,748 | 5,135 | 6,076 | 3,082 | ||
| Total Products | 6,225 | 10,838 | 12,178 | 68,981 | 98,222 | |
| Total Costs | 68,475 | 119,213 | 133,959 | 758,794 | ||
Income 1995
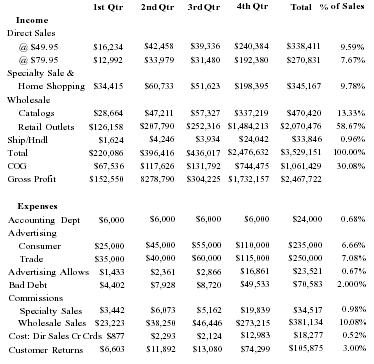
| 1st Qtr | 2nd Qtr | 3rd Qtr | 4th Qtr | Total | % of Sales | |
| Income | ||||||
| Direct Sales | ||||||
| @ $49.95 | $16,234 | $42,458 | $39,336 | $240,384 | $338,411 | 9.59% |
| @ $79.95 | $12,992 | $33,979 | $31,480 | $192,380 | $270,831 | 7.67% |
| Specialty Sale & Home Shopping | $34,415 | $60,733 | $51,623 | $198,395 | $345,167 | 9.78% |
| Wholesale | ||||||
| Catalogs | $28,664 | $47,211 | $57,327 | $337,219 | $470,420 | 13.33% |
| Retail Outlets | $126,158 | $207,790 | $252,316 | $1,484,213 | $2,070,476 | 58.67% |
| Ship/Hndl | $1,624 | $4,246 | $3,934 | $24,042 | $33,846 | 0.96% |
| Total | $220,086 | $396,416 | $436,017 | $2,476,632 | $3,529,151 | 100.00% |
| COG | $67,536 | $117,626 | $131,792 | $744,475 | $1,061,429 | 30.08% |
| Gross Profit | $152,550 | $278,790 | $304,225 | $1,732,157 | $2,467,722 | |
| Expenses | ||||||
| Accounting Dept | $6,000 | $6,000 | $6,000 | $6,000 | $24,000 | 0.68% |
| Advertising | ||||||
| Consumer | $25,000 | $45,000 | $55,000 | $110,000 | $235,000 | 6.66% |
| Trade | $35,000 | $40,000 | $60,000 | $115,000 | $250,000 | 7.08% |
| Advertising Allows | $1,433 | $2,361 | $2,866 | $16,861 | $23,521 | 0.67% |
| Bad Debt | $4,402 | $7,928 | $8,720 | $49,533 | $70,583 | 2.000% |
| Commissions | ||||||
| Specialty Sales | $3,442 | $6,073 | $5,162 | $19,839 | $34,517 | 0.98% |
| Wholesale Sales | $23,223 | $38,250 | $46,446 | $273,215 | $381,134 | 10.08% |
| Cost: Dir Sales Cr Crds | $877 | $2,293 | $2,124 | $12,983 | $18,277 | 0.52% |
| Customer Returns | $6,603 | $11,892 | $13,080 | $74,299 | $105,875 | 3.00% |
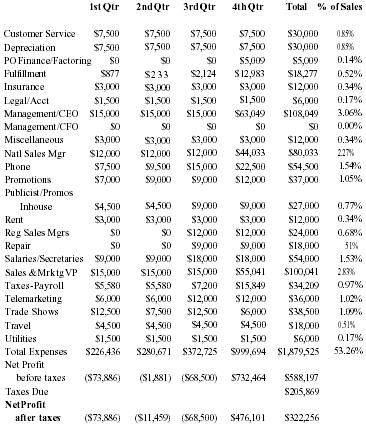
| 1st Qtr | 2nd Qtr | 3rd Qtr | 4th Qtr | Total | % of Sales | |
| Customer Service | $7,500 | $7,500 | $7,500 | $7,500 | $30,000 | 0.85% |
| Depreciation | $7,500 | $7,500 | $7,500 | $7,500 | $30,000 | 0.85% |
| PO Finance/Factoring | $0 | $0 | $0 | $5,009 | $5,009 | 0.14% |
| Fulfillment | $877 | $233 | $2,124 | $12,983 | $18,277 | 0.52% |
| Insurance | $3,000 | $3,000 | $3,000 | $3,000 | $12,000 | 0.34% |
| Legal/Acct | $1,500 | $1,500 | $1,500 | $1,500 | $6,000 | 0.17% |
| Management/CEO | $15,000 | $15,000 | $15,000 | $63,049 | $108,049 | 3.06% |
| Management/CFO | $0 | $0 | $0 | $0 | $0 | 0.00% |
| Miscellaneous | $3,000 | $3,000 | $3,000 | $3,000 | $12,000 | 0.34% |
| Natl Sales Mgr | $12,000 | $12,000 | $12,000 | $44,033 | $80,033 | 2.27% |
| Phone | $7,500 | $9,500 | $15,000 | $22,500 | $54,500 | 1.54% |
| Promotions | $7,000 | $9,000 | $9,000 | $12,000 | $37,000 | 1.05% |
| Publicist/Promos Inhouse | $4,500 | $4,500 | $9,000 | $9,000 | $27,000 | 0.77% |
| Rent | $3,000 | $3,000 | $3,000 | $3,000 | $12,000 | 0.34% |
| Reg Sales Mgrs | $0 | $0 | $12,000 | $12,000 | $24,000 | 0.68% |
| Repair | $0 | $0 | $9,000 | $9,000 | $18,000 | 51% |
| Salaries/Secretaries | $9,000 | $9,000 | $18,000 | $18,000 | $54,000 | 1.53% |
| Sales & Mrktg VP | $15,000 | $15,000 | $15,000 | $55,041 | $100,041 | 2.83% |
| Taxes-Payroll | $5,580 | $5,580 | $7,200 | $15,849 | $34,209 | 0.97% |
| Telemarketing | $6,000 | $6,000 | $12,000 | $12,000 | $36,000 | 1.02% |
| Trade Shows | $12,500 | $7,500 | $12,500 | $6,000 | $38,500 | 1.09% |
| Travel | $4,500 | $4,500 | $4,500 | $4,500 | $18,000 | 0.51% |
| Utilities | $1,500 | $1,500 | $1,500 | $1,500 | $6,000 | 0.17% |
| Total Expenses | $226,436 | $280,671 | $372,725 | $999,694 | $1,879,525 | 53.26% |
| Net Profit before taxes | ($73,886) | ($1,881) | ($68,500) | $732,464 | $588,197 | |
| Taxes Due | $205,869 | |||||
| Net Profit after taxes | ($73,886) | ($11,459) | ($68,500) | $476,101 | $322,256 |
Balance Sheet 1995
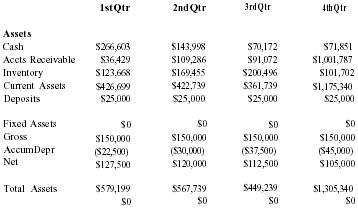
| 1st Qtr | 2nd Qtr | 3rd Qtr | 4th Qtr | |
| Assets | ||||
| Cash | $266,603 | $143,998 | $70,172 | $71,851 |
| Accts Receivable | $36,429 | $109,286 | $91,072 | $1,001,787 |
| Inventory | $123,668 | $169,455 | $200,496 | $101,702 |
| Current Assets | $426,699 | $422,739 | $361,739 | $1,175,340 |
| Deposits | $25,000 | $25,000 | $25,000 | $25,000 |
| Fixed Assets | $0 | $0 | $0 | $0 |
| Gross | $150,000 | $150,000 | $150,000 | $150,000 |
| Accum Depr | ($22,500) | ($30,000) | ($37,500) | ($45,000) |
| Net | $127,500 | $120,000 | $112,500 | $105,000 |
| Total Assets | $579,199 | $567,739 | $449,239 | $1,305,340 |
| $0 | $0 | $0 | $0 | |
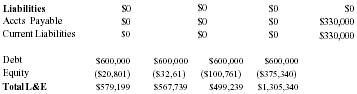
| Liabilities | $0 | $0 | $0 | $0 |
| Accts Payable | $0 | $0 | $0 | $330,000 |
| Current Liabilities | $0 | $0 | $0 | $330,000 |
| Debt | $600,000 | $600,000 | $600,000 | $600,000 |
| Equity | ($20,801) | ($32,61) | ($100,761) | ($375,340) |
| Total L&E | $579,199 | $567,739 | $499,239 | $1,305,340 |
Cash Flow 1995
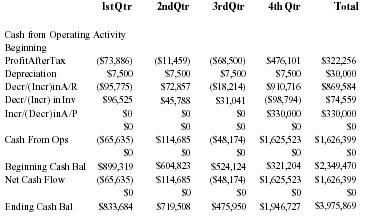
| lst Qtr | 2nd Qtr | 3rd Qtr | 4th Qtr | Total | |
| Cash from Operating Activity | |||||
| Beginning Profit After Tax | ($73,886) | ($11,459) | ($68,500) | $476,101 | $322,256 |
| Depreciation | $7,500 | $7,500 | $7,500 | $7,500 | $30,000 |
| Decr/(Incr) in A/R | ($95,775) | $72,857 | ($18,214) | $910,716 | $869,584 |
| Decr/(Incr) in Inv | $96,525 | $45,788 | $31,041 | ($98,794) | $74,559 |
| Incr/(Decr) in A/P | $0 | $0 | $0 | $330,000 | $330,000 |
| $0 | $0 | $0 | $0 | $0 | |
| Cash From Ops | ($65,635) | $114,685 | ($48,174) | $1,625,523 | $1,626,399 |
| $0 | $0 | $0 | $0 | $0 | |
| Beginning Cash Bal | $899,319 | $604,823 | $524,124 | $321,204 | $2,349,470 |
| Net Cash Flow | ($65,635) | $114,685 | ($48,174) | $1,625,523 | $1,626,399 |
| $0 | $0 | $0 | $0 | $0 | |
| Ending Cash Bal | $833,684 | $719,508 | $475,950 | $1,946,727 | $3,975,869 |
Units Sales 1996
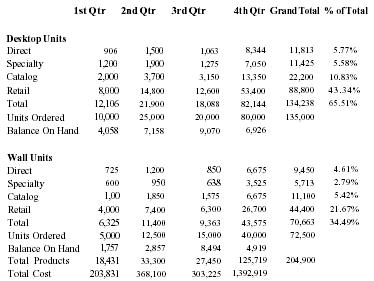
| 1st Qtr | 2nd Qtr | 3rd Qtr | 4th Qtr | Grand Total | % of Total | |
| Desktop Units | ||||||
| Direct | 906 | 1,500 | 1,063 | 8,344 | 11,813 | 5.77% |
| Specialty | 1,200 | 1,900 | 1,275 | 7,050 | 11,425 | 5.58% |
| Catalog | 2,000 | 3,700 | 3,150 | 13,350 | 22,200 | 10.83% |
| Retail | 8,000 | 14,800 | 12,600 | 53,400 | 88,800 | 43.34% |
| Total | 12,106 | 21,900 | 18,088 | 82,144 | 134,238 | 65.51% |
| Units Ordered | 10,000 | 25,000 | 20,000 | 80,000 | 135,000 | |
| Balance On Hand | 4,058 | 7,158 | 9,070 | 6,926 | ||
| Wall Units | ||||||
| Direct | 725 | 1,200 | 850 | 6,675 | 9,450 | 4.61% |
| Specialty | 600 | 950 | 638 | 3,525 | 5,713 | 2.79% |
| Catalog | 1,00 | 1,850 | 1,575 | 6,675 | 11,100 | 5.42% |
| Retail | 4,000 | 7,400 | 6,300 | 26,700 | 44,400 | 21.67% |
| Total | 6,325 | 11,400 | 9,363 | 43,575 | 70,663 | 34.49% |
| Units Ordered | 5,000 | 12,500 | 15,000 | 40,000 | 72,500 | |
| Balance On Hand | 1,757 | 2,857 | 8,494 | 4,919 | ||
| Total Products | 18,431 | 33,300 | 27,450 | 125,719 | 204,900 | |
| Total Cost | 203,831 | 368,100 | 303,225 | 1,392,919 | ||
Income 1996
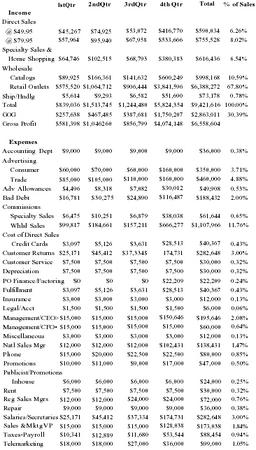
| lst Qtr | 2nd Qtr | 3rd Qtr | 4th Qtr | Total | % of Sales | |
| Income | ||||||
| Direct Sales | ||||||
| @ $49.95 | $45,267 | $74,925 | $53,072 | $416,770 | $590,034 | 6.26% |
| @ $79.95 | $57,964 | $95,940 | $67,958 | $533,666 | $755,528 | 8.02% |
| Specialty Sales & Home Shopping | $64,746 | $102,515 | $68,793 | $380,383 | $616,436 | 6.54% |
| Wholesale | ||||||
| Catalogs | $89,925 | $166,361 | $141,632 | $600,249 | $998,168 | 10.59% |
| Retail Outlets | $575,520 | $1,064,712 | $906,444 | $3,841,596 | $6,388,272 | 67.80% |
| Ship/Hndlg | $5,614 | $9,293 | $6,582 | $51,690 | $73,178 | 0.78% |
| Total | $839,036 | $1,513,745 | $1,244,480 | $5,824,354 | $9,421,616 | 100.00% |
| COG | $257,638 | $467,485 | $387,681 | $1,750,207 | $2,863,011 | 30.39% |
| Gross Profit | $581,398 | $1,046,260 | $856,799 | $4,074,148 | $6,558,604 | |
| Expenses | ||||||
| Accounting Dept | $9,000 | $9,000 | $9,000 | $9,000 | $36,000 | 0.38% |
| Advertising | ||||||
| Consumer | $60,000 | $70,000 | $60,000 | $160,000 | $350,000 | 3.71% |
| Trade | $85,000 | $105,000 | $110,000 | $160,000 | $460,000 | 4.88% |
| Adv Allowances | $4,496 | $8,318 | $7,082 | $30,012 | $49,908 | 0.53% |
| Bad Debt | $16,781 | $30,275 | $24,890 | $116,487 | $188,432 | 2.00% |
| Commissions | ||||||
| Specialty Sales | $6,475 | $10,251 | $6,879 | $38,038 | $61,644 | 0.65% |
| Whlsl Sales | $99,817 | $184,661 | $157,211 | $666,277 | $1,107,966 | 11.76% |
| Cost of Direct Sales | ||||||
| Credit Cards | $3,097 | $5,126 | $3,631 | $28,513 | $40,367 | 0.43% |
| Customer Returns | $25,171 | $45,412 | $37,334$ | 174,731 | $282,648 | 3.00% |
| Customer Service | $7,500 | $7,500 | $7,500 | $7,500 | $30,000 | 0.32% |
| Depreciation | $7,500 | $7,500 | $7,500 | $7,500 | $30,000 | 0.32% |
| PO Finance/Factoring | $0 | $0 | $0 | $22,209 | $22,209 | 0.24% |
| Fulfillment | $3,097 | $5,126 | $3,631 | $28,513 | $40,367 | 0.43% |
| Insurance | $3,000 | $3,000 | $3,000 | $3,000 | $12,000 | 0.13% |
| Legal/Acct | $1,500 | $1,500 | $1,500 | $1,500 | $6,000 | 0.06% |
| Management/CEO | $15,000 | $15,000 | $15,000 | $150,646 | $195,646 | 2.08% |
| Management/CFO | $15,000 | $15,000 | $15,000 | $15,000 | $60,000 | 0.64% |
| Miscellaneous | $3,000 | $3,000 | $3,000 | $3,000 | $12,000 | 0.13% |
| Natl Sales Mgr | $12,000 | $12,000 | $12,000 | $102,431 | $138,431 | 1.47% |
| Phone | $15,000 | $20,000 | $22,500 | $22,500 | $80,000 | 0.85% |
| Promotions | $10,000 | $11,000 | $9,000 | $17,000 | $47,000 | 0.50% |
| Publicist/Promotions | ||||||
| Inhouse | $6,000 | $6,000 | $6,000 | $6,000 | $24,000 | 0.25% |
| Rent | $7,500 | $7,500 | $7,500 | $7,500 | $30,000 | 0.32% |
| Reg Sales Mgrs | $12,000 | $12,000 | $24,000 | $24,000 | $72,000 | 0.76% |
| Repair | $9,000 | $9,000 | $9,000 | $9,000 | $36,000 | 0.38% |
| Salaries/Secretaries | $25,171 | $45,412 | $37,334 | $174,731 | $282,648 | 3.00% |
| Sales & Mktg VP | $15,000 | $15,000 | $15,000 | $128,038 | $173,038 | 1.84% |
| Taxes-Payroll | $10,341 | $12,889 | $11,680 | $53,544 | $88,454 | 0.94% |
| Telemarketing | $18,000 | $18,000 | $27,000 | $36,000 | $99,000 | 1.05% |
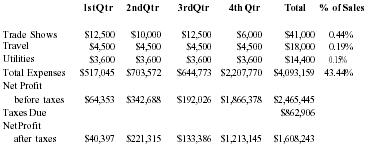
| lst Qtr | 2nd Qtr | 3rd Qtr | 4th Qtr | Total | % of Sales | |
| Trade Shows | $12,500 | $10,000 | $12,500 | $6,000 | $41,000 | 0.44% |
| Travel | $4,500 | $4,500 | $4,500 | $4,500 | $18,000 | 0.19% |
| Utilities | $3,600 | $3,600 | $3,600 | $3,600 | $14,400 | 0.15% |
| Total Expenses | $517,045 | $703,572 | $644,773 | $2,207,770 | $4,093,159 | 43.44% |
| Net Profit before taxes | $64,353 | $342,688 | $192,026 | $1,866,378 | $2,465,445 | |
| Taxes Due | $862,906 | |||||
| Net Profit after taxes | $40,397 | $221,315 | $133,386 | $1,213,145 | $1,608,243 |
Balance Sheet 1996

| 1st Qtr | 2nd Qtr | 3rd Qtr | 4th Qtr | |
| Assets | ||||
| Cash | $334,006 | $894,926 | $556,851 | $908,988 |
| Accts Recvble | $166,361 | $532,356 | $249,542 | $2,195,969 |
| Inventory | $62,871 | $107,271 | $209,046 | $136,127 |
| Current Assets | $563,237 | $1,534,552 | $1,015,438 | $3,241,084 |
| Deposits | $25,000 | $25,000 | $25,000 | $25,000 |
| Fixed Assets | $0 | $0 | $0 | $0 |
| Gross | $150,000 | $150,000 | $150,000 | $150,000 |
| Accum Depr | ($52,500) | ($60,000 | ($67,500) | ($75,000) |
| Net | $97,500 | $90,000 | $82,500 | $75,000 |
| Total Assets | $685,737 | $1,649,552 | $1,122,938 | $3,341,084 |
| $0 | $0 | $0 | $0 | |
| Liabilities | $0 | $0 | $0 | $0 |
| Accts Payable | ($330,000) | $412,400 | ($247,500) | $757,500 |
| Current Liabs | ($330,000) | $412,500 | ($247,500) | $757,500 |
| Debt | $600,000 | $600,000 | $600,000 | $600,000 |
| Equity | $415,737 | $637,052 | $770,438 | $1,983,584 |
| Total L&E | $685,737 | $1,649,552 | $1,122,938 | $3,341,084 |
Cash Flow 1996
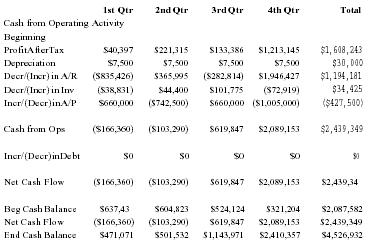
| 1st Qtr | 2nd Qtr | 3rd Qtr | 4th Qtr | Total | |
| Cash from Operating Activity | |||||
| Beginning Profit After Tax | $40,397 | $221,315 | $133,386 | $1,213,145 | $1,608,243 |
| Depreciation | $7,500 | $7,500 | $7,500 | $7,500 | $30,000 |
| Decr/(Incr) in A/R | ($835,426) | $365,995 | ($282,814) | $1,946,427 | $1,194,181 |
| Decr/(Incr) in Inv | ($38,831) | $44,400 | $101,775 | ($72,919) | $34,425 |
| Incr/(Decr) in A/P | $660,000 | ($742,500) | $660,000 | ($1,005,000) | ($427,500) |
| Cash from Ops | ($166,360) | ($103,290) | $619,847 | $2,089,153 | $2,439,349 |
| Incr/(Decr) in Debt | $0 | $0 | $0 | $0 | $0 |
| Net Cash Flow | ($166,360) | ($103,290) | $619,847 | $2,089,153 | $2,439,349 |
| Beg Cash Balance | $637,432 | $604,823 | $524,124 | $321,204 | $2,087,582 |
| Net Cash Flow | ($166,360) | ($103,290) | $619,847 | $2,089,153 | $2,439,349 |
| End Cash Balance | $471,071 | $501,532 | $1,143,971 | $2,410,357 | $4,526,932 |
Units Sales 1997
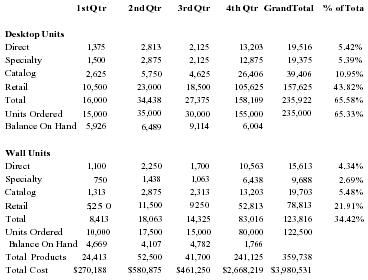
| 1st Qtr | 2nd Qtr | 3rd Qtr | 4th Qtr | Grand Total | % of Total | |
| Desktop Units | ||||||
| Direct | 1,375 | 2,813 | 2,125 | 13,203 | 19,516 | 5.42% |
| Specialty | 1,500 | 2,875 | 2,125 | 12,875 | 19,375 | 5.39% |
| Catalog | 2,625 | 5,750 | 4,625 | 26,406 | 39,406 | 10.95% |
| Retail | 10,500 | 23,000 | 18,500 | 105,625 | 157,625 | 43.82% |
| Total | 16,000 | 34,438 | 27,375 | 158,109 | 235,922 | 65.58% |
| Units Ordered | 15,000 | 35,000 | 30,000 | 155,000 | 235,000 | 65.33% |
| Balance On Hand | 5,926 | 6,489 | 9,114 | 6,004 | ||
| Wall Units | ||||||
| Direct | 1,100 | 2,250 | 1,700 | 10,563 | 15,613 | 4.34% |
| Specialty | 750 | 1,438 | 1,063 | 6,438 | 9,688 | 2.69% |
| Catalog | 1,313 | 2,875 | 2,313 | 13,203 | 19,703 | 5.48% |
| Retail | 5,250 | 11,500 | 9,250 | 52,813 | 78,813 | 21.91% |
| Total | 8,413 | 18,063 | 14,325 | 83,016 | 123,816 | 34.42% |
| Units Ordered | 10,000 | 17,500 | 15,000 | 80,000 | 122,500 | |
| Balance On Hand | 4,669 | 4,107 | 4,782 | 1,766 | ||
| Total Products | 24,413 | 52,500 | 41,700 | 241,125 | 359,738 | |
| Total Cost | $270,188 | $580,875 | $461,250 | $2,668,219 | $3,980,531 | |
Income 1997
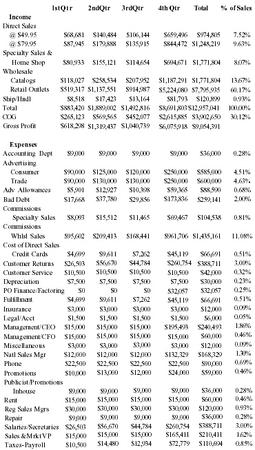
| lst Qtr | 2nd Qtr | 3rd Qtr | 4th Qtr | Total | % of Sales | |
| Income | ||||||
| Direct Sales | ||||||
| @ $49.95 | $68,681 | $140,484 | $106,144 | $659,496 | $974,805 | 7.52% |
| @ $79.95 | $87,945 | $179,888 | $135,915 | $844,472 | $1,248,219 | 9.63% |
| Specialty Sales & Home Shop | $80,933 | $155,121 | $114,654 | $694,671 | $1,771,804 | 8.07% |
| Wholesale | ||||||
| Catalogs | $118,027 | $258,534 | $207,952 | $1,187,291 | $1,771,804 | 13.67% |
| Retail Outlets | $519,317 | $1,137,551 | $914,987 | $5,224,080 | $7,795,935 | 60.17% |
| Ship/Hndl | $8,518 | $17,423 | $13,164 | $81,793 | $120,899 | 0.93% |
| Total | $883,420 | $1,889,002 | $1,492,816 | $8,691,803 | $12,957,041 | 100.00% |
| COG | $265,123 | $569,565 | $452,077 | $2,615,885 | $3,902,650 | 30.12% |
| Gross Profit | $618,298 | $1,319,437 | $1,040,739 | $6,075,918 | $9,054,391 | |
| Expenses | ||||||
| Accounting Dept | $9,000 | $9,000 | $9,000 | $9,000 | $36,000 | 0.28% |
| Advertising | ||||||
| Consumer | $90,000 | $125,000 | $120,000 | $250,000 | $585,000 | 4.51% |
| Trade | $90,000 | $130,000 | $130,000 | $250,000 | $600,000 | 4.63% |
| Adv Allowances | $5,901 | $12,927 | $10,398 | $59,365 | $88,590 | 0.68% |
| Bad Debt | $17,668 | $37,780 | $29,856 | $173,836 | $259,141 | 2.00% |
| Commissions Specialty Sales | $8,093 | $15,512 | $11,465 | $69,467 | $104,538 | 0.81% |
| Commissions Whlsl Sales | $95,602 | $209,413 | $168,441 | $961,706 | $1,435,161 | 11.08% |
| Cost of Direct Sales Credit Cards | $4,699 | $9,611 | $7,262 | $45,119 | $66,691 | 0.51% |
| Customer Returns | $26,503 | $56,670 | $44,784 | $260,754 | $388,711 | 3.00% |
| Customer Service | $10,500 | $10,500 | $10,500 | $10,500 | $42,000 | 0.32% |
| Depreciation | $7,500 | $7,500 | $7,500 | $7,500 | $30,000 | 0.23% |
| PO Finance/Factoring | $0 | $0 | $0 | $32,057 | $32,057 | 0.25% |
| Fulfillment | $4,699 | $9,611 | $7,262 | $45,119 | $66,691 | 0.51% |
| Insurance | $3,000 | $3,000 | $3,000 | $3,000 | $12,000 | 0.09% |
| Legal/Acct | $1,500 | $1,500 | $1,500 | $1,500 | $6,000 | 0.05% |
| Management/CEO | $15,000 | $15,000 | $15,000 | $195,493 | $240,493 | 1.86% |
| Management/CFO | $15,000 | $15,000 | $15,000 | $15,000 | $60,000 | 0.46% |
| Miscellaneous | $3,000 | $3,000 | $3,000 | $3,000 | $12,000 | 0.09% |
| Natl Sales Mgr | $12,000 | $12,000 | $12,000 | $132,329 | $168,329 | 1.30% |
| Phone | $22,500 | $22,500 | $22,500 | $22,500 | $90,000 | 0.69% |
| Promotions | $10,000 | $13,000 | $12,000 | $24,000 | $59,000 | 0.46% |
| Publicist/Promotions Inhouse | $9,000 | $9,000 | $9,000 | $9,000 | $36,000 | 0.28% |
| Rent | $15,000 | $15,000 | $15,000 | $15,000 | $60,000 | 0.46% |
| Reg Sales Mgrs | $30,000 | $30,000 | $30,000 | $30,000 | $120,000 | 0.93% |
| Repair | $9,000 | $9,000 | $9,000 | $9,000 | $36,000 | 0.28% |
| Salaries/Secretaries | $26,503 | $56,670 | $44,784 | $260,754 | $388,711 | 3.00% |
| Sales & Mrkt VP | $15,000 | $15,000 | $15,000 | $165,411 | $210,411 | 1.62% |
| Taxes-Payroll | $10,500 | $14,480 | $12,934 | $72,779 | $110,694 | 0.85% |
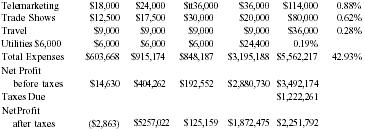
| Telemarketing | $18,000 | $24,000 | $36,000 | $36,000 | $114,000 | 0.88% |
| Trade Shows | $12,500 | $17,500 | $30,000 | $20,000 | $80,000 | 0.62% |
| Travel | $9,000 | $9,000 | $9,000 | $9,000 | $36,000 | 0.28% |
| Utilities $6,000 | $6,000 | $6,000 | $6,000 | $24,400 | 0.19% | |
| Total Expenses | $603,668 | $915,174 | $848,187 | $3,195,188 | $5,562,217 | 42.93% |
| Net Profit before taxes | $14,630 | $404,262 | $192,552 | $2,880,730 | $3,492,174 | |
| Taxes Due | $1,222,261 | |||||
| Net Profit after taxes | ($2,863) | $5,257,022 | $125,159 | $1,872,475 | $2,251,792 |
Balance Sheet 1997
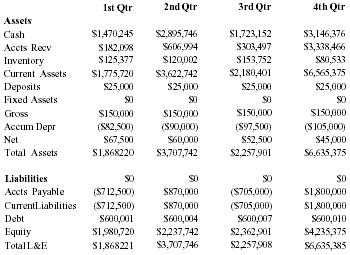
| 1st Qtr | 2nd Qtr | 3rd Qtr | 4th Qtr | |
| Assets | ||||
| Cash | $1,470,245 | $2,895,746 | $1,723,152 | $3,146,376 |
| Accts Recv | $182,098 | $606,994 | $303,497 | $3,338,466 |
| Inventory | $125,377 | $120,002 | $153,752 | $80,533 |
| Current Assets | $1,775,720 | $3,622,742 | $2,180,401 | $6,565,375 |
| Deposits | $25,000 | $25,000 | $25,000 | $25,000 |
| Fixed Assets | $0 | $0 | $0 | $0 |
| Gross | $150,000 | $150,000 | $150,000 | $150,000 |
| Accum Depr | ($82,500) | ($90,000) | ($97,500) | ($105,000) |
| Net | $67,500 | $60,000 | $52,500 | $45,000 |
| Total Assets | $1,868,220 | $3,707,742 | $2,257,901 | $6,635,375 |
| Liabilities | $0 | $0 | $0 | $0 |
| Accts Payable | ($712,500) | $870,000 | ($705,000) | $1,800,000 |
| Current Liabilities | ($712,500) | $870,000 | ($705,000) | $1,800,000 |
| Debt | $600,001 | $600,004 | $600,007 | $600,010 |
| Equity | $1,980,720 | $2,237,742 | $2,362,901 | $4,235,375 |
| Total L&E | $1,868,221 | $3,707,746 | $2,257,908 | $6,635,385 |
Cash Flow 1997
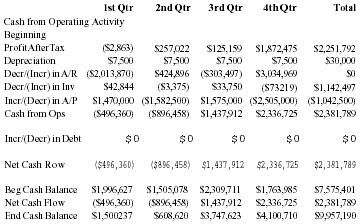
| 1st Qtr | 2nd Qtr | 3rd Qtr | 4th Qtr | Total | |
| Cash from Operating Activity | |||||
| Beginning Profit After Tax | ($2,863) | $257,022 | $125,159 | $1,872,475 | $2,251,792 |
| Depreciation | $7,500 | $7,500 | $7,500 | $7,500 | $30,000 |
| Decr/(Incr) in A/R | ($2,013,870) | $424,896 | ($303,497) | $3,034,969 | $0 |
| Decr/(Incr) in Inv | $42,844 | ($3,375) | $33,750 | ($73,219) | $1,142,497 |
| Incr/(Decr) in A/P | $1,470,000 | ($1,582,500) | $1,575,000 | ($2,505,000) | ($1,042,500) |
| Cash from Ops | ($496,360) | ($896,458) | $1,437,912 | $2,336,725 | $2,381,789 |
| Incr/(Decr) in Debt | $0 | $0 | $0 | $0 | $0 |
| Net Cash Flow | ($496,360) | ($896,458) | $1,437,912 | $2,336,725 | $2,381,789 |
| Beg Cash Balance | $1,996,627 | $1,505,078 | $2,309,711 | $1,763,985 | $7,575,401 |
| Net Cash Flow | ($496,360) | ($896,458) | $1,437,912 | $2,336,725 | $2,381,789 |
| End Cash Balance | $1,500,237 | $608,620 | $3,747,623 | $4,100,710 | $9,957,190 |
Comment about this article, ask questions, or add new information about this topic: