Multilevel Marketing Business
BUSINESS PLAN
RFM ENTERPRISES
1842 Devon Lane
St. Cloud, MN 55123
October 1995
This plan describes one of the many different types of multilevel marketing businesses. In this type of arrangement, a business recruits individuals to sell its products or services for a cut of their profits. These individuals, in turn, recruit others to do the something, also for a cut of their profits. The process usually continues, in a pyramidal fashion, for 4 to 10 levels, with higher-level individuals earning more money as the lower levels fill with new recruits.
- EXECUTIVE SUMMARY
- COMPANY OVERVIEW
- PRODUCT STRATEGY
- MARKET ANALYSIS
- FINANCIAL PLAN
- CONCLUSION
EXECUTIVE SUMMARY
Vision/Mission
RFM Enterprises was created in 1994 and is currently in the start-up phase. Our company can be described as being in the long distance business. Our key strengths have been thorough planning & organization while taking advantage of the latest technology.
We are a family-owned business, so for the moment our management team is in place. As we expand and diversify, additional members will be brought on-board to meet our changing needs. Also, we are considering the addition of one partner.
We are both Independent Representatives with Advance Telecommunications, which is a solid professional corporation with a top management team. Jerry Bass, the chief executive officer, started Advance in Dallas, Texas in 1988. Today, Advance has thousands of Independent Representatives across the country. Advance is a national corporation, one of only a handful of nationally licensed long distance carriers in America, and offers the highest quality service at competitive rates. Advance offers immediate cash income, serious income potential, long term residual income and the opportunity to get paid, again and again, for the work we do today, because Advance Representatives receive a percentage of every customer's long distance phone bill in their down-line. Advance provides the finest long distance programs in America today. In addition to all the standard services offered by other major long distance companies, Advance offers the opportunity for our customers to save up to 50% on their long distance calls. Advance also offers a personal 800 service that can't be beat, and all of our customers, just for trying our service, receive the most attractive incentives in the industry.
A Few Facts About Advance
- Solid, professional corporation
- Digital, fiber-optic network
- $155 million dollar company
- Competitive rates and impressive discounts
- Nationally licensed
- Over 400% growth in 1994
- Highest quality service
- FCC and state regulated as a public utility
Marketing & Sales Environment
The long distance industry is controlled by US Telecommunications, who currently has 70% of the market. Advance currently has .0001% of the market and is shooting for 17% market share by 1998.
Vision & Mission Statements
The long range vision of RFM Enterprises is that by 1998, we will become a highly visible, diversified international corporation known for our customer service, sound management, profitability, and flexible working environment. By that time, we will have become Executive Directors for Advance Telecommunications & profits from services will exceed $300,000,000.00 annually as we actively grow our long distance customer base.
In order to achieve this vision, RFM Enterprises commits to the following mission statement:
We exist to provide cost-effective alternatives to our customers seeking quality long distance services. We believe our first responsibility is to our customers. We will strive to establish and maintain a strong financial position that enables us to expand as Advance grows. In conducting our day to day operations, we will strive to:
- Treat all colleagues and co-workers with respect & fairness.
- Follow a philosophy that says, "The customers are the business."
- Make positive contributions to the communities with which we do business and the community in which we live.
- Develop and enhance the skills of our down-line associates with the intention of providing promotional opportunities.
Through a long-term commitment to this mission statement, we will be known as a company that is committed to its customers, associates, and communities. Our profits, in part, will be derived from the intangible benefits received from making a positive impact through charitable donations to the "Just Say No" anti-drug program.
Strategic Goals
In order for RPM Enterprises to attain the vision described in our mission statement, the following primary strategic goals need to be achieved:
Products
By then end of 1995, we will have achieved a customer base and down-line to include:
- 40 personal customers.
- 6 personally sponsored representatives, all of which will be Area Coordinators.
- More than 12 people in the down-line of each business
Market
We will expand our marketing efforts to ensure our customer base is always 33% beyond the minimum of 20 required by Advance.
Sales
Independent studies show long distance sales will continue to grow by $500 million per month. We intend to capture a very small portion of that market.
Finance
Through the year 1995, RPM Enterprises will carefully evaluate & plan investments & budget expenses to generate a consistent pre-tax profit. Based on a 1% market share, we estimate our net profits will exceed 800% annually from our initial investment.
We feel very confident that the goals listed above are realistic and achievable. The driving force behind the written goal is our desire to be financially independent so we can spend more time together as a family. The reason why we are doing this is much more important than how. Since we understand why, the remainder of the business plan explains how we will achieve our goals.
COMPANY OVERVIEW
Legal Business Description
The legal form of RFM Enterprises is sole proprietorship located in St. Cloud, MN.
Management Team
The RFM management team is as diverse as the operation and our combined experience spans more than 35 years of sales, technical, financial analysis, and customer service with North American Airlines and the Industrial Film Corporation.
In-House Management
Rosalind Mathis, President
Rosalind will develop & maintain the vision of the company while managing marketing, product development, production, finance, and customer service operations. Rosalind has final approval of all financial obligations and initiates all new business opportunities. Rosalind provides direction for the financial programs to provide funding for new & continuing operations in an effort to maximize return on investments and increase productivity.
Franklin Mathis, Vice President
Frank manages market planning, research & development, advertising, sales promotion, merchandising and staffing. Frank identifies & oversees new market research and competitive research, directs training and sets performance standards for the staff, and develops performance evaluations to develop and control sales programs.
Outside Management Support
Dave Sweeney, Financial Planner
Christopher Davis, Corporate Attorney
Len Dart, Marketing Logo Designer
By January of 1996, an outside Board of Directors, including 3 highly qualified business and industry professionals, will assist our management team in making appropriate decisions that will result in effective action. They will not, however, be responsible for management decisions.
PRODUCT STRATEGY
Our long distance service offers the following:
- Discounted residential long distance service (Advance Bonus)
- Discounted commercial long distance services (Advance Bonus II, Charter Gold, Founders Club)
- Major national and international carriers & crystal clear digital fiber optic network
- 1 + dialing & fax, computer and voice carriage
- Residential incoming 800 service (Personal 800) & commercial incoming 800 service (Charter 800)
- Free Advance calling cards & account and project codes
- Commercial account 6-second billing & no minimum usage charges
- Full detailed billing by local phone companies and other LECs of Advance
- Unsurpassed customer incentives
Production and Delivery
The long distance division has several business advantages in this area which include:
- No inventory
- No deliveries
- No collections
- No customer risk
- No employees
- No quotas
- No products to purchase
- No complicated math or paperwork
- No experience necessary
- We are building our business nationally
- We gather customers nationally
- Our customers gather customers for us
- We have seen immediate weekly income
- We are working towards long-term residual income
- Advance provides training for us
MARKET ANALYSIS
Market Definition
In the long distance division, our target is the "warm" market of residential customers that consists of friends and family. We expand our business by recruiting other ambitious people like ourselves that want to earn additional cash. We became Independent Representatives with Advance by purchasing the Management Services Program for $195. This program included all the materials needed to successfully start our business. We were trained by a certified trainer, who is paid by Advance. Advance tracks our organization, provides us with a home office support system, monthly statements, newsletters, and most importantly, much of our bookkeeping is done by Advance. We will look at a separate or an additional opportunity to become an Area Coordinator in the near future. Area Coordinators train new Managing Representatives and are paid $40 for each. The cost is $395, which covers the cost of the training and the training tools used as an Area Coordinator.
Advance's compensation plan is quite extensive and I will provide some highlights in the financial section of this business plan. It is explained in detail in the Management Representative training.
Customer Profile
Our target customer in the long distance industry is the residential customer.
Competition
Companies that compete in the long distance industry have not attempted to sell their services via network marketing and, therefore, the market is wide open and untapped at this time. Our prices are lower than US Telecommunications and our service is identical, since we utilize the same digital communications lines.
The following key factors have resulted in the present competitive position in the vending industry:
- Ease of entry into the market.
- Low overhead (i.e., labor),
- Relatively little knowledge is required for entry & operation.
Our strategy for holding our place in this competitive market is better customer service. It is our opinion that an individual could start any business in the United States, and if that business were to focus on customer service and satisfaction, the venture would certainly enjoy the lion's share of the market. This is because majority of the competition is not customer-driven but market & financial driven. In essence, you would stand alone if your service continually meets and exceeds the customer's expectations.
Risk
We see no risk in the long distance industry.
Sales Strategy
In the long distance division, we plan to approach friends and family who will switch their service in order to help us out. They are not concerned about rates: in fact, we could be as expensive as US Telecommunications and they would still be our customers because they are friends or family. Since we are lower than US Telecommunications, they will not switch when US Telecommunications calls them and asks for their business back.
When we sign additional people as Managing Representatives, we earn $100 as soon as each of them has 3 customers! We earn $5-$15 for new Managing Representatives on levels 2-7.
We earn varying commissions on the long distance usage of all the customers in our down-line 7 levels deep! We earn an annual retention bonus of $50 for each level 1 Managing Representative on their annual renewal date and smaller amounts for Managing Representatives on levels 2-7.
When we become Senior Representatives, instead of earning $100 for each new Managing Representative we sign up, we earn $190. We also receive $90 for each new Managing Representative signed up by representatives in our down-line to unlimited depth! When we become Regional Directors, we receive $240 for each new Managing Representative we sign up and $140 for new Managing Representatives in our down-line to unlimited depth! When we become Executive Directors, we receive $265 for each new Managing Representative we sign up and $165 for new Managing Representatives in our down-line to unlimited depth! The power of Advance's 7-level marketing plan is amazing.
As mentioned earlier in the Market Analysis, RFM Enterprises is of the opinion that any organization that is truly customer-driven will be successful in any marketplace because so few companies focus on this area. It costs nothing to be a customer-driven organization and the benefits are so great, they cannot be quantified.
Capital Requirements
According to the opportunities and requirements for RFM Enterprises described in this business plan, and based on what we feel are sound business assumptions, our initial capital requirements are complete.
We do not anticipate additional investment requirements in the future.
FINANCIAL PLAN
Detailed Financial Analysis
The following analysis was accomplished making the following assumptions:
- Rosalind & Frank will expend 10 hours each per week towards the business.
- We will recruit an average of 1 representative per month.
- Our representatives will each recruit 1 representative every 4 months.
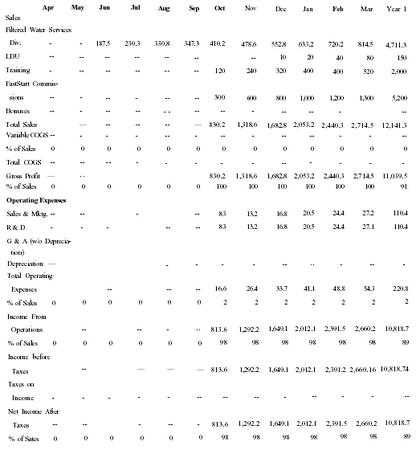
| Income Statement (Year 1 by Month) | ||||||||||||||
| Apr | May | Jun | Jul | Aug | Sep | Oct | Nov | Dec | Jan | Feb | Mar | Year 1 | ||
| Sales | ||||||||||||||
| Filtered Water Services Div. | — | — | 187.5 | 230.3 | 330.8 | 347.3 | 410.2 | 478.6 | 552.8 | 633.2 | 720.2 | 814.5 | 4,711.3 | |
| LDU | — | — | — | — | — | — | — | — | 10 | 20 | 40 | 80 | 150 | |
| Training | — | — | — | — | — | — | 120 | 240 | 320 | 400 | 400 | 520 | 2,000 | |
| FastStart Commissions | — | — | — | — | — | — | 300 | 600 | 800 | 1,000 | 1,200 | 1,300 | 5,200 | |
| Bonuses | — | — | — | — | — | — | — | — | — | — | — | — | — | |
| Total Sales | — | — | — | — | — | — | 830.2 | 1,318.6 | 1,682.8 | 2,053.2 | 2,440.3 | 2,714.5 | 12,141.3 | |
| Variable COGS | — | — | — | — | — | — | — | — | — | — | — | — | — | |
| % of Sales | 0 | 0 | 0 | 0 | 0 | 0 | 0 | 0 | 0 | 0 | 0 | 0 | 0 | 0 |
| Total COGS | — | — | — | — | — | — | — | — | — | — | — | — | — | |
| Gross Profit | — | — | — | — | — | — | 830.2 | 1,318.6 | 1,682.8 | 2,053.2 | 2,440.3 | 2,714.5 | 11,039.5 | |
| % of Sales | 0 | 0 | 0 | 0 | 0 | 0 | 100 | 100 | 100 | 100 | 100 | 100 | 91 | |
| Operating Expenses | ||||||||||||||
| Sales & Mktg. | — | — | — | — | — | — | 83 | 13.2 | 16.8 | 20.5 | 24.4 | 27.2 | 110.4 | |
| R & D | — | — | — | — | — | — | 83 | 13.2 | 16.8 | 20.5 | 24.4 | 27.1 | 110.4 | |
| G & A (w/o Depreciation) | — | — | — | — | — | — | — | — | — | — | — | — | — | |
| Depreciation | — | — | — | — | — | — | — | — | — | — | — | — | — | |
| Total Operating Expenses | — | — | — | — | — | — | 16.6 | 26.4 | 33.7 | 41.1 | 48.8 | 54.3 | 220.8 | |
| % of Sales | 0 | 0 | 0 | 0 | 0 | 0 | 0 | 2 | 2 | 2 | 2 | 2 | 2 | 2 |
| Income From Operations | — | — | — | — | — | — | 813.6 | 1,292.2 | 1,649.1 | 2,012.1 | 2,391.5 | 2,660.2 | 10,818.7 | |
| % of Sales | 0 | 0 | 0 | 0 | 0 | 0 | 98 | 98 | 98 | 98 | 98 | 98 | 89 | |
| Income before Taxes | — | — | — | — | — | — | 813.6 | 1,292.2 | 1,649.1 | 2,012.1 | 2,391.2 | 2,660.16 | 10,818.74 | |
| Taxes on Income | — | — | — | — | — | — | — | — | — | — | — | — | — | |
| Net Income After Taxes | — | — | — | — | — | — | 813.6 | 1,292.2 | 1,649.1 | 2,012.1 | 2,391.5 | 2,660.2 | 10,818.7 | |
| % of Sates | 0 | 0 | 0 | 0 | 0 | 0 | 98 | 98 | 98 | 98 | 98 | 98 | 89 | |
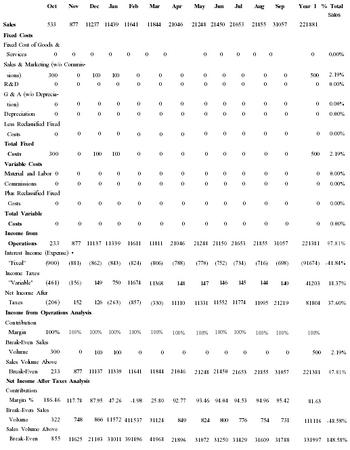
| Break-Even Analysis (Year 1 by Month) | ||||||||||||||
| Oct | Nov | Dec | Jan | Feb | Mar | Apr | May | Jun | Jul | Aug | Sep | Year 1 | % Total Sales | |
| Sales | 533 | 877 | 11237 | 11439 | 11641 | 11844 | 21046 | 21248 | 21450 | 21653 | 21855 | 31057 | 221881 | |
| Fixed Costs | ||||||||||||||
| Fixed Cost of Goods & Services | 0 | 0 | 0 | 0 | 0 | 0 | 0 | 0 | 0 | 0 | 0 | 0 | 0 | 0.00% |
| Sales & Marketing (w/o Commissions) | 300 | 0 | 100 | 100 | 0 | 0 | 0 | 0 | 0 | 0 | 0 | 0 | 500 | 2.19% |
| R & D | 0 | 0 | 0 | 0 | 0 | 0 | 0 | 0 | 0 | 0 | 0 | 0 | 0 | 0.00% |
| G & A (w/o Depreciation) | 0 | 0 | 0 | 0 | 0 | 0 | 0 | 0 | 0 | 0 | 0 | 0 | 0 | 0.00% |
| Depreciation | 0 | 0 | 0 | 0 | 0 | 0 | 0 | 0 | 0 | 0 | 0 | 0 | 0 | 0.00% |
| Less Reclassified Fixed Costs | 0 | 0 | 0 | 0 | 0 | 0 | 0 | 0 | 0 | 0 | 0 | 0 | 0 | 0.00% |
| Total Fixed Costs | 300 | 0 | 100 | 100 | 0 | 0 | 0 | 0 | 0 | 0 | 0 | 0 | 500 | 2.19% |
| Variable Costs | ||||||||||||||
| Material and Labor | 0 | 0 | 0 | 0 | 0 | 0 | 0 | 0 | 0 | 0 | 0 | 0 | 0 | 0.00% |
| Commissions | 0 | 0 | 0 | 0 | 0 | 0 | 0 | 0 | 0 | 0 | 0 | 0 | 0 | 0.00% |
| Plus Reclassified Fixed Costs | 0 | 0 | 0 | 0 | 0 | 0 | 0 | 0 | 0 | 0 | 0 | 0 | 0 | 0.00% |
| Total Variable Costs | 0 | 0 | 0 | 0 | 0 | 0 | 0 | 0 | 0 | 0 | 0 | 0 | 0 | 0.00% |
| Income from Operations | 233 | 877 | 11137 | 11339 | 11611 | 11811 | 21046 | 21248 | 21150 | 21653 | 21855 | 31057 | 221381 | 97.81% |
| Interest Income (Expense) - "Fixed" | (900) | (881) | (862) | (843) | (824) | (806) | (788) | (770) | (752) | (734) | (716) | (698) | (91674) | −41.84% |
| Income Taxes "Variable" | (461) | (156) | 149 | 750 | 11674 | 11368 | 148 | 147 | 146 | 145 | 144 | 140 | 41203 | 18.37% |
| Net Income After Taxes | (206) | 152 | 126 | (263) | (857) | (330) | 11110 | 11331 | 11552 | 11774 | 11995 | 21219 | 81804 | 37.60% |
| Income from Operations Analysis | ||||||||||||||
| Contribution Margin | 100% | 100% | 100% | 100% | 100% | 100% | 100% | 100% | 100% | 100% | 100% | 100% | 100% | |
| Break-Even Sales Volume | 300 | 0 | 100 | 100 | 0 | 0 | 0 | 0 | 0 | 0 | 0 | 0 | 500 | 2.19% |
| Sales Volume Above Break-Even | 233 | 877 | 11137 | 11339 | 11641 | 11844 | 21046 | 21248 | 21450 | 21653 | 21855 | 31057 | 221381 | 97.81% |
| Net Income After Taxes Analysis | ||||||||||||||
| Contribution Margin % | 186.46 | 117.78 | 87.95 | 47.26 | −1.98 | 25.80 | 92.77 | 93.46 | 94.04 | 94.53 | 94.96 | 95.42 | 81.63 | |
| Break-Even Sales Volume | 322 | 748 | 866 | 11572 | 411537 | 31124 | 849 | 824 | 800 | 776 | 754 | 731 | 111116 | −48.58% |
| Sales Volume Above Break-Even | 855 | 11625 | 21103 | 31011 | 391896 | 41968 | 21896 | 31072 | 31250 | 31429 | 31609 | 31788 | 331997 | 148.58% |
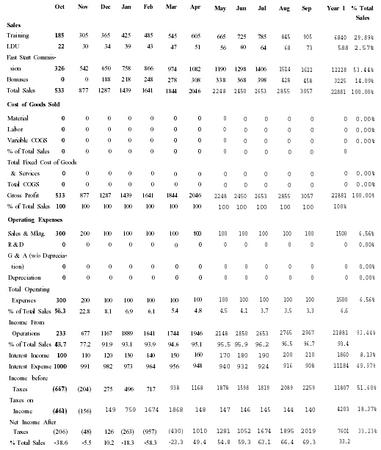
| Income Statement (Year 1 by Month) | |||||||||||||||
| Oct | Nov | Dec | Jan | Feb | Mar | Apr | May | Jun | Jul | Aug | Sep | Year 1 | % Total Sales | ||
| Sales | |||||||||||||||
| Training | 185 | 305 | 365 | 425 | 485 | 545 | 605 | 665 | 725 | 785 | 845 | 905 | 6840 | 29.89% | |
| LDU | 22 | 30 | 34 | 39 | 43 | 47 | 51 | 56 | 60 | 64 | 68 | 73 | 588 | 2.57% | |
| Fast Start Commission | 326 | 542 | 650 | 758 | 866 | 974 | 1082 | 1190 | 1298 | 1406 | 1514 | 1622 | 12228 | 53.44% | |
| Bonuses | 0 | 0 | 188 | 218 | 248 | 278 | 308 | 338 | 368 | 398 | 428 | 458 | 3225 | 14.09% | |
| Total Sales | 533 | 877 | 1287 | 1439 | 1641 | 1844 | 2046 | 2248 | 2450 | 2653 | 2855 | 3057 | 22881 | 100.00% | |
| Cost of Goods Sold | |||||||||||||||
| Material | 0 | 0 | 0 | 0 | 0 | 0 | 0 | 0 | 0 | 0 | 0 | 0 | 0 | 0.00% | |
| Labor | 0 | 0 | 0 | 0 | 0 | 0 | 0 | 0 | 0 | 0 | 0 | 0 | 0 | 0.00% | |
| Variable COGS | 0 | 0 | 0 | 0 | 0 | 0 | 0 | 0 | 0 | 0 | 0 | 0 | 0 | 0.00% | |
| 0 % of Total Sales | 0 | 0 | 0 | 0 | 0 | 0 | 0 | 0 | 0 | 0 | 0 | 0 | 0 | ||
| Total Fixed Cost of Goods & Services | 0 | 0 | 0 | 0 | 0 | 0 | 0 | 0 | 0 | 0 | 0 | 0 | 0 | 0.00% | |
| Total COGS | 0 | 0 | 0 | 0 | 0 | 0 | 0 | 0 | 0 | 0 | 0 | 0 | 0 | 0.00% | |
| Gross Profit | 533 | 877 | 1287 | 1439 | 1641 | 1844 | 2046 | 2248 | 2450 | 2653 | 2855 | 3057 | 22881 | 100.00% | |
| % of Total Sales | 100 | 100 | 100 | 100 | 100 | 100 | 100 | 100 | 100 | 100 | 100 | 100 | 100% | ||
| Operating Expenses | |||||||||||||||
| Sales & Mktg. | 300 | 200 | 100 | 100 | 100 | 100 | 100 | 100 | 100 | 100 | 100 | 100 | 1500 | 6.56% | |
| R & D | 0 | 0 | 0 | 0 | 0 | 0 | 0 | 0 | 0 | 0 | 0 | 0 | 0 | 0.00% | |
| G & A (w/o Depreciation) | 0 | 0 | 0 | 0 | 0 | 0 | 0 | 0 | 0 | 0 | 0 | 0 | 0 | 0.00% | |
| Depreciation | 0 | 0 | 0 | 0 | 0 | 0 | 0 | 0 | 0 | 0 | 0 | 0 | 0 | 0.00% | |
| Total Operating Expenses | 300 | 200 | 100 | 100 | 100 | 100 | 100 | 100 | 100 | 100 | 100 | 100 | 1500 | 6.56% | |
| % of Total Sales | 56.3 | 22.8 | 8.1 | 6.9 | 6.1 | 5.4 | 4.8 | 4.5 | 4.1 | 3.7 | 3.5 | 3.3 | 6.6 | ||
| Income From Operations | 233 | 677 | 1167 | 1889 | 1641 | 1744 | 1946 | 2148 | 2850 | 2653 | 2765 | 2967 | 21881 | 93.44% | |
| % of Total Sales | 43.7 | 77.2 | 91.9 | 93.1 | 93.9 | 94.6 | 95.1 | 95.5 | 95.9 | 96.2 | 96.5 | 96.7 | 93.4 | ||
| Interest Income | 100 | 110 | 120 | 130 | 140 | 150 | 160 | 170 | 180 | 190 | 200 | 210 | 1860 | 8.13% | |
| Interest Expense | 1000 | 991 | 982 | 973 | 964 | 956 | 948 | 940 | 932 | 924 | 916 | 908 | 11184 | 49.97% | |
| Income before Taxes | (667) | (204) | 275 | 496 | 717 | 938 | 1168 | 1878 | 1598 | 1819 | 2089 | 2259 | 11807 | 51.60% | |
| Taxes on Income | (461) | (156) | 149 | 759 | 1674 | 1868 | 148 | 147 | 146 | 145 | 144 | 140 | 4203 | 18.37% | |
| Net Income After Taxes | (206) | (48) | 126 | (263) | (957) | (430) | 1010 | 1281 | 1052 | 1674 | 1895 | 2019 | 7601 | 33.23% | |
| % Total Sales | −38.6 | −5.5 | 10.2 | −18.3 | −58.3 | −23.3 | 49.4 | 54.8 | 59.3 | 63.1 | 66.4 | 69.3 | 33.2 | ||
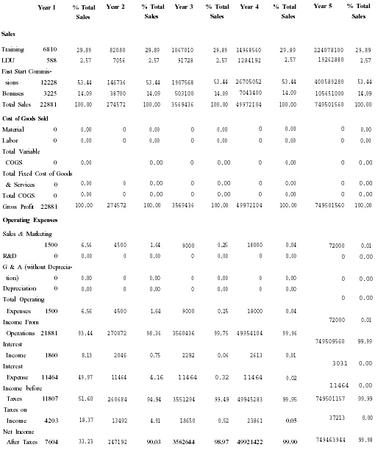
| Income Statement (Years 1 - 5) | |||||||||||
| Year 1 | % Total Sales | Year 2 | % Total Sales | Year 3 | % Total Sales | Year 4 | % Total Sales | Year 5 | % Total Sales | ||
| Sales | |||||||||||
| Training | 6810 | 29.89 | 82080 | 29.89 | 1067010 | 29.89 | 14968560 | 29.89 | 224078100 | 29.89 | |
| LDU | 588 | 2.57 | 7056 | 2.57 | 91728 | 2.57 | 1284192 | 2.57 | 19262880 | 2.57 | |
| Fast Start Commissions | 12228 | 53.44 | 146736 | 53.44 | 1907568 | 53.44 | 26705052 | 53.44 | 400589280 | 53.44 | |
| Bonuses | 3225 | 14.09 | 38700 | 14.09 | 503100 | 14.09 | 7043400 | 14.09 | 105651000 | 14.09 | |
| Total Sales | 22881 | 100.00 | 274572 | 100.00 | 3569436 | 100.00 | 49972104 | 100.00 | 749501560 | 100.00 | |
| Cost of Goods Sold | |||||||||||
| Material | 0 | 0.00 | 0 | 0.00 | 0 | 0.00 | 0 | 0.00 | 0 | 0.00 | |
| Labor | 0 | 0.00 | 0 | 0.00 | 0 | 0.00 | 0 | 0.00 | 0 | 0.00 | |
| Total Variable COGS | 0 | 0.00 | 0 | 0.00 | 0 | 0.00 | 0 | 0.00 | 0 | 0.00 | |
| Total Fixed Cost of Goods & Services | 0 | 0.00 | 0 | 0.00 | 0 | 0.00 | 0 | 0.00 | 0 | 0.00 | |
| Total COGS | 0 | 0.00 | 0 | 0.00 | 0 | 0.00 | 0 | 0.00 | 0 | 0.00 | |
| Gross Profit | 22881 | 100.00 | 274572 | 100.00 | 3569436 | 100.00 | 49972104 | 100.00 | 749501560 | 100.00 | |
| Operating Expenses | |||||||||||
| Sales & Marketing | 1500 | 6.56 | 4500 | 1.64 | 9000 | 0.25 | 18000 | 0.04 | 72000 | 0.01 | |
| R&D | 0 | 0.00 | 0 | 0.00 | 0 | 0.00 | 0 | 0.00 | 0 | 0.00 | |
| G & A (without Depreciation) | 0 | 0.00 | 0 | 0.00 | 0 | 0.00 | 0 | 0.00 | 0 | 0.00 | |
| Depreciation | 0 | 0.00 | 0 | 0.00 | 0 | 0.00 | 0 | 0.00 | 0 | 0.00 | |
| Total Operating Expenses | 1500 | 6.56 | 4500 | 1.64 | 9000 | 0.25 | 18000 | 0.04 | 72000 | 0.01 | |
| Income From Operations | 21881 | 93.44 | 270072 | 98.36 | 3560436 | 99.75 | 49954104 | 99.96 | 749509560 | 99.99 | |
| Interest Income | 1860 | 8.13 | 2046 | 0.75 | 2292 | 0.06 | 2613 | 0.01 | 3031 | 0.00 | |
| Interest Expense | 11464 | 49.97 | 11464 | 4.16 | 11464 | 0.32 | 11464 | 0.02 | 11464 | 0.00 | |
| Income before Taxes | 11807 | 51.60 | 260684 | 94.94 | 3551294 | 99.49 | 49945283 | 99.95 | 749501157 | 99.99 | |
| Taxes on Income | 4203 | 18.37 | 13492 | 4.91 | 18650 | 0.52 | 23861 | 0.05 | 37213 | 0.00 | |
| Net Income After Taxes | 7604 | 33.23 | 247192 | 90.03 | 3562644 | 98.97 | 49921422 | 99.90 | 749463944 | 99.98 | |
Cash Flows
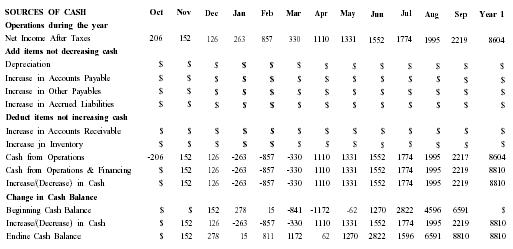
| Statement of Changes in Financial Position: Year 1 by Month | |||||||||||||
| SOURCES OF CASH | Oct | Nov | Dec | Jan | Feb | Mar | Apr | May | Jun | Jul | Aug | Sep | Year 1 |
| Operations during the year | |||||||||||||
| Net Income After Taxes | 206 | 152 | 126 | 263 | 857 | 330 | 1110 | 1331 | 1552 | 1774 | 1995 | 2219 | 8604 |
| Add items not decreasing cash | |||||||||||||
| Depreciation | $ | $ | $ | $ | $ | $ | $ | $ | $ | $ | $ | $ | $ |
| Increase in Accounts Payable | $ | $ | $ | $ | $ | $ | $ | $ | $ | $ | $ | $ | $ |
| Increase in Other Payables | $ | $ | $ | $ | $ | $ | $ | $ | $ | $ | $ | $ | $ |
| Increase in Accrued Liabilities | $ | $ | $ | $ | $ | $ | $ | $ | $ | $ | $ | $ | $ |
| Deduct items not increasing cash | |||||||||||||
| Increase in Accounts Receivable | $ | $ | $ | $ | $ | $ | $ | $ | $ | $ | $ | $ | $ |
| Increase in Inventory | $ | $ | $ | $ | $ | $ | $ | $ | $ | $ | $ | $ | $ |
| Cash from Operations | −206 | 152 | 126 | −263 | −857 | −330 | 1110 | 1331 | 1552 | 1774 | 1995 | 221? | 8604 |
| Cash from Operations & Financing | $ | 152 | 126 | −263 | −857 | −330 | 1110 | 1331 | 1552 | 1774 | 1995 | 2219 | 8810 |
| Increase/(Decrease) in Cash | $ | 152 | 126 | −263 | −857 | −330 | 1110 | 1331 | 1552 | 1774 | 1995 | 2219 | 8810 |
| Change in Cash Balance | |||||||||||||
| Beginning Cash Balance | $ | $ | 152 | 278 | 15 | −841 | −1172 | −62 | 1270 | 2822 | 4596 | 6591 | $ |
| Increase/(Decrease) in Cash | $ | 152 | 126 | −263 | −857 | −330 | 1110 | 1331 | 1552 | 1774 | 1995 | 2219 | 8810 |
| Endine Cash Balance | $ | 152 | 278 | 15 | 811 | 1172 | 62 | 1270 | 2822 | 1596 | 6591 | 8810 | 8810 |
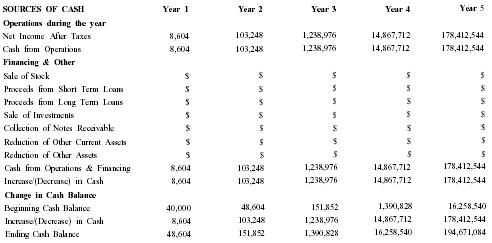
| Statement of Changes in Financial Position: Years 1 - 5 | |||||
| SOURCES OF CASH | Year 1 | Year 2 | Year 3 | Year 4 | Year 5 |
| Operations during the year | |||||
| Net Income After Taxes | 8,604 | 103,248 | 1,238,976 | 14,867,712 | 178,412,544 |
| Cash from Operations | 8,604 | 103,248 | 1,238,976 | 14,867,712 | 178,412,544 |
| Financing & Other | |||||
| Sale of Stock | $ | $ | $ | $ | $ |
| Proceeds from Short Term Loans | $ | $ | $ | $ | $ |
| Proceeds from Long Term Loans | $ | $ | $ | $ | $ |
| Sale of Investments | $ | $ | $ | $ | $ |
| Collection of Notes Receivable | $ | $ | $ | $ | $ |
| Reduction of Other Current Assets | $ | $ | $ | $ | $ |
| Reduction of Other Assets | $ | $ | $ | $ | $ |
| Cash from Operations & Financing | 8,604 | 103,248 | 1,238,976 | 14,867,712 | 178,412,544 |
| Increase/(Decrease) in Cash | 8,604 | 103,248 | 1,238,976 | 14,867,712 | 178,412,544 |
| Change in Cash Balance | |||||
| Beginning Cash Balance | 40,000 | 48,604 | 151,852 | 1,390,828 | 16,258,540 |
| Increase/(Decrease) in Cash | 8,604 | 103,248 | 1,238,976 | 14,867,712 | 178,412,544 |
| Ending Cash Balance | 48,604 | 151,852 | 1,390,828 | 16,258,540 | 194,671,084 |
CONCLUSION
RFM Enterprises enjoys an established track-record of excellent service for our customers in a very short existence. Their expressions of satisfaction and encouragement are numerous, and we intend to continue our advances and growth in the long distance market with more unique and effective products and services.
Comment about this article, ask questions, or add new information about this topic: