Grocery Store

BUSINESS PLAN VIKING GROCERY STORES
3816 South Johnson Street
Springfield, Missouri 65802
This business plan is prepared to obtain joint financing in the amount of $2,746,000, to begin work on site preparation and modifications, purchase equipment, and to cover expenses in the first year of operations. We are seeking joint financing from our local Economic Development Fund.
- EXECUTIVE SUMMARY
- COMPANY SUMMARY
- PRODUCTS
- MARKET ANALYSIS SUMMARY
- STRATEGY & IMPLEMENTATION SUMMARY
- MANAGEMENT SUMMARY
- FINANCIAL PLAN
- APPENDIX
EXECUTIVE SUMMARY
Viking Grocery Stores–Springfield, will be located in the old Lloyd building, located at 3816 South Johnson Street, in the heart of Springfield, Missouri. This business plan is prepared to obtain joint financing in the amount of $2,746,000, to begin work on site preparation and modifications, purchase equipment, and to cover expenses in the first year of operations. We are seeking joint financing from our local Economic Development Fund.
Viking Stores–Springfield, will be incorporated initially as a corporation. This will shield the owners and all other investors from issues of personal liability. The investors will be treated as shareholders and therefore will not be liable for more than their personal investment. Owner Jones Stewart will contribute $70,000 ($20,000 in sweat equity and $50,000 in cash) towards this business venture.
The financing, in addition to the capital contributions from the owner and shareholders, will allow our store to successfully open and maintain operations through the year. A large initial capital investment will allow our store to provide its customers with a fully featured grocery store. A unique, upscale, and innovative environment is required to provide the customer with an atmosphere that will inspire continued use. The successful operation of year one will provide our store with customers that will allow it to be self-sufficient in year two.
The Viking Store concept, as shown in our plan, has an excellent profitability level and growth rate. Our competitive edge, along with new retail techniques and technology, puts our store in the forefront of the retailing of perishable and nonperishable consumer goods. We are living in an age where unique grocery store environments are in great demand. Our store will differ from the traditional grocery store because of our added personal touch.
Objectives
As a leading wholesale distributor, our commitment is to provide quality products and services in a cost-effective manner, enabling Viking retailers to excel in serving their customers. If you're interested in being supplied by Viking Stores, Inc., the initial, minimum objectives are:
- A clean environment in which to shop
- A safe place to shop
- Value
- Great, friendly service
- Our shop will be good neighbors and will be involved in the community
- Our store will be at least 25,000 square feet
- Store will have minimum weekly retail sales of $75,000 which is equivalent to approximately $35,000 of purchases weekly at the wholesale level
- Generate capital by leasing remaining space to two other business tenants
Mission
Our most fundamental philosophy is the concern for people. This strong belief in people is the determining factor that motivates our operations in developing our relationship with our employees and customers.
We believe that our responsibility for customer satisfaction is not focused solely on the sale of a product, but rather is the total relationship a customer experiences when interacting with our organization. We believe in honesty and truth in all transactions and in providing products of the highest quality and at fair prices. We should do everything possible to provide outstanding service in marketing the products we sell.
Our philosophy of concern for people gives our Viking Store the drive to be a good corporate citizen. We believe we have a responsibility to be a good neighbor in maintaining our property in first-class condition and by making the appearance of our plant, facilities, equipment, and grounds as attractive as possible, making them an asset to the communities that support our company.
We at Viking Store of Springfield, are committed to bringing you the best all-around shopping experience. Our nice pledge campaign includes an intense training session for all of our employees, and a firm understanding and commitment to deliver these pledge points at the Viking Store in Springfield, Missouri.
Advantage of Selling Viking Brands
- Viking Stores' commitment to quality over the years has strengthened the integrity of the Viking brand. Most private labels can't hold a candle to the quality of Viking products.
- Viking Stores, Inc., regularly evaluates and audits the Viking product mix to keep variety consistent with consumer wants and needs.
- An extensive line of over 2,000 Viking products can be sold throughout your store— from the produce department to the health and beauty care aisle.
- An overwhelming acceptance of products bearing the Viking name has made this brand one of the top sellers in the Midwest. An established loyalty among customers keeps them buying Viking brands.
- Offers customers a double-your-money-back guarantee which encourages them to buy with confidence.
- Allows the retail store to be part of a community contribution program. This program also promotes loyalty for Viking brand products.
COMPANY SUMMARY
Viking Grocery Stores–Springfield will be part of Viking Stores, Inc., a premier regional grocery/drugstore retailer and wholesale distributor based in Kansas City, Missouri. As a result of five acquisitions since 1999, Viking Stores, Inc., now owns and operates 113 supermarkets and 21 drugstores throughout Missouri and Illinois.
Viking Stores, Inc., also distributes more than 40,000 private label and national brand products to more than 325 independently owned grocery stores in Missouri, Illinois, and Arkansas and serves as wholesale distributor to 8,700 convenience stores in nine states throughout the Midwest.
Company History
At the end of 1917, a group of independent grocers discussed forming a cooperative to create buying power for group members. In early 1918, 27 members incorporated the Kansas City Grocery Company, a name it kept until 1954 when the company became Viking Stores, Inc., In 1959, the company produced its first private-label Viking brand product—coffee.
Although the company changed its cooperative status to "for profit status" in the early 1970s, the publicly held company did not become publicly traded on the NASDAQ until August 2000 following Viking Stores' merger with Morgan Food Town in St. Louis, Missouri. For the fiscal year ending March 25, 2000, Viking Stores and Morgan Food Town had combined revenues of $3.8 billion, $1.2 billion of which was retail grocery sales.
Company Ownership
The Viking Store–Springfield will be a corporation. Currently it will be owned and operated by Jones Stewart and his investors.
Location
We have located the ideal location for our operation. Our store will be located at 3816 South Johnson Street, Springfield, Missouri.
This site will contribute to our success due to being formally used as a grocery store.
Also a real estate company, Viking Stores' Market Space Corporation is in business to offer buildings and properties for sale or lease. Their buildings can be converted to meet various business needs and offer prime locations and ample parking. Throughout Missouri, Arkansas, and Illinois, they have existing improved properties as well as outparcels and land for sale. Market Space Corporation can provide demographic information on their locations to expedite any purchase transactions. Leasing is also an option. Both stand-alone buildings and tenant space within buildings where others businesses operate can be leased. Examples would include strip malls housing such operations as dry cleaners, video stores, hair salons, pizza shops, etc.
Hours of Operation
Store hours will be 7 days a week from 10:00 A.M. until 10:00 P.M. Checks and all major credit cards will be accepted. A food stamp policy along with other policies will be in place.
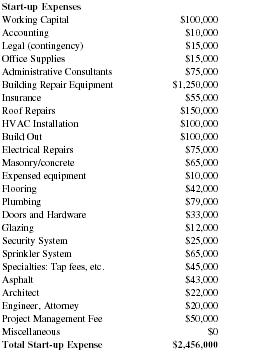
Start-up Summary
Start-up costs will be financed through a combination of owner investment, short-term loans, and long-term borrowing. The start-up chart shows the distribution of financing.
Start-up Plan
| Start-up Expenses | |
| Working Capital | $100,000 |
| Accounting | $10,000 |
| Legal (contingency) | $15,000 |
| Office Supplies | $15,000 |
| Administrative Consultants | $75,000 |
| Building Repair Equipment | $1,250,000 |
| Insurance | $55,000 |
| Roof Repairs | $150,000 |
| HVAC Installation | $100,000 |
| Build Out | $100,000 |
| Electrical Repairs | $75,000 |
| Masonry/concrete | $65,000 |
| Expensed equipment | $10,000 |
| Flooring | $42,000 |
| Plumbing | $79,000 |
| Doors and Hardware | $33,000 |
| Glazing | $12,000 |
| Security System | $25,000 |
| Sprinkler System | $65,000 |
| Specialties: Tap fees, etc. | $45,000 |
| Asphalt | $43,000 |
| Architect | $22,000 |
| Engineer, Attorney | $20,000 |
| Project Management Fee | $50,000 |
| Miscellaneous | $0 |
| Total Start-up Expense | $2,456,000 |
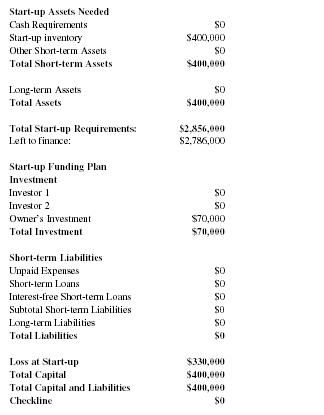
| Start-up Assets Needed | |
| Cash Requirements | $0 |
| Start-up inventory | $400,000 |
| Other Short-term Assets | $0 |
| Total Short-term Assets | $400,000 |
| Long-term Assets | $0 |
| Total Assets | $400,000 |
| Total Start-up Requirements: | $2,856,000 |
| Left to finance: | $2,786,000 |
| Start-up Funding Plan | |
| Investment | |
| Investor 1 | $0 |
| Investor 2 | $0 |
| Owner's Investment | $70,000 |
| Total Investment | $70,000 |
| Short-term Liabilities | |
| Unpaid Expenses | $0 |
| Short-term Loans | $0 |
| Interest-free Short-term Loans | $0 |
| Subtotal Short-term Liabilities | $0 |
| Long-term Liabilities | $0 |
| Total Liabilities | $0 |
| Loss at Start-up | $330,000 |
| Total Capital | $400,000 |
| Total Capital and Liabilities | $400,000 |
| Checkline | $0 |
PRODUCTS
The store will sell over 40,000 private label and national brand products to the community.
MARKET ANALYSIS SUMMARY
By household size, grocery spending ranges from an average of $51 per week in one-person households to $130 per week in households of five or more. Per-person spending is inversely correlated with household size: per-person weekly expenditures are only $23 in households with five or more members but $35 in one-person homes, according to the the Food Marketing Institute.
To make our advertising and printing dollars work their smartest, we need a team that will work its hardest. The Viking Creative Services Department is ready to meet those needs by providing everything from concepts and design to printing and signage. They are experts in the process of creating and printing advertising, brochures, newsletters, business forms, stationery/business cards, P.O.S. materials, screen-printed clothing/merchandise, and weekly 4-color grocery insert mailers/circulars. Whether we need a bag stuffer, a new logo, billboard advertising, radio spots, TV commercials, or a video, their creative and professional team of associates and state-of-the-art printing equipment offer customers high-quality products in a timely and efficient manner.
Market Segmentation
Seventy-three percent of our shoppers are female head of the households, 11 percent are male head of the households, 15 percent are both and 1 percent are other. Household Income: Average weekly household spending ranges from $68 for shoppers earning under $15,000 to $118 for those earning more than $75,000 per year. Spending on groceries at the consumer's primary store also increases with income from $57 per week for those families earning $15,000 or less per year to $95 per week for those earning over $75,000.
Target Market Segment Strategy
Our store will meet the grocery needs of the surrounding neighborhood of female or male head of households earning $15,000 per year or more.
We will reach our consumers by taking full advantage of Viking Stores' single clearinghouse for manufacturers' coupons, Viking and manufacturers' in-ad coupons, and warehouse damage coupons. Our redemption programs will include Viking gift certificates, selling-show vouchers, and mail-in rebates. Other services include the Viking Gift Certificate program, inad coupon redemption, and scan-down service to manufacturers and brokers.
Technology: Electronic Marketing
Viking is committed to keeping up with technology changes, thereby gaining a competitive edge in the marketplace. Computers and other information systems are integrated to provide management information and time-saving tools.
These include:
- E-mail systems
- Standard accounting software
- Computer-based training
Support is always available to answer system and software development questions, or provide programming solutions as new industry developments appear.
To support our retail store(s), electronic marketing allows us to access complete data analysis and marketing services. These services include data storage, strategic planning/consultation, sourcing for card/key tag manufacturing, custom marketing program development, promotions and campaigns, electronic marketing training and education, retailer-specific data analysis, and support of third-party programs.
Promotions
Building store traffic, generating consumer excitement, accelerating sales and profits, and positioning our store competitively in the market will be relatively simplified by the use of the Sales Promotions Department at Vikings. By combining their purchasing programs with trendsetting insight, Viking has created over 100 profit-generating retail promotions each year. Viking retailers select those promotions that best meet their unique marketing needs. Backed by TV spots, circulars, P.O.S. materials, sweepstakes and more, this promotional activity is key to our retail success.
We will also promote our store using information gathered from our Mystery Shopper Program. This program was developed to provide monthly feedback to owners and managers on the status and condition of the stores. The program focuses on these major areas:
- Internal and external store appearance
- Product availability
- Point-of-purchase materials
- Food service
- Uniforms
- Most importantly, the quality of service received at the register
Each store is visited by a mystery shopper once a month, making sure that all shifts are experienced at least twice a year. Employees are eligible to earn cash incentives and top stores are honored with awards quarterly.
In order to portray the professional image that Viking Stores' customers have come to expect, a selection of uniforms are available. Uniform requirements are facilitated with the use of a contracted distribution and laundry service.
Industry Analysis
According to FMI United States regional average weekly household spending in 1999 was fairly equal across regions, with shoppers in the Midwest spending $83; the South, $83; the East, $98; and the West, $92 per week.
As a progressive leader in the food distribution industry, Viking Stores, Inc., based in Kansas City, Missouri, owns and operates 113 supermarkets and drugstores in Missouri and Illinois under the Ames' Markets, Family Supermarkets, Food Fair, Gordon's Markets, Sunshine Markets, and The Bond banners. Under the direction of corporate leadership and a Board of Directors, Viking Stores, Inc., will continue to foster innovation and support and promote growth of the company to ensure its success.
Sales for Viking Stores' retail grocery segment increased 59.1 percent to $148 million during the first quarter of fiscal 2001, reflecting additional sales from the acquisition of 23 Gordon's Markets and three Sunshine Markets in fiscal 2000. Comparable store sales increased approximately 4.4 percent in the first quarter, primarily because of the company's promotional programs and continued emphasis on product-line expansion.
Grocery distribution segment sales for the quarter declined 2.5 percent to $360 million from $369.3 million for fiscal 2000. Convenience store distribution sales also declined 1.8 percent to $211.5 from $215.4 million. Sales declines in both distribution segments were associated principally with the elimination of intercompany sales for Gordon's Markets and Sunshine Markets.
Gross margin for the quarter widened to 13.1 percent from 12.2 percent, reflecting the higher margins associated with the retail grocery operations acquired in fiscal 2000.
"We are very pleased to begin fiscal 2001 with solid profitability," said William Miller, Viking Stores' President and Chief Executive Officer. "Excluding non-recurring items, this represents the second consecutive quarter of earnings improvement. We are very committed to our retail strategy and believe the approach is beginning to show meaningful results. As we continue integrating our retail acquisitions and bring their performance to optimal levels through enriched promotional programs and expanding product lines, we expect financial profitability to accelerate."
Mr. Miller stated, "Earlier this week, St. Louis, Missouri-based Morgan Food Town shareholders approved the previously announced merger with Viking Stores. Our shareholders also approved certain changes to Viking Stores' charter which were necessary to complete the merger. We are very pleased to welcome Morgan Food Town into Viking Stores rapidly growing retail operations. Adding Morgan's 73 supermarkets and deep-discount drugstores more than doubles our retail store base to 113, gives us a well respected regional name, and significant presence in the greater St. Louis market. The merger represents a significant step forward in our strategic plan to become a major regional retail grocery operator."
Competition
Marketed at a lower shelf price than national brands, Viking brand products give Viking retailers a competitive advantage. Viking Stores backs Viking brands with year-round promotional support including a big fall and early spring sale.
The store will be in walking distance of area shoppers, whereas the next nearest grocery store is two to three miles from our store location.
STRATEGY & IMPLEMENTATION SUMMARY
Viking will help us grow and develop our store. Building a new store or undergoing expansion can be a tremendous challenge for retailers, especially when trying to run a business at the same time. Viking store development services include everything from securing real estate and financing to construction and decor. It's another area in which Viking helps retailers solidify strong market positions.
In addition to our store will be space available for two other retail establishments.
Competitive Edge
Viking provides a service which helps us manage the information related to our retail business more effectively. Viking Stores, Inc., offers us the complete integration of pricing, promotions, scanning, receiving, and electronic payment systems, including EBT and human resource functions at store and corporate levels. Their commitment to putting retailers in the fast lane with state-of-the-art, point-of-sale technology keeps us on the leading edge.
Sales Strategy
Our store will sell mostly the Viking store brand instead of the national brands. We feel this is a growing trend amongst shoppers.
Purchases of store or lower-priced brands, instead of national brands, decreased with slightly more than one in ten consumers (15 percent) doing so "pretty much every time" they shop— down three percentage points from 1991. Over half of consumers (52 percent) are doing so "every time" or "fairly often" when they shop. Almost one in four (22 percent) of larger households (five or more members) report purchasing store brands "every time" they shop and almost as many (18 percent) with annual incomes under $15,000 said they buy store brands "every time" they shop according to FMI.
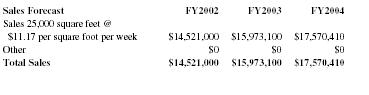
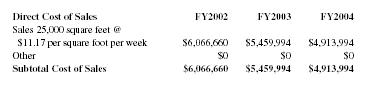
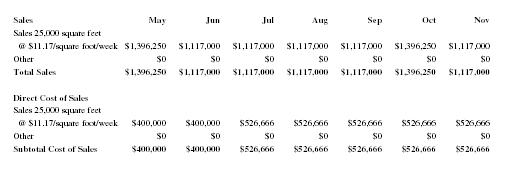
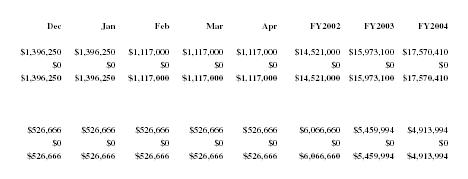
Sales Forecast and Additional Income
The following table gives a run-down on forecasted sales and income. Our sales are based on the industry standard of $11.17 per square foot (store size: 25,000 square feet) for our weekly sales estimate. We expect our sales to grow at least 1 percent per new store brand item added to our product line for a total of 10 percent per year. We also expect to cut cost approximately 10 percent a year through bartering and other means of relationship building.
The remaining 25,000 net square footage not being used for the grocery store will be leased to the public at $4 a square foot.
| Sales Forecast | FY2002 | FY2003 | FY2004 |
| Sales 25,000 square feet @ $11.17 per square foot per week | $14,521,000 | $15,973,100 | $17,570,410 |
| Other | $0 | $0 | $0 |
| Total Sales | $14,521,000 | $15,973,100 | $17,570,410 |
| Direct Cost of Sales | FY2002 | FY2003 | FY2004 |
| Sales 25,000 square feet @ $11.17 per square foot per week | $6,066,660 | $5,459,994 | $4,913,994 |
| Other | $0 | $0 | $0 |
| Subtotal Cost of Sales | $6,066,660 | $5,459,994 | $4,913,994 |
Warehousing and Transportation
Purchasing from suppliers throughout the world, Viking Stores warehouses over 40,000 products in St. Louis, Illinois, Kansas City, and Tulsa, Oklahoma. Supplying nearly 500 stores with these quality products at the lowest cost can only be achieved through a proficient distribution system. Viking Stores' state-of-the-art facilities combine manual labor with mechanical technology for optimum efficiency. Viking Stores' streamlined warehouse operations and sophisticated systems expedite product flow and reduce costs in procurement, inventory control and labor.
Today, Viking Stores, Inc., Transportation has two locations, one based in Kansas City, the other in Tulsa. Its combined fleet of 245 full-time drivers travel over 12.5 million miles per year. They utilize 116 tractors, 193 dry van trailers, and 176 refrigerated trailers. In a typical week, they average 2,397 delivery stops, delivering between 28 and 33 million pounds of product. Viking Stores' routing department builds 1,234 truckloads of product per week with an average load size of 25,000-28,000 pounds. Viking Stores Transportation utilizes the latest computer technology including the TRUCKS Routing System, CADEC on-board computers, and the Maintenance Control and Management System.
Much has changed over the years in the transportation system at Viking Stores including the fleet design, safety, and performance of the vehicles used in transporting product. Associated Markets' trucks of the 1940s, not much more than delivery vans, used to service the company's customers. For years, Viking used Delivery Line to carry its groceries, while it had its own drivers (about 20 in 1965) to haul perishables. The truck used was an early 1950s model with a 30-foot trailer.
Viking started its own transportation department in 1967, the same year that many Delivery drivers lost their jobs during a labor dispute. Viking hired many of these drivers. Four people in routing, two in dispatch, and 75 drivers hit the road. The Viking tractor/trailer (40-footer) was one of the first owned outright by Viking Stores.
The trailer of the 1980s and 1990s was the 50-footer, more than twice the size of the Associated Market's trucks of the 1940s. It was nationally recognized for its safety-conscious design. Viking Stores, Inc., has been praised for having one of the most cost-effective fleets anywhere. In 1989, a complex computer program called TRUCKS was used to organize each and every trailer load of product. It could route 100 loads in less than 5 minutes. Viking Stores' transportation fleet also became involved in backhauling activities.
MANAGEMENT SUMMARY
People are our most valuable asset and Viking Stores' ProActive Consulting Services provides a complete line of human resource services designed to help us develop the greatest potential from our associates. The people we employ are also a major investment in our company. It is their goal to help us fully capitalize on this investment. Viking Stores' staff is highly experienced in the retail supermarket industry and familiar with its unique problems and opportunities.
Our store will hire one Manager, one Assistant Manager, four Cashiers, four Laborers/ Stockers, and four Administrative Workers. Our Store Manager will have a college degree and several years of experience with managing a retail store.
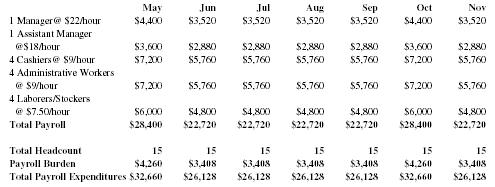
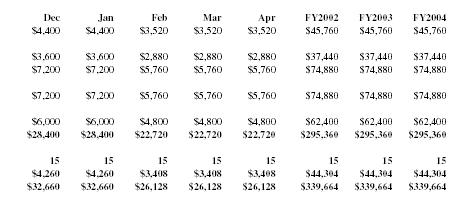
Personnel Plan
The personnel plan is included in the following table. It shows the Manager's hourly pay, followed by that of the rest of the staff. Each of these positions will overlap to make sure the customers are receiving excellent customer service and that adequate help is on hand.
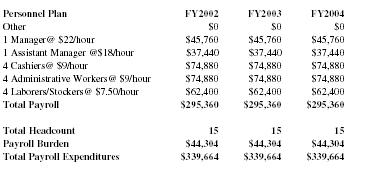
| Personnel Plan | FY2002 | FY2003 | FY2004 |
| Other | $0 | $0 | $0 |
| 1 Manager@ $22/hour | $45,760 | $45,760 | $45,760 |
| 1 Assistant Manager @$18/hour | $37,440 | $37,440 | $37,440 |
| 4 Cashiers@ $9/hour | $74,880 | $74,880 | $74,880 |
| 4 Administrative Workers@ $9/hour | $74,880 | $74,880 | $74,880 |
| 4 Laborers/Stockers@ $7.50/hour | $62,400 | $62,400 | $62,400 |
| Total Payroll | $295,360 | $295,360 | $295,360 |
| Total Headcount | 15 | 15 | 15 |
| Payroll Burden | $44,304 | $44,304 | $44,304 |
| Total Payroll Expenditures | $339,664 | $339,664 | $339,664 |
FINANCIAL PLAN
Viking stores prides itself on being in touch with the financial side of the business at all times. This starts with our budgeting program that sets sales goals, establishes payroll budgets, and creates criteria for gross margin, shrink, expenses, and profit. Exception reporting directs operations in the right direction, saving time, and measuring results.
We will manage and grow our store with a full range of financial services that include five-year financial planning, business valuations, estate planning, buying/selling a store, and financing assistance. Viking will save us valuable time and money plus the headaches and worry often associated with complex money matters.
From Viking, we will receive a complete portfolio of financial, accounting, and payroll services, including comparative operating statements, bank reconciliations, sales tax returns, payroll tax returns, periodic and operational review, cash flows, break-even analyses, financial projections, wages, taxes, deductions, check printing, and deposit advice. It is these kinds of thorough information and accurate recordkeeping that allow Viking retailers to make sound business decisions for the future.
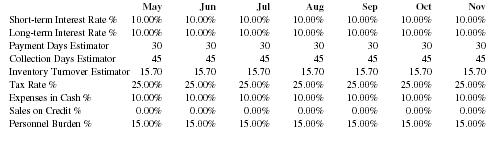
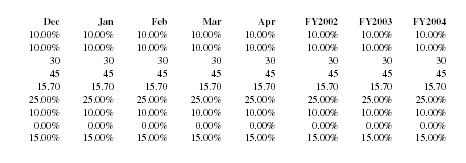
Important Assumptions
We do not sell anything on credit.
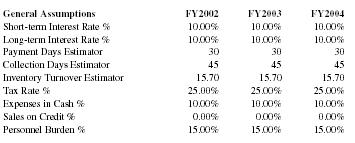
| General Assumptions | FY2002 | FY2003 | FY2004 |
| Short-term Interest Rate % | 10.00% | 10.00% | 10.00% |
| Long-term Interest Rate % | 10.00% | 10.00% | 10.00% |
| Payment Days Estimator | 30 | 30 | 30 |
| Collection Days Estimator | 45 | 45 | 45 |
| Inventory Turnover Estimator | 15.70 | 15.70 | 15.70 |
| Tax Rate % | 25.00% | 25.00% | 25.00% |
| Expenses in Cash % | 10.00% | 10.00% | 10.00% |
| Sales on Credit % | 0.00% | 0.00% | 0.00% |
| Personnel Burden % | 15.00% | 15.00% | 15.00% |
Break-even Analysis
By using a conservative markup of 50 percent, we will have to sell $120,000 worth of goods to break even. A break-even analysis table has been completed on the basis of average costs/ prices.

| Break-even Analysis: | |
| Monthly Units Break-even | 80,000 |
| Monthly Sales Break-even | $80,000 |
| Assumptions: | |
| Average Per-Unit Revenue | $1.00 |
| Average Per-Unit Variable Cost | $0.25 |
| Estimated Monthly Fixed Cost | $60,000 |
Projected Profit and Loss
We predict consulting and accounting costs will go down in the next three years. Normally, a start-up concern will operate with negative profits through the first two years. We will avoid that kind of operating loss by knowing our competitiors and our target markets.
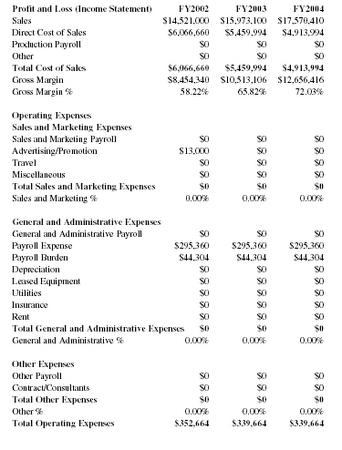
| Profit and Loss (Income Statement) | FY2002 | FY2003 | FY2004 |
| Sales | $14,521,000 | $15,973,100 | $17,570,410 |
| Direct Cost of Sales | $6,066,660 | $5,459,994 | $4,913,994 |
| Production Payroll | $0 | $0 | $0 |
| Other | $0 | $0 | $0 |
| Total Cost of Sales | $6,066,660 | $5,459,994 | $4,913,994 |
| Gross Margin | $8,454,340 | $10,513,106 | $12,656,416 |
| Gross Margin % | 58.22% | 65.82% | 72.03% |
| Operating Expenses | |||
| Sales and Marketing Expenses | |||
| Sales and Marketing Payroll | $0 | $0 | $0 |
| Advertising/Promotion | $13,000 | $0 | $0 |
| Travel | $0 | $0 | $0 |
| Miscellaneous | $0 | $0 | $0 |
| Total Sales and Marketing Expenses | $0 | $0 | $0 |
| Sales and Marketing % | 0.00% | 0.00% | 0.00% |
| General and Administrative Expenses | |||
| General and Administrative Payroll | $0 | $0 | $0 |
| Payroll Expense | $295,360 | $295,360 | $295,360 |
| Payroll Burden | $44,304 | $44,304 | $44,304 |
| Depreciation | $0 | $0 | $0 |
| Leased Equipment | $0 | $0 | $0 |
| Utilities | $0 | $0 | $0 |
| Insurance | $0 | $0 | $0 |
| Rent | $0 | $0 | $0 |
| Total General and Administrative Expenses | $0 | $0 | $0 |
| General and Administrative % | 0.00% | 0.00% | 0.00% |
| Other Expenses | |||
| Other Payroll | $0 | $0 | $0 |
| Contract/Consultants | $0 | $0 | $0 |
| Total Other Expenses | $0 | $0 | $0 |
| Other % | 0.00% | 0.00% | 0.00% |
| Total Operating Expenses | $352,664 | $339,664 | $339,664 |
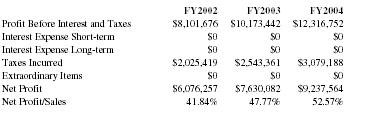
| FY2002 | FY2003 | FY2004 | |
| Profit Before Interest and Taxes | $8,101,676 | $10,173,442 | $12,316,752 |
| Interest Expense Short-term | $0 | $0 | $0 |
| Interest Expense Long-term | $0 | $0 | $0 |
| Taxes Incurred | $2,025,419 | $2,543,361 | $3,079,188 |
| Extraordinary Items | $0 | $0 | $0 |
| Net Profit | $6,076,257 | $7,630,082 | $9,237,564 |
| Net Profit/Sales | 41.84% | 47.77% | 52.57% |
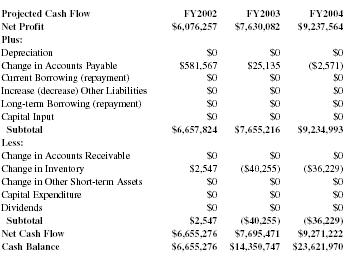
Projected Cash Flow
We are positioning ourselves in the market as a medium risk concern with steady cash flows. Accounts payable is paid at the end of each month while sales are in cash, giving the Viking Store–Springfield an excellent cash structure.
| Projected Cash Flow | FY2002 | FY2003 | FY2004 |
| Net Profit | $6,076,257 | $7,630,082 | $9,237,564 |
| Plus: | |||
| Depreciation | $0 | $0 | $0 |
| Change in Accounts Payable | $581,567 | $25,135 | ($2,571) |
| Current Borrowing (repayment) | $0 | $0 | $0 |
| Increase (decrease) Other Liabilities | $0 | $0 | $0 |
| Long-term Borrowing (repayment) | $0 | $0 | $0 |
| Capital Input | $0 | $0 | $0 |
| Subtotal | $6,657,824 | $7,655,216 | $9,234,993 |
| Less: | |||
| Change in Accounts Receivable | $0 | $0 | $0 |
| Change in Inventory | $2,547 | ($40,255) | ($36,229) |
| Change in Other Short-term Assets | $0 | $0 | $0 |
| Capital Expenditure | $0 | $0 | $0 |
| Dividends | $0 | $0 | $0 |
| Subtotal | $2,547 | ($40,255) | ($36,229) |
| Net Cash Flow | $6,655,276 | $7,695,471 | $9,271,222 |
| Cash Balance | $6,655,276 | $14,350,747 | $23,621,970 |
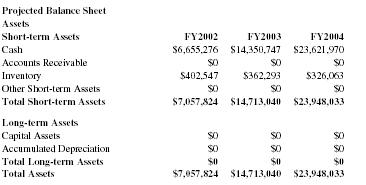
Projected Balance Sheet
All of our tables will be updated monthly to reflect past performance and future assumptions. Future assumptions will not be based on past performance but rather on economic cycle activity, regional industry strength, and future cash flow possibilities. We expect solid growth in net worth beyond the year 2002.
| Projected Balance Sheet | |||
| Assets | |||
| Short-term Assets | FY2002 | FY2003 | FY2004 |
| Cash | $6,655,276 | $14,350,747 | $23,621,970 |
| Accounts Receivable | $0 | $0 | $0 |
| Inventory | $402,547 | $362,293 | $326,063 |
| Other Short-term Assets | $0 | $0 | $0 |
| Total Short-term Assets | $7,057,824 | $14,713,040 | $23,948,033 |
| Long-term Assets | |||
| Capital Assets | $0 | $0 | $0 |
| Accumulated Depreciation | $0 | $0 | $0 |
| Total Long-term Assets | $0 | $0 | $0 |
| Total Assets | $7,057,824 | $14,713,040 | $23,948,033 |

| Liabilities and Capital | FY2002 | FY2003 | FY2004 |
| Accounts Payable | $581,567 | $606,701 | $604,130 |
| Short-term Notes | $0 | $0 | $0 |
| Other Short-term Liabilities | $0 | $0 | $0 |
| Subtotal Short-term Liabilities | $581,567 | $606,701 | $604,130 |
| Long-term Liabilities | $0 | $0 | $0 |
| Total Liabilities | $581,567 | $606,701 | $604,130 |
| Paid in Capital | $70,000 | $70,000 | $70,000 |
| Retained Earnings | $330,000 | $6,406,257 | $14,036,338 |
| Earnings | $6,076,257 | $7,630,082 | $9,237,564 |
| Total Capital | $6,476,257 | $14,106,338 | $23,343,903 |
| Total Liabilities and Capital | $7,057,824 | $14,713,040 | $23,948,033 |
| Net Worth | $6,476,257 | $14,106,338 | $23,343,902 |
APPENDIX
Sales Forecast
| Sales | May | Jun | Jul | Aug | Sep | Oct | Nov |
| Sales 25,000 square feet @ $11.17/square foot/week | $1,396,250 | $1,117,000 | $1,117,000 | $1,117,000 | $1,117,000 | $1,396,250 | $1,117,000 |
| Other | $0 | $0 | $0 | $0 | $0 | $0 | $0 |
| Total Sales | $1,396,250 | $1,117,000 | $1,117,000 | $1,117,000 | $1,117,000 | $1,396,250 | $1,117,000 |
| Direct Cost of Sales | |||||||
| Sales 25,000 square feet @ $11.17/square foot/week | $400,000 | $400,000 | $526,666 | $526,666 | $526,666 | $526,666 | $526,666 |
| Other | $0 | $0 | $0 | $0 | $0 | $0 | $0 |
| Subtotal Cost of Sales | $400,000 | $400,000 | $526,666 | $526,666 | $526,666 | $526,666 | $526,666 |
Personnel Plan
| May | Jun | Jul | Aug | Sep | Oct | Nov | |
| 1 Manager@ $22/hour | $4,400 | $3,520 | $3,520 | $3,520 | $3,520 | $4,400 | $3,520 |
| 1 Assistant Manager @$18/hour | $3,600 | $2,880 | $2,880 | $2,880 | $2,880 | $3,600 | $2,880 |
| 4 Cashiers@ $9/hour | $7,200 | $5,760 | $5,760 | $5,760 | $5,760 | $7,200 | $5,760 |
| 4 Administrative Workers @ $9/hour | $7,200 | $5,760 | $5,760 | $5,760 | $5,760 | $7,200 | $5,760 |
| 4 Laborers/Stockers @ $7.50/hour | $6,000 | $4,800 | $4,800 | $4,800 | $4,800 | $6,000 | $4,800 |
| Total Payroll | $28,400 | $22,720 | $22,720 | $22,720 | $22,720 | $28,400 | $22,720 |
| Total Headcount | 15 | 15 | 15 | 15 | 15 | 15 | 15 |
| Payroll Burden | $4,260 | $3,408 | $3,408 | $3,408 | $3,408 | $4,260 | $3,408 |
| Total Payroll Expenditures | $32,660 | $26,128 | $26,128 | $26,128 | $26,128 | $32,660 | $26,128 |
General Assumptions
| May | Jun | Jul | Aug | Sep | Oct | Nov | |
| Short-term Interest Rate % | 10.00% | 10.00% | 10.00% | 10.00% | 10.00% | 10.00% | 10.00% |
| Long-term Interest Rate % | 10.00% | 10.00% | 10.00% | 10.00% | 10.00% | 10.00% | 10.00% |
| Payment Days Estimator | 30 | 30 | 30 | 30 | 30 | 30 | 30 |
| Collection Days Estimator | 45 | 45 | 45 | 45 | 45 | 45 | 45 |
| Inventory Turnover Estimator | 15.70 | 15.70 | 15.70 | 15.70 | 15.70 | 15.70 | 15.70 |
| Tax Rate % | 25.00% | 25.00% | 25.00% | 25.00% | 25.00% | 25.00% | 25.00% |
| Expenses in Cash % | 10.00% | 10.00% | 10.00% | 10.00% | 10.00% | 10.00% | 10.00% |
| Sales on Credit % | 0.00% | 0.00% | 0.00% | 0.00% | 0.00% | 0.00% | 0.00% |
| Personnel Burden % | 15.00% | 15.00% | 15.00% | 15.00% | 15.00% | 15.00% | 15.00% |
| Dec | Jan | Feb | Mar | Apr | FY2002 | FY2003 | FY2004 |
| $1,396,250 | $1,396,250 | $1,117,000 | $1,117,000 | $1,117,000 | $14,521,000 | $15,973,100 | $17,570,410 |
| $0 | $0 | $0 | $0 | $0 | $0 | $0 | $0 |
| $1,396,250 | $1,396,250 | $1,117,000 | $1,117,000 | $1,117,000 | $14,521,000 | $15,973,100 | $17,570,410 |
| $526,666 | $526,666 | $526,666 | $526,666 | $526,666 | $6,066,660 | $5,459,994 | $4,913,994 |
| $0 | $0 | $0 | $0 | $0 | $0 | $0 | $0 |
| $526,666 | $526,666 | $526,666 | $526,666 | $526,666 | $6,066,660 | $5,459,994 | $4,913,994 |
| Dec | Jan | Feb | Mar | Apr | FY2002 | FY2003 | FY2004 |
| $4,400 | $4,400 | $3,520 | $3,520 | $3,520 | $45,760 | $45,760 | $45,760 |
| $3,600 | $3,600 | $2,880 | $2,880 | $2,880 | $37,440 | $37,440 | $37,440 |
| $7,200 | $7,200 | $5,760 | $5,760 | $5,760 | $74,880 | $74,880 | $74,880 |
| $7,200 | $7,200 | $5,760 | $5,760 | $5,760 | $74,880 | $74,880 | $74,880 |
| $6,000 | $6,000 | $4,800 | $4,800 | $4,800 | $62,400 | $62,400 | $62,400 |
| $28,400 | $28,400 | $22,720 | $22,720 | $22,720 | $295,360 | $295,360 | $295,360 |
| 15 | 15 | 15 | 15 | 15 | 15 | 15 | 15 |
| $4,260 | $4,260 | $3,408 | $3,408 | $3,408 | $44,304 | $44,304 | $44,304 |
| $32,660 | $32,660 | $26,128 | $26,128 | $26,128 | $339,664 | $339,664 | $339,664 |
| Dec | Jan | Feb | Mar | Apr | FY2002 | FY2003 | FY2004 |
| 10.00% | 10.00% | 10.00% | 10.00% | 10.00% | 10.00% | 10.00% | 10.00% |
| 10.00% | 10.00% | 10.00% | 10.00% | 10.00% | 10.00% | 10.00% | 10.00% |
| 30 | 30 | 30 | 30 | 30 | 30 | 30 | 30 |
| 45 | 45 | 45 | 45 | 45 | 45 | 45 | 45 |
| 15.70 | 15.70 | 15.70 | 15.70 | 15.70 | 15.70 | 15.70 | 15.70 |
| 25.00% | 25.00% | 25.00% | 25.00% | 25.00% | 25.00% | 25.00% | 25.00% |
| 10.00% | 10.00% | 10.00% | 10.00% | 10.00% | 10.00% | 10.00% | 10.00% |
| 0.00% | 0.00% | 0.00% | 0.00% | 0.00% | 0.00% | 0.00% | 0.00% |
| 15.00% | 15.00% | 15.00% | 15.00% | 15.00% | 15.00% | 15.00% | 15.00% |
Profit and Loss (Income Statement)
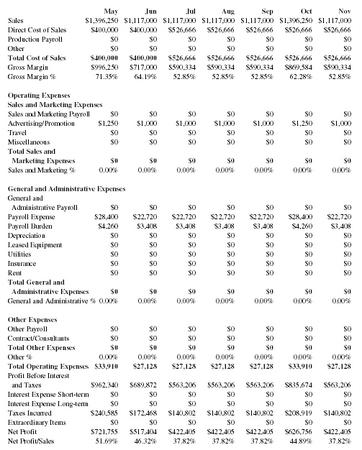
| May | Jun | Jul | Aug | Sep | Oct | Nov | |
| Sales | $1,396,250 | $1,117,000 | $1,117,000 | $1,117,000 | $1,117,000 | $1,396,250 | $1,117,000 |
| Direct Cost of Sales | $400,000 | $400,000 | $526,666 | $526,666 | $526,666 | $526,666 | $526,666 |
| Production Payroll | $0 | $0 | $0 | $0 | $0 | $0 | $0 |
| Other | $0 | $0 | $0 | $0 | $0 | $0 | $0 |
| Total Cost of Sales | $400,000 | $400,000 | $526,666 | $526,666 | $526,666 | $526,666 | $526,666 |
| Gross Margin | $996,250 | $717,000 | $590,334 | $590,334 | $590,334 | $869,584 | $590,334 |
| Gross Margin % | 71.35% | 64.19% | 52.85% | 52.85% | 52.85% | 62.28% | 52.85% |
| Operating Expenses | |||||||
| Sales and Marketing Expenses | |||||||
| Sales and Marketing Payroll | $0 | $0 | $0 | $0 | $0 | $0 | $0 |
| Advertising/Promotion | $1,250 | $1,000 | $1,000 | $1,000 | $1,000 | $1,250 | $1,000 |
| Travel | $0 | $0 | $0 | $0 | $0 | $0 | $0 |
| Miscellaneous | $0 | $0 | $0 | $0 | $0 | $0 | $0 |
| Total Sales and Marketing Expenses | $0 | $0 | $0 | $0 | $0 | $0 | $0 |
| Sales and Marketing % | 0.00% | 0.00% | 0.00% | 0.00% | 0.00% | 0.00% | 0.00% |
| General and Administrative Expenses | |||||||
| General and Administrative Payroll | $0 | $0 | $0 | $0 | $0 | $0 | $0 |
| Payroll Expense | $28,400 | $22,720 | $22,720 | $22,720 | $22,720 | $28,400 | $22,720 |
| Payroll Burden | $4,260 | $3,408 | $3,408 | $3,408 | $3,408 | $4,260 | $3,408 |
| Depreciation | $0 | $0 | $0 | $0 | $0 | $0 | $0 |
| Leased Equipment | $0 | $0 | $0 | $0 | $0 | $0 | $0 |
| Utilities | $0 | $0 | $0 | $0 | $0 | $0 | $0 |
| Insurance | $0 | $0 | $0 | $0 | $0 | $0 | $0 |
| Rent | $0 | $0 | $0 | $0 | $0 | $0 | $0 |
| Total General and Administrative Expenses | $0 | $0 | $0 | $0 | $0 | $0 | $0 |
| General and Administrative % | 0.00% | 0.00% | 0.00% | 0.00% | 0.00% | 0.00% | 0.00% |
| Other Expenses | |||||||
| Other Payroll | $0 | $0 | $0 | $0 | $0 | $0 | $0 |
| Contract/Consultants | $0 | $0 | $0 | $0 | $0 | $0 | $0 |
| Total Other Expenses | $0 | $0 | $0 | $0 | $0 | $0 | $0 |
| Other % | 0.00% | 0.00% | 0.00% | 0.00% | 0.00% | 0.00% | 0.00% |
| Total Operating Expenses | $33,910 | $27,128 | $27,128 | $27,128 | $27,128 | $33,910 | $27,128 |
| Profit Before Interest and Taxes | $962,340 | $689,872 | $563,206 | $563,206 | $563,206 | $835,674 | $563,206 |
| Interest Expense Short-term | $0 | $0 | $0 | $0 | $0 | $0 | $0 |
| Interest Expense Long-term | $0 | $0 | $0 | $0 | $0 | $0 | $0 |
| Taxes Incurred | $240,585 | $172,468 | $140,802 | $140,802 | $140,802 | $208,919 | $140,802 |
| Extraordinary Items | $0 | $0 | $0 | $0 | $0 | $0 | $0 |
| Net Profit | $721,755 | $517,404 | $422,405 | $422,405 | $422,405 | $626,756 | $422,405 |
| Net Profit/Sales | 51.69% | 46.32% | 37.82% | 37.82% | 37.82% | 44.89% | 37.82% |
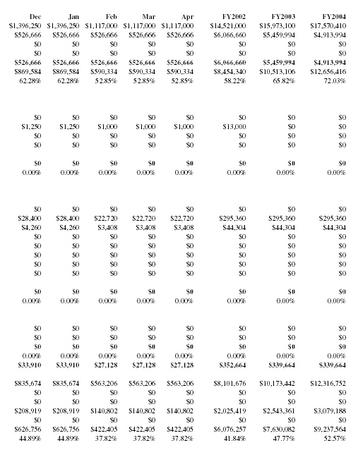
| Dec | Jan | Feb | Mar | Apr | FY2002 | FY2003 | FY2004 |
| $1,396,250 | $1,396,250 | $1,117,000 | $1,117,000 | $1,117,000 | $14,521,000 | $15,973,100 | $17,570,410 |
| $526,666 | $526,666 | $526,666 | $526,666 | $526,666 | $6,066,660 | $5,459,994 | $4,913,994 |
| $0 | $0 | $0 | $0 | $0 | $0 | $0 | $0 |
| $0 | $0 | $0 | $0 | $0 | $0 | $0 | $0 |
| $526,666 | $526,666 | $526,666 | $526,666 | $526,666 | $6,066,660 | $5,459,994 | $4,913,994 |
| $869,584 | $869,584 | $590,334 | $590,334 | $590,334 | $8,454,340 | $10,513,106 | $12,656,416 |
| 62.28% | 62.28% | 52.85% | 52.85% | 52.85% | 58.22% | 65.82% | 72.03% |
| $0 | $0 | $0 | $0 | $0 | $0 | $0 | $0 |
| $1,250 | $1,250 | $1,000 | $1,000 | $1,000 | $13,000 | $0 | $0 |
| $0 | $0 | $0 | $0 | $0 | $0 | $0 | $0 |
| $0 | $0 | $0 | $0 | $0 | $0 | $0 | $0 |
| $0 | $0 | $0 | $0 | $0 | $0 | $0 | $0 |
| 0.00% | 0.00% | 0.00% | 0.00% | 0.00% | 0.00% | 0.00% | 0.00% |
| $0 | $0 | $0 | $0 | $0 | $0 | $0 | $0 |
| $28,400 | $28,400 | $22,720 | $22,720 | $22,720 | $295,360 | $295,360 | $295,360 |
| $4,260 | $4,260 | $3,408 | $3,408 | $3,408 | $44,304 | $44,304 | $44,304 |
| $0 | $0 | $0 | $0 | $0 | $0 | $0 | $0 |
| $0 | $0 | $0 | $0 | $0 | $0 | $0 | $0 |
| $0 | $0 | $0 | $0 | $0 | $0 | $0 | $0 |
| $0 | $0 | $0 | $0 | $0 | $0 | $0 | $0 |
| $0 | $0 | $0 | $0 | $0 | $0 | $0 | $0 |
| $0 | $0 | $0 | $0 | $0 | $0 | $0 | $0 |
| 0.00% | 0.00% | 0.00% | 0.00% | 0.00% | 0.00% | 0.00% | 0.00% |
| $0 | $0 | $0 | $0 | $0 | $0 | $0 | $0 |
| $0 | $0 | $0 | $0 | $0 | $0 | $0 | $0 |
| $0 | $0 | $0 | $0 | $0 | $0 | $0 | $0 |
| 0.00% | 0.00% | 0.00% | 0.00% | 0.00% | 0.00% | 0.00% | 0.00% |
| $33,910 | $33,910 | $27,128 | $27,128 | $27,128 | $352,664 | $339,664 | $339,664 |
| $835,674 | $835,674 | $563,206 | $563,206 | $563,206 | $8,101,676 | $10,173,442 | $12,316,752 |
| $0 | $0 | $0 | $0 | $0 | $0 | $0 | $0 |
| $0 | $0 | $0 | $0 | $0 | $0 | $0 | $0 |
| $208,919 | $208,919 | $140,802 | $140,802 | $140,802 | $2,025,419 | $2,543,361 | $3,079,188 |
| $0 | $0 | $0 | $0 | $0 | $0 | $0 | $0 |
| $626,756 | $626,756 | $422,405 | $422,405 | $422,405 | $6,076,257 | $7,630,082 | $9,237,564 |
| 44.89% | 44.89% | 37.82% | 37.82% | 37.82% | 41.84% | 47.77% | 52.57% |
Projected Cash Flow
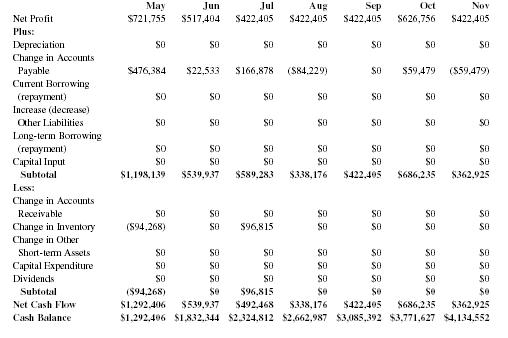
| May | Jun | Jul | Aug | Sep | Oct | Nov | |
| Net Profit | $721,755 | $517,404 | $422,405 | $422,405 | $422,405 | $626,756 | $422,405 |
| Plus: | |||||||
| Depreciation | $0 | $0 | $0 | $0 | $0 | $0 | $0 |
| Change in Accounts Payable | $476,384 | $22,533 | $166,878 | ($84,229) | $0 | $59,479 | ($59,479) |
| Current Borrowing (repayment) | $0 | $0 | $0 | $0 | $0 | $0 | $0 |
| Increase (decrease) Other Liabilities | $0 | $0 | $0 | $0 | $0 | $0 | $0 |
| Long-term Borrowing (repayment) | $0 | $0 | $0 | $0 | $0 | $0 | $0 |
| Capital Input | $0 | $0 | $0 | $0 | $0 | $0 | $0 |
| Subtotal | $1,198,139 | $539,937 | $589,283 | $338,176 | $422,405 | $686,235 | $362,925 |
| Less: | |||||||
| Change in Accounts Receivable | $0 | $0 | $0 | $0 | $0 | $0 | $0 |
| Change in Inventory | ($94,268) | $0 | $96,815 | $0 | $0 | $0 | $0 |
| Change in Other Short-term Assets | $0 | $0 | $0 | $0 | $0 | $0 | $0 |
| Capital Expenditure | $0 | $0 | $0 | $0 | $0 | $0 | $0 |
| Dividends | $0 | $0 | $0 | $0 | $0 | $0 | $0 |
| Subtotal | ($94,268) | $0 | $96,815 | $0 | $0 | $0 | $0 |
| Net Cash Flow | $1,292,406 | $539,937 | $492,468 | $338,176 | $422,405 | $686,235 | $362,925 |
| Cash Balance | $1,292,406 | $1,832,344 | $2,324,812 | $2,662,987 | $3,085,392 | $3,771,627 | $4,134,552 |
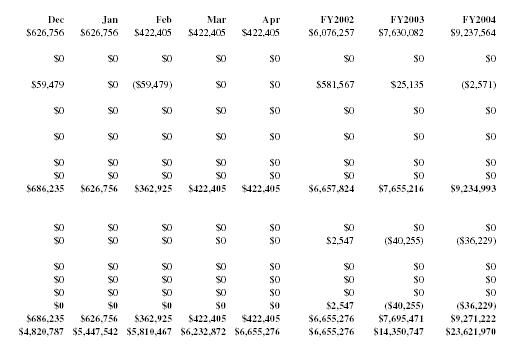
| Dec | Jan | Feb | Mar | Apr | FY2002 | FY2003 | FY2004 |
| $626,756 | $626,756 | $422,405 | $422,405 | $422,405 | $6,076,257 | $7,630,082 | $9,237,564 |
| $0 | $0 | $0 | $0 | $0 | $0 | $0 $0 | |
| $59,479 | $0 | ($59,479) | $0 | $0 | $581,567 | $25,135 | ($2,571) |
| $0 | $0 | $0 | $0 | $0 | $0 | $0 $0 | |
| $0 | $0 | $0 | $0 | $0 | $0 | $0 $0 | |
| $0 | $0 | $0 | $0 | $0 | $0 | $0 $0 | |
| $0 | $0 | $0 | $0 | $0 | $0 | $0 $0 | |
| $686,235 | $626,756 | $362,925 | $422,405 | $422,405 | $6,657,824 | $7,655,216 | $9,234,993 |
| $0 | $0 | $0 | $0 | $0 | $0 | $0 $0 | |
| $0 | $0 | $0 | $0 | $0 | $2,547 | ($40,255) | ($36,229) |
| $0 | $0 | $0 | $0 | $0 | $0 | $0 $0 | |
| $0 | $0 | $0 | $0 | $0 | $0 | $0 $0 | |
| $0 | $0 | $0 | $0 | $0 | $0 | $0 $0 | |
| $0 | $0 | $0 | $0 | $0 | $2,547 | ($40,255) | ($36,229) |
| $686,235 | $626,756 | $362,925 | $422,405 | $422,405 | $6,655,276 | $7,695,471 | $9,271,222 |
| $4,820,787 | $5,447,542 | $5,810,467 | $6,232,872 | $6,655,276 | $6,655,276 | $14,350,747 | $23,621,970 |
Projected Balance Sheet
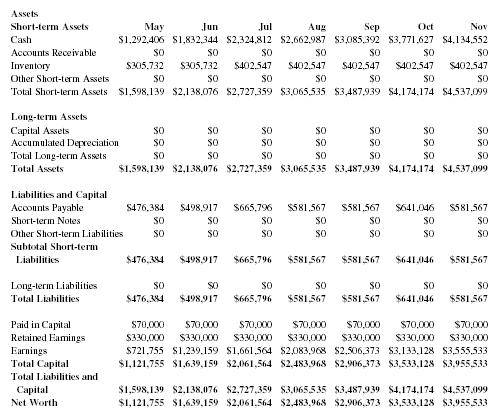
| Assets | |||||||
| Short-term Assets | May | Jun | Jul | Aug | Sep | Oct | Nov |
| Cash | $1,292,406 | $1,832,344 | $2,324,812 | $2,662,987 | $3,085,392 | $3,771,627 | $4,134,552 |
| Accounts Receivable | $0 | $0 | $0 | $0 | $0 | $0 | $0 |
| Inventory | $305,732 | $305,732 | $402,547 | $402,547 | $402,547 | $402,547 | $402,547 |
| Other Short-term Assets | $0 | $0 | $0 | $0 | $0 | $0 | $0 |
| Total Short-term Assets | $1,598,139 | $2,138,076 | $2,727,359 | $3,065,535 | $3,487,939 | $4,174,174 | $4,537,099 |
| Long-term Assets | |||||||
| Capital Assets | $0 | $0 | $0 | $0 | $0 | $0 | $0 |
| Accumulated Depreciation | $0 | $0 | $0 | $0 | $0 | $0 | $0 |
| Total Long-term Assets | $0 | $0 | $0 | $0 | $0 | $0 | $0 |
| Total Assets | $1,598,139 | $2,138,076 | $2,727,359 | $3,065,535 | $3,487,939 | $4,174,174 | $4,537,099 |
| Liabilities and Capital | |||||||
| Accounts Payable | $476,384 | $498,917 | $665,796 | $581,567 | $581,567 | $641,046 | $581,567 |
| Short-term Notes | $0 | $0 | $0 | $0 | $0 | $0 | $0 |
| Other Short-term Liabilities | $0 | $0 | $0 | $0 | $0 | $0 | $0 |
| Subtotal Short-term Liabilities | $476,384 | $498,917 | $665,796 | $581,567 | $581,567 | $641,046 | $581,567 |
| Long-term Liabilities | $0 | $0 | $0 | $0 | $0 | $0 | $0 |
| Total Liabilities | $476,384 | $498,917 | $665,796 | $581,567 | $581,567 | $641,046 | $581,567 |
| Paid in Capital | $70,000 | $70,000 | $70,000 | $70,000 | $70,000 | $70,000 | $70,000 |
| Retained Earnings | $330,000 | $330,000 | $330,000 | $330,000 | $330,000 | $330,000 | $330,000 |
| Earnings | $721,755 | $1,239,159 | $1,661,564 | $2,083,968 | $2,506,373 | $3,133,128 | $3,555,533 |
| Total Capital | $1,121,755 | $1,639,159 | $2,061,564 | $2,483,968 | $2,906,373 | $3,533,128 | $3,955,533 |
| Total Liabilities and Capital | $1,598,139 | $2,138,076 | $2,727,359 | $3,065,535 | $3,487,939 | $4,174,174 | $4,537,099 |
| Net Worth | $1,121,755 | $1,639,159 | $2,061,564 | $2,483,968 | $2,906,373 | $3,533,128 | $3,955,533 |
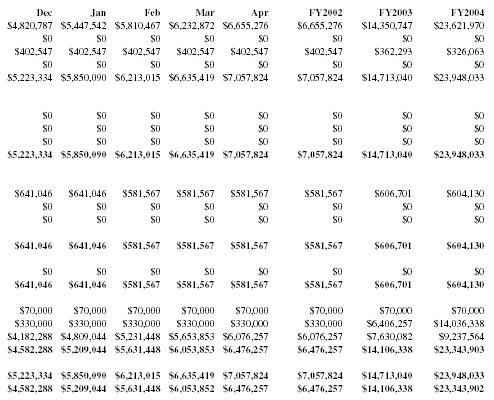
| Dec | Jan | Feb | Mar | Apr | FY2002 | FY2003 | FY2004 |
| $4,820,787 | $5,447,542 | $5,810,467 | $6,232,872 | $6,655,276 | $6,655,276 | $14,350,747 | $23,621,970 |
| $0 | $0 | $0 | $0 | $0 | $0 | $0 | $0 |
| $402,547 | $402,547 | $402,547 | $402,547 | $402,547 | $402,547 | $362,293 | $326,063 |
| $0 | $0 | $0 | $0 | $0 | $0 | $0 | $0 |
| $5,223,334 | $5,850,090 | $6,213,015 | $6,635,419 | $7,057,824 | $7,057,824 | $14,713,040 | $23,948,033 |
| $0 | $0 | $0 | $0 | $0 | $0 | $0 | $0 |
| $0 | $0 | $0 | $0 | $0 | $0 | $0 | $0 |
| $0 | $0 | $0 | $0 | $0 | $0 | $0 | $0 |
| $5,223,334 | $5,850,090 | $6,213,015 | $6,635,419 | $7,057,824 | $7,057,824 | $14,713,040 | $23,948,033 |
| $641,046 | $641,046 | $581,567 | $581,567 | $581,567 | $581,567 | $606,701 | $604,130 |
| $0 | $0 | $0 | $0 | $0 | $0 | $0 | $0 |
| $0 | $0 | $0 | $0 | $0 | $0 | $0 | $0 |
| $641,046 | $641,046 | $581,567 | $581,567 | $581,567 | $581,567 | $606,701 | $604,130 |
| $0 | $0 | $0 | $0 | $0 | $0 | $0 | $0 |
| $641,046 | $641,046 | $581,567 | $581,567 | $581,567 | $581,567 | $606,701 | $604,130 |
| $70,000 | $70,000 | $70,000 | $70,000 | $70,000 | $70,000 | $70,000 | $70,000 |
| $330,000 | $330,000 | $330,000 | $330,000 | $330,000 | $330,000 | $6,406,257 | $14,036,338 |
| $4,182,288 | $4,809,044 | $5,231,448 | $5,653,853 | $6,076,257 | $6,076,257 | $7,630,082 | $9,237,564 |
| $4,582,288 | $5,209,044 | $5,631,448 | $6,053,853 | $6,476,257 | $6,476,257 | $14,106,338 | $23,343,903 |
| $5,223,334 | $5,850,090 | $6,213,015 | $6,635,419 | $7,057,824 | $7,057,824 | $14,713,040 | $23,948,033 |
| $4,582,288 | $5,209,044 | $5,631,448 | $6,053,852 | $6,476,257 | $6,476,257 | $14,106,338 | $23,343,902 |
i want to start a small supermarket in my own place.Actually we have a grocery shop, i want to convert that into a supermarket.What is the procedure to start a supermarket.