SIC 4932
GAS AND OTHER SERVICES COMBINED
This industry classification consists of companies primarily providing gas distribution services, but also supplying other utility services. Companies in which natural gas distribution accounts for 95 percent or more of revenues are classified in SIC 4924: Natural Gas Distribution.
NAICS Code(s)
221210 (Natural Gas Distribution)
Organization and Structure
Gas utilities, called local distribution companies (LDCs), provide customers with two services: gas transportation, or moving the gas from the pipeline to the customer, and supply, whereby the LDC buys the gas and resells it to the customer. The LDC transports gas for all its customers and supplies gas to other suppliers. The utility earns a rate of return for transporting gas but receives nothing for supplying it to those other than enduse customers. The LDC earns the same fee for transporting gas, regardless of who supplies the gas.
Gas utilities had several competitive advantages over electric utilities. While electric utilities were just beginning to experiment during the mid-1990s with allowing customers to choose among energy suppliers, large gas customers had been extending the freedom to choose their gas supplier to the smallest of customers, including homeowners. Both industries were deregulated.
By the end of the 1990s, natural gas supplied about half of the nation's energy needs. When electric utilities providers began to use natural gas for electric power generation, a new utilities superpower appeared on the horizon. Instead of natural gas companies buying out their smaller natural gas competitors, they began aligning with electric utilities companies to provide multiple services to endusers. Thus, by the millennium some of the largest utilities providers were in fact "hybrid" entities offering electricity and natural gas services to their customers. Industry leader NiSource, for example, had 3.3 million natural gas customers and 440,000 electric customers in 2003. These "cogeneration" facilities appeared to be on the rise nationally and internationally. Another spin-off industry from these consolidations was the combination of gas pipelines and fiber-optic networks, thus servicing the energy and communications businesses.
Background and Development
While state governments began to regulate the venting of natural gas in the late 1920s, federal government regulation of interstate sales of natural gas was a product of already existing federal regulations governing interstate sales of electricity. The same public outcry that led to passage of the Federal Power Act and the Public Utilities Holding Company Act in 1935 led Congress to create regulations for natural gas. (See SIC 4931: Electric and Other Services Combined. )
The Natural Gas Act, passed in 1938, was even more stringent than its electricity counterpart, giving the Federal Power Commission (now the Federal Energy Regulatory Commission) explicit authorization to fix "just and reasonable" pipeline rates, ban discriminatory tariff practices, and determine legitimate costs. In 1942, the act was amended to require interstate sales of gas for resale elsewhere to be at the lowest possible rate.
Historically, the same type of regulation used for electric utilities has been applied to interstate natural gas pipelines. Tariffs were set to recover the costs of operation and gas purchases, depreciation of investments in facilities, and to provide a regulated rate of return on business assets.
In 1954, the Supreme Court of the United States decided the Federal Power Commission had authority to regulate prices all the way back to the well. After delaying its response to the court's mandate for several years, the commission began regulating wellhead gas prices on a case-by-case basis, then experimented with setting "area rates" based on broad geographic regions. There were higher rates for "new gas," or newer discoveries, and lower rates for "old gas," or existing production.
During the late 1960s, regulated prices for interstate pipelines were relatively cheap compared with prices in intrastate markets. Within higher intrastate market prices, interstate pipelines, who could pay only the low regulated prices, were unable to meet growing demand for gas supplies. Burgeoning demand for natural gas forced pipelines and LDCs to allocate demand. The imbalance between demand and supply brought increasing pressure on Congress to deregulate wellhead prices.
In 1978, Congress passed the Natural Gas Policy Act, an extremely complex law with more than 20 different categories of gas and prices ranging from $0.30 per thousand cubic feet (mcf) to $10/mcf. But by the early 1980s, gas demand dropped due to a recession, and improved production technologies made gas available in almost unprecedented volumes. The supply and demand equilibrium was again out of synch. In 1989, Congress passed legislation phasing out price controls on most types of natural gas.
In 1992, the Federal Energy Regulatory Commission issued Order 636, which forced gas transmission companies to become common carriers of natural gas and ordered them to redesign their rate structures, essentially changing the way local gas distribution utilities obtain their natural gas. That same year, Congress passed the Energy Policy Act, which increased competition within the electricity industry. In 1996, FERC issued Orders 888 and 889, final rules governing access to utility power lines. FERC also announced a policy to consider mergers within a 15-month period.
According to the 1997 Economic Census, 119 establishments reported combined services, with their primary service being gas distribution. The industry was worth $2.85 billion. These figures did not include another 145 establishments of combined service (electricity-gas) where the primary service was electricity. In comparison, that industry was worth $28 billion in 1997.
By 1999 the gap had significantly decreased, due in large part to advanced technology for shared trenches between natural gas distribution and fiber-optic networking. Using thousands of miles of pipeline routes, pipeline companies had coupled with communications companies to create dual-service routes, making pipeline assets much more profitable and cutting costs for laying communications cable lines. As of 1999, about 200,000 miles of fiber-optic line existed in the United States. Because of increased need for Internet and telecommunication lines, that figure was expected to grow exponentially.
Current Conditions
There were a total of 592 firms operating 2,831 establishments in 2001. The vast majority (2,194) were large operations with more than 500 employees. Total industry employment was 95,348 workers earning an annual payroll of more than $6 billion.
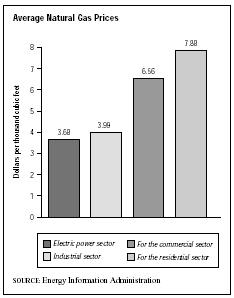
In 2002, 22.7 trillion cubic feet of natural gas was consumed by all sectors. Prices varied from sector to sector, ranging from $3.68 dollars per thousand cubic feet for the electric power sector, to $3.99 for the industrial sector, to $6.56 for the commercial sector, and $7.88 for the residential sector.
Demand for natural gas was expected to increase annually into 2025. Both the commercial and residential sectors were projected to increase demand by 2 percent annually. The electric power sector was expected to continue to be one of the larger consumers of natural gas, as coal would be used less as a power source, and demand from this sector was expected to grow from 2002's 27 percent of the natural gas market to 29 percent by 2025. The industrial segment was expected to increase its consumption from 7.3 trillion cubic feet to 10.3 trillion cubic
feet in the same time period. Prices were expected to decline into 2006, until wellhead prices increase.
Industry Leaders
The industry leader in 2001 was NiSource Inc. of Merrillville, Indiana, with $16.9 billion in revenue and 9,300 employees. NiSource's customer base exceeded 3.2 million in 2003. The company boasted one of the country's largest natural gas transmission and underground storage systems. Its pipeline system alone stretched 16,000 miles.
Other notable companies in the gas and combined services industry were San Diego-based Sempra Energy, with $15.2 billion in revenue and 11,500 employees; MDU Resources Group Inc. of Bismarck, North Dakota, with $2.9 billion in revenue and 7,000 employees; Vectren Corp. of Evansville, Indiana, with $2.9 billion in revenue and 1,900 employees; and UGI Corp. of Valley Forge, Pennsylvania, with $2.6 billion in revenue and 6,300 employees.
Research and Technology
The deregulation of the utilities industries opened the door for significant cross-mergers between gas and electric companies. By the end of the decade, shared technologies enhanced the profitability of both industries: pipeline companies, which traditionally held rights-of-way over miles of lines, could now have a financial stake in sharing those routes and passageways with other industries. Moreover, the growing technology created a form of commodity trading: fiber-optic bandwidth futures.
Within the natural gas supply market, progress in technologies associated with exploration and development of gas reduced costs and expanded the amount of gas that could be economically recovered from a well. Some examples are the use of advanced computerimaging technologies to explore underground reserves, offshore drilling deep in the Gulf of Mexico, and unconventional recovery techniques for getting more gas from reserve wells.
Technological advances in generation technologies also were important. For example, 60 percent of all additions to electric generating capacity since 1990 have been natural gas, and state-of-the-art gas turbines were increasingly being used in electricity production. Also, a significant opportunity existed in distributed power generation—modular electrical generators ranging in size up to 50 megawatts. These new turbines were easy to site and build, allowing them to serve one large customer or several large customers in one area. They also made maximum use of the gas distribution network already built to accommodate the customer's needs.
As of 2004, the Energy Information Administration was expecting that alternative sources for natural gas would increase, due to improved technology. Such alternative sources included shale, tight sand, and coalbed methane.
Further Reading
Baker, Deborah J., ed. Ward's Business Directory of US Private and Public Companies. Detroit, MI: Thomson Gale, 2003.
Hoover's Company Fact Sheet. "NiSource Inc." 3 March 2004. Available from http://www.hoovers.com .
U.S. Census Bureau. Statistics of U.S. Businesses: 2001. 1 March 2004. Available from http://www.census.gov/epcd/susb/2001/us/US332311.htm .
U.S. Department of Energy. Annual Energy Outlook 2004 With Projections to 2025. Available from http://www.eia.doe.gov/oiaf/aeo/electricity.html .
——. Monthly Energy Review, February 2004. Available from http://www.eia.doe.gov .
Comment about this article, ask questions, or add new information about this topic: