STRATEGIC PLANNING TOOLS

Strategic planning may be characterized as a systematic effort to produce fundamental decisions and actions that shape and guide what a business organization is, what it does, and why it does it. The objective of strategic planning is to develop a map by which to manage an organization's positioning.
Although some would suggest that strategic planning has lost some of its effectiveness, most managers continue to recognize the need for effective strategic planning and implementation. While strategic planning requires a significant amount of time and can be quite frustrating, if done properly, it can enable a firm to recognize its most effective position within its industry.
There are a variety of perspectives, models and approaches used in strategic planning. The development and implementation of these different tools depend on a large number of factors, such as size of the organization, nature and complexity of the organization's environment, and the organization's leadership and culture.
Five strategic planning tools are presented below: the Boston Consulting Group Matrix; the GE Market Growth/Market Share Matrix; SWOT Analysis; Porter's Generic Competitive Strategies; and Porter's Five Forces Model.
BOSTON CONSULTING GROUP MATRIX
In the late 1960s the Boston Consulting Group, a leading management consulting company, designed a four-cell matrix known as BCG Growth/Share Matrix. This tool was developed to aid companies in the measurement of all their company businesses according to relative market share and market growth. The BCG Matrix made a significant contribution to strategic management and continues to be an important strategic tool used by companies today. The matrix provides a composite picture of the strategic position of each separate business within a company so that the management can determine the strengths and the needs of
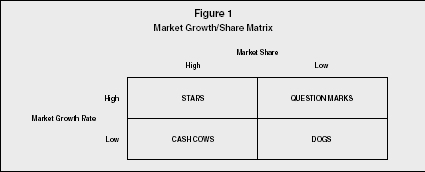
Market Growth/Share Matrix
The BCG Matrix presents graphically the differences among these business units in terms of relative market share and industry growth rate. The vertical axis represents in a linear scale the growth rate of the market in which the business exists (see Figure 1). This is generally viewed as the expected growth rate for the next five years of the market in which a particular business competes. The values of the vertical axis are the relevant market growth rates (i.e., 5 percent, 10 percent, 15 percent, 20 percent, etc.). Usually a 10 percent cut-off level is selected in order to distinguish high from low market growth rate (a 10 percent value corresponds to doubling current experience in the next five to seven years).
The horizontal axis represents in a logarithmic scale the market share of a business within a firm relative to the market share of the largest competitor in the market. For example, Company A may have a 10 percent market share and Company B, the leading competitor, holds 40 percent of the market. Company A's market share relative to Company B's market share is 25 percent, or .25×. If Company A has a 40 percent share and Company B has a 10 percent share, Company A's market share is 400 percent, or 4.0×.
Relative market share is an indicator of organization's competitive position within the industry, and underlies the concept of experience curve. Thus, business organizations with high relative market share tend to have a cost leadership position.
Each of a company's products or business units is plotted on the matrix and classified as one of four types: question marks, stars, cash cows, and dogs. Question marks, located in the upper-right quadrant, have low relative market share in a high-growth market. These businesses are appropriately called question marks because it is often uncertain what will happen to them. Careful examination by management can help determine how many resources (if any) should be invested in these businesses. If significant change can increase relative market share for a question mark, it can become a star and eventually gain cash-cow status. If relative market share can not be increased, the question mark becomes a dog.
The upper-left quadrant contains stars, businesses with high relative market share in high-growth markets. These businesses are very important to the company because they generate a high level of sales and are quite profitable. However, because they are in a high growth market that is very attractive to competitors, they require a lot of resources and investments to maintain a high market share. Often the cash generated by stars must be reinvested in the products in order to maintain market share.
When the market growth slows down, stars can take different paths, depending on their abilities to hold (or gain) market share or to lose market share. If a star holds or gains market share when the growth rate slows, stars become more valuable over time, or cash cows. However, if a star loses market share, it becomes a dog and has significantly less value (if any) to the company.
The lower-left quadrant contains businesses that have high relative market share in low-growth markets. These businesses are called cash cows and are highly profitable leaders in their industries. The funds received from cash cows are often used to help other businesses within the company, to allow the company to purchase other businesses, or to return dividends to stockholders.
Dogs generate low relative market share in a low-growth market. They generate little cash and frequently result in losses. Management should carefully consider their reasons for maintaining dogs. If there is a loyal consumer group to which these businesses appeal, and if the businesses yield relatively consistent cash that can cover their expenses, management may choose to continue their existence. However, if a dog consumes more resources than it's worth, it will likely be deleted or divested.
Strategic business units, which are often used to describe the products grouping or activities, are represented with a circle in the BCG Matrix. The size of the circle indicates the relative significance of each business unit to the organization in terms of revenue generated (or assets used).
Although the BCG Matrix is not used as often as it was in past years, one big advantage of the matrix is its ability to provide a comprehensive snapshot of the positions of a company's various business concerns. Furthermore, an important benefit of the BCG Matrix is that is draws attention to the cash flow, investment characteristics, and needs of an organization's business units, helping organizations to maintain a balanced portfolio.
Unfortunately, the BCG Matrix, like all analytical techniques, also has some important limitations. It has been criticized for being too simplistic in its use of growth rate and market share. Market growth rate is only one variable in market attractiveness and market share is only one variable in a business's competitive position. Furthermore, viewing every business as a star, cash flow, dog, or question mark is not always realistic. A four-cell matrix is too simple because strategic competitive positions are more complicated than "high" and "low".
Another disadvantage of using the BCG Matrix is that it is often difficult for a company to sufficiently divide its business units or product lines. Consequently, it is difficult to determine market share for the various units of concern.
GENERAL ELECTRIC MATRIX
In the 1980s General Electric, along with the McKinsey and Company Consulting group, developed a more involved method for analyzing a company's portfolio of businesses or product lines. This nine-cell matrix considers the attractiveness of the market situation and the strength of the particular business of interest. These two dimensions allow a company to use much more data in determining each business unit's position.
The key to the successful implementation of this strategic tool is the identification and measurement of the appropriate factors that define market attractiveness and business strength. Those individuals involved in strategic planning are responsible for determining the factors. The attractiveness of the market may be based on such factors as market growth rate, barriers to entry, barriers to exit, industry profitability, power of the suppliers and customers, availability of substitutes, negotiating power of both customers and members of the channel of distribution, as well as other opportunities and threats.
The strength of a particular business may be based on such factors as market-share position, cost placement in the industry, brand equity, technological position, and other possible strengths and weaknesses. The development of General Electric (GE) Matrix requires assessing the criteria to evaluate both industry attractiveness and business strength. The calculation of scores for these dimensions is frequently based on a simple weighted sum formula.
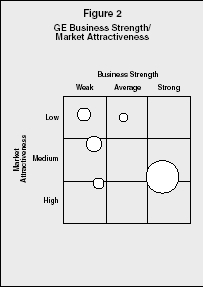
To consider this approach as a matrix analysis, market attractiveness is placed on the vertical axis with the possible values of low, medium, and high (see Figure 2). Business strength is placed on the horizontal axis with the possible values of weak, average, and strong. A circle on the matrix represents each business unit (or product line). The size (area) of each circle represents the size of the relevant market in terms of sales. A portion of the circle is shaded to represent the market share of each business unit or product line within the market.
GE Business Strength/Market Attractiveness
The nine cells of this matrix define three general zones of consideration for the strategic manager. According to this approach, the first zone contains businesses that are the best investments. These are units high in market attractiveness and strong in business strength, followed by those that are strong in business strength and medium in market attractiveness, and those that are medium in business strength and high in market attractiveness. Management should pursue investment and growth strategies for these units. Management should be very careful in determining the appropriate strategy for those business units located in any of the three cells in the diagonal of this matrix.
The second zone includes those business units that have moderate overall attractiveness and those units that have medium business strength and market attractiveness, weak business strength and high market attractiveness, and strong business strength and low market attractiveness. These businesses should be managed according to their relative strengths and the company's ability to build on those strengths. Moreover, possible changes in market attractiveness should be carefully considered.
Those businesses that fall in the last zone are low in overall attractiveness; these are a good investment only if additional resources can move the business from a low overall attractiveness position to a moderate or strong overall attractiveness position. If not, these businesses should be considered for deletion or harvest.
The GE Matrix may be considered as an improvement over the BCG Matrix. The major advantage of using this matrix design is that both a business' strength and an industry's attractiveness are considered in the company's decision. Generally, it considers much more information than BCG Matrix, it involves the judgments of the strategic decision-makers, and it focuses on competitive position.
A major disadvantage, however, is the difficulty in appropriately defining business strength and market attractiveness. Also, the estimation of these dimensions is a subjective judgment that may become quite complicated. Another disadvantage lies in the lack of objective measures available to position a company; managers making these strategic decisions may have difficulty determining their unit's proper placement. Too, some argue that the GE Matrix cannot effectively depict the positions of new products or business units in developing industries.
SWOT ANALYSIS MATRIX
One of the most widely used strategic planning tools is a SWOT (Strengths, Weaknesses, Opportunities, Threats) analysis. Most companies use, in one form or another, SWOT analysis as a basic guide for strategic planning. The worth of a SWOT analysis is often dependent on the objective insight of those management individuals who conduct the SWOT analysis. If management (or consultant management) is able to provide objective, relevant information for the analysis, the results are extremely useful for the company.
A SWOT analysis involves a company's assessment of its internal position by identifying the company's strengths and weaknesses. In addition, the company must determine its external position by defining its opportunities and threats.
Strengths represent those skills in which a company exceeds and/or the key assets of the firm. Examples of strengths are a group of highly skilled employees, cutting-edge technology, and high-quality products. Weaknesses are those areas in which a firm does not perform well; examples include continued conflict between functional areas, high production costs, and a poor financial position.
Opportunities are those current or future circumstances in the environment that might provide favorable conditions for the firm. Examples of opportunities include an increase in the market population, a decrease in competition and a legislation that is favorable to the industry. Threats are those current or future circumstances in the environment, which might provide unfavorable conditions for the firm. Examples of threats include increased supplier costs, a competitor's new product-development process, and a legislation that is unfavorable to the industry.
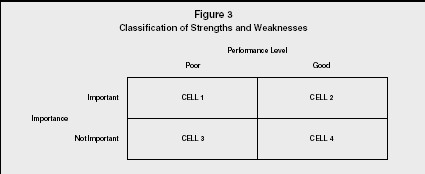
After a firm has identified its strengths and weaknesses, it should determine the significance of each factor. A management team should review all strengths and weaknesses to determine the level (minor or major) of each strength and weakness. The importance (low or high) of each strength and weakness should also be identified. As shown in Figure 3, the combination of level of performance and importance yields four possibilities.
Cell 1 contains important areas in which the company is exhibiting poor performance. When a company identifies these areas it becomes aware of the need to improve its efforts in order to strengthen its performance. Important areas in which the company is performing very well are located in Cell 2. A company should continue its current efforts in these areas. Cell 3 contains unimportant areas in which the firm is performing poorly. Since these areas are a low priority for the company, it need not pay a great deal of attention to these areas. The last category, Cell 4, includes areas in which the company is performing well, but which are unimportant. The firm may need to pull back some of its efforts in this area, depending on how unimportant the area is to the overall picture.
In order to be most effectively used, opportunities and threats must also be classified. One way to examine opportunities is to consider how attractive (low or high) an opportunity is to a particular company. A business might also consider its probability of success (low or high) in utilizing a particular opportunity. A company doesn't need to pursue an opportunity that is not particularly attractive to it, nor does it need to pursue an opportunity for which it does not possess the requisite
Classification of Strengths and Weaknesses
Careful determination and classification of a company's strengths, weaknesses, opportunities, and threats provides an excellent way for a company to analyze its current and future situation. It is not necessary for a company to take advantage of all opportunities, nor is it necessary for a company to develop methods to deal with all threats. Additionally, a company need not strengthen all of its weaknesses or be too smug about all its strengths. All of these factors should be evaluated in the context of each other in order to provide the company with the most useful planning information.
PORTER'S GENERIC
COMPETITIVE STRATEGIES
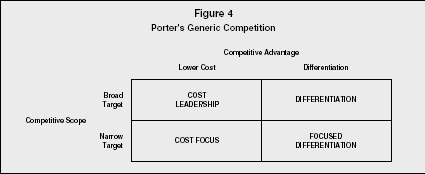
Michael Porter has suggested a method of categorizing the various types of competitive strategies. He identified two generic competitive strategies: overall lower cost and differentiation. These strategies are termed generic because they can be applied to any size or form of business. Overall lower cost refers to companies that can develop, manufacture, and distribute products more efficiently than their competitors. Differentiation refers to companies that are able to provide superior products based on some factor other than low cost. Differentiation can be based on customer service, product quality, unique style, and so on.
Porter also suggests that another factor affecting a company's competitive position is its competitive scope. Competitive scope defines the breadth of a company's target market. A company can have a broad (mass market) competitive scope or a narrow (niche market) competitive scope. The combination of broad scope and narrow scope with a low-cost strategy and differentiation results in the following generic competitive strategies: cost leadership, cost focus, differentiation, and focused differentiation (see Figure 4).
The implementation of these strategies requires different organizational arrangements and control processes. Larger firms with greater access to resources typically select a cost leadership or a differentiation
Porter's Generic Competition
Cost leadership is a low-cost, broad-based market strategy. Firms pursuing this type of strategy must be particularly efficient in engineering tasks, production operations, and physical distribution. Because these firms focus on a large market, they must also be able to minimize costs in marketing and R&D. A low-cost leader can gain significant market share enabling it to procure a more powerful position relative to both suppliers and competitors. This strategy is particularly effective in case of price-sensitive buyers in the market and small possibilities to achieve product differentiation.
A cost-focus strategy is a low-cost, narrowly focused market strategy. Firms employing this strategy may focus on a particular buyer segment or a particular geographic segment, and must locate a niche market that wants or needs an efficient product and is willing to do without the extras in order to pay a lower price for the product. A company's costs can be reduced by providing little or no service, providing a low-cost method of distribution, or producing a no-frills product.
A differentiation strategy involves marketing a unique product to a broad-based market. Because this type of strategy involves a unique product, price is not the significant factor. In fact, consumers may be willing to pay a high price for a product that they perceive as different. The product difference may be based on product design, method of distribution, or any aspect of the product (other than price) that is significant to a broad market group of consumers. A company choosing this strategy must develop and maintain a product that is perceived as different enough from the competitor's products to warrant the asking price.
Effective implementation of a differentiation strategy requires an analytical study of customer needs and preferences in order to offer a unique product. This usually helps business organizations to achieve customer loyalty, which can also serve as an entry barrier for new firms. Several studies have shown that a differentiation strategy is more likely to generate higher profits than a cost-leadership strategy, because differentiation creates stronger entry barriers. However, a cost-leadership strategy is more likely to generate increases in market share.
A differentiation-focus strategy is the marketing of a differentiated product to a narrow market, often involving a unique product and a unique market. This strategy is viable for a company that can convince consumers that its narrow focus allows it to provide better goods and services than its competitors.
None of these competitive strategies is guaranteed to achieve success, and some companies that have successfully implemented one of Porter's generic strategies have found that they could not sustain the strategy. Several risks associated with these strategies are based on evolved market conditions (buyer perceptions, competitors, etc).
Recent researchers argue that both cost-leadership and differentiation strategies can be simultaneously achieved. The principal condition for this situation is superior quality, which may lead to increased customer commitment on the one hand, and minimized quality costs (through learning effects, economies of scale, etc.) on the other.
PORTER'S FIVE-FORCES MODEL
Before a company enters a market or market segment, the competitive nature of the market or segment is evaluated. Porter suggests that five forces collectively determine the intensity of competition in an industry: threat of potential entrants, threat of potential substitutes, bargaining power of suppliers, bargaining power of buyers, and rivalry of existing firms in the industry. By using the model shown in Figure 5, a firm can identify the existence and importance of the five competitive forces, as well as the effect of each force on the firm's success.
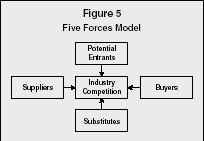
Five Forces Model
The threat of new entrants deals with the ease or difficulty with which new companies can enter an industry. When a new company enters an industry, the competitive climate changes; there is new capacity, more competition for market share, and the addition of new resources. Entry barriers and exit barriers affect the entrance of new companies into a marketplace. If entry barriers (capital requirements, economies of scale, product differentiation, switching costs, access to distribution channels, cost of promotion and advertising, etc.) are high, a company is less likely to enter a market. The same holds true for exit barriers.
The threat of substitutes affects competition in an industry by placing an artificial ceiling on the prices companies within an industry can charge. A substitute product is one that can satisfy consumer needs also targeted by another product; for example, lemonade can be substituted for a soft drink. Generally, competitive pressures arising from substitute products increase as the relative price of substitute products declines and as consumer's switching costs decrease.
The bargaining power of buyers is affected by the concentration and number of consumers, the differentiation of products, the potential switching costs, and the potential of buyers to integrate backwards. If buyers have strong bargaining power in the exchange relationship, competition can be affected in several ways. Powerful buyers can bargain for lower prices, better product distribution, higher-quality products, as well as other factors that can create greater competition among companies.
Similarly, the bargaining power of suppliers affects the intensity of competition in an industry, especially when there is a large number of suppliers, limited substitute raw materials, or increased switching costs. The bargaining power of suppliers is important to industry competition because suppliers can also affect the quality of exchange relationships. Competition may become more intense as powerful suppliers raise prices, reduce services, or reduce the quality of goods or services.
Competition is also affected by the rivalry among existing firms, which is usually considered as the most powerful of the five competitive forces. In most industries, business organizations are mutually dependent. A competitive move by one firm can be expected to have a noticeable effect on its competitors, and thus, may cause retaliation or counter-efforts (e.g. lowering prices, enhancing quality, adding features, providing services, extending warranties, and increasing advertising).
The nature of competition is often affected by a variety of factors, such as the size and number of competitors, demand changes for the industry's products, the specificity of assets within the industry, the presence of strong exit barriers, and the variety of competitors.
Recently, several researchers have proposed a sixth force that should be added to Porter's list in order to include a variety of stakeholder groups from the task environment that wield over industry activities. These groups include governments, local communities, creditors, trade associations, special interest groups, and shareholders.
The implementation of strategic planning tools serves a variety of purposes in firms, including the clear definition of an organization's purpose and mission, and the establishment of a standard base from which progress can be measured and future actions can be planned. Furthermore, the strategic planning tools should communicate those goals and objectives to the organization's constituents. Thus, the worth of these tools, as well as others, is often dependent on the objective insight of those who participate in the planning process. It is also important for those individuals who will implement the strategies to play a role in the strategic-planning process; this often requires a team effort that should allow a variety of inputs and should result in a better overall understanding of the company's current and future industry position.
SEE ALSO: Generic Competitive Strategies ; Porter's 5-Forces Model ; Strategic Planning Failure ; Strategy Formulation ; Strategy Implementation ; Strategy in the Global Environment ; Strategy Levels ; SWOT Analysis
Donna T. Mayo
Revised by Evangelos Grigoroudis and
Constantin Zopoundis
FURTHER READING:
Costin, Harry. Readings in Strategy and Strategic Planning. Fort Worth, TX: The Dryden Press, 1998.
David, R. Fred. Strategic Management: Concepts and Cases. Upper Saddle River, NJ: Prentice Hall, 2003.
Houlden, Brian. Understanding Company Strategy: An Introduction to Analysis and Implementation. Cambridge, MA: Blackwell Publishers, Inc., 1996.
Hunger, J. David, and Thomas L. Wheelen. Essentials of Strategic Management. Reading, MA: Addison Wesley, 1997.
Porter, Michael E. Competitive Strategy. New York, NY: The Free Press, 1980.
——. Competitive Strategy of Nations. New York, NY: The Free Press, 1990.
Stahl, J. Michael, and David W. Grigsby. Strategic Management for Decision Making. Massachusetts: PWS-KENT Publishing, 1992.
Wheelen, L. Thomas, and David J. Hunger. Strategic Management and Business Policy: Entering 21st Century Global Society. Reading, MA: Addison Wesley, 1998.
thanx for the team who make this site available for the executives and students.
munity of business environment they are getting alot of things and news ideas from this place with in seconds. every topic is founded here with the guidanace of extreme professionals.