Routing/Navigation Software Company
BUSINESS PLAN
PATH SYSTEMS, INC.
36000 Washington Street
Pittsburgh, Pennsylvania 15219
This business plan outlines the strategies for the development and sales of routing /navigation software that allows vehicles to travel faster, safer, and more predictably. PATH Systems, Inc., provides transportation companies with routes optimized to avoid accidents (vs. shortest-path routes). Using a simulation model we have projected that we can reduce involvement in accidents by over 40 percent.
- EXECUTIVE SUMMARY
- COMPANY OVERVIEW
- PRODUCTS & SERVICES
- TECHNOLOGY
- COMPETITION
- THE MARKET
- MANAGEMENT & BOARD
- SALES STRATEGY & MARKETING PLAN
- BUSINESS/PRICING MODEL
- INVESTMENT & FINANCING STRATEGY
- FINANCIAL PLAN
- APPENDIX
EXECUTIVE SUMMARY
PATH Systems, Inc., provides transportation companies with routes optimized to avoid accidents (vs. shortest-path routes). Using a simulation model we have projected that we can reduce involvement in accidents by over 40 percent. Accidents and their associated financial liabilities are an acute problem for large trucking companies. Recently jury awards have skyrocketed, sending up the cost of insurance by over 50 percent per year, and threaten many trucking companies—large and small—with bankruptcy. We are assembling an industry alliance of transportation companies, insurance companies, and logistics firms to prove on the road what we have shown in the lab. We will use the PATH system with thought-leader trucking firms large enough to rack up the necessary miles to statistically document the system's efficacy.
Philip M. Moon, CEO, founded PATH Systems in 2001 to take advantage of a significant market opportunity to build a road condition database and next-generation routing/navigation software to move vehicles through increasing road congestion more safely, profitably, and with fewer delays. PATH builds road condition databases and next-generation routing software. PATH's technology measures road speeds under a variety of conditions using GPS and other sensors, and combines it with other dynamic road attributes to create future road speed estimates based on proprietary databases and analytics. We then provide directions to the vehicles through next-generation routing software that we have developed in conjunction with several technology partners.
PATH answers the question, "How long will it take to get there?" and extends that knowledge into more efficient and safer routes. PATH meticulously catalogs the traffic patterns associated with everyday incidents so that future trips can be routed to best navigate around trouble spots. We gather the following data:
- Actual Road Speeds—by time of day, from participating partner vehicles
- Accident Data—from DOT, insurance, and state agencies
- Construction Data—from State transportation departments
- Weather Data—from National agencies
Objectives
- Form a loose alliance of companies to jointly develop, road test, and document our products, obviating the need to raise large amounts of capital
- Provide alliance companies full access to the developed products
- Integrate PATH's next-generation navigation software with existing routing software vendors' and tracking companies' solutions
- Market the navigation software solution to large transportation companies
- Promote the accident avoidance benefits of the database solution to insurance companies who benefit from reduced accidents, claims, and lawsuits
Mission
PATH Systems was founded to make road travel safer, more profitable, and more efficient. We have studied the problem and have begun implementing a solution that models the considerable complexity of the traveling world, based on empirical data gathered automatically, which is then stored, processed, and redistributed in a format that a traveler can use to make timely navigation decisions.
Keys to Success
- PATH's competitive advantage lies in the ability to generate dynamic routes by time of day that also consider external attributes such as high-accident areas, construction zones, and weather. Our routes are superior to those that are calculated solely on shortest path.
- PATH's core asset is our intellectual property protected by three pending patents. Those technologies include knowledge of how to precisely gather data in complex networks, how to store that data, how to make that data available for high-speed applications, and how to optimize future trips under a very flexible set of conditions.
- By relocating the company to Pittsburgh, Pennsylvania, PATH will reside in the heart of the Midwest transportation routes, with quick access to the major trucking carriers' headquarters. With seven major Interstate highways (I-70, 71, 75, 76, 77, 80, and 90) and being situated in a primary East-West commercial traffic corridor, Pennsylvania is a showcase of commercial highway transportation.
Timeline
- Gather "alliance of the willing" with representation from insurance, transportation and logistics/consulting industries to form the Accident Avoider Alliance
- Form Implementation Teams for Individual Companies
- Develop Specs (overall, database, business integration, I/O)
- Alliance Covers PATH's Operating Expenses During Field Trial
-
Once Savings/Benefits Are Documented:
- Transportation companies roll out solution fleet-wide
- Insurance companies introduce to client-base and new customers reduced premium insurance product
- PATH co-markets with insurance and logistics companies
COMPANY OVERVIEW
PATH Systems, Inc., is a California C-Corporation formed in September 2001. Philip M. Moon founded the company to take advantage of a significant market opportunity presented by combining the precision of passive tracking services with next-generation routing software.
PATH moved its headquarters to Pittsburgh, Pennsylvania, in August 2003, signing a lease for space in a building on the corner of Main and Washington streets. The city of Pittsburgh and the Pittsburgh investment community have proven to be a receptive locale for PATH, providing a $250,000 regional loan/grant package.
Pittsburgh is an ideal location for servicing transportation companies: it is centrally located in the nation's Texas to Mid-Atlantic transportation nexus. Major customer sites are just a short trip away. Also, real estate and labor is much more reasonably priced.
In addition to providing a headquarters facility, the Pittsburgh office will focus on the transportation/logistics opportunity while a California office will be maintained to further develop our suite of intellectual property.
Company History
In a previous position at IBM, Philip Moon had a chance to work with the early GPS prototypes. While early GPS applications were focused on the military and consumer retail markets, Philip felt there was an untapped business market broadly defined as trucking and delivery. In 2001 he founded PATH Systems, Inc., with the goal of bringing location-based services to the world using GPS, wireless, and Internet technologies.
Early interviews with trucking/delivery companies suggested the industry penetration of these technologies was still shallow, and implementations were piecemeal. The transportation field had yet to experience the systemization that occurred when ERP systems transformed manufacturing over the last two decades. There was an opportunity to use tracking devices to provide input to transportation planning software, allowing it to reflect the realities of the transportation world.
Philip returned to his alma mater, Harvard, and in particular, Harvard's legendarily prolific Electrical Engineering and Computer Science departments. Students from these departments have created past engineering miracles such as Alta Vista, Reuters, and most recently, Yahoo! Philip assembled a team of Ph.D. engineering candidates, software specialists, wireless communication gurus, and mathematical algorithm wizards to develop and code the new PATH platform.
In spring 2002, PATH launched the first of several products into the tracking segment of the market. During the development and marketing of these products, we developed a deep understanding of the capabilities and limitations of tracking technologies, the varying capabilities of wireless technologies, and the unit economics of the value propositions. We also learned that the tracking business was a poor fit for PATH's strategic competencies, so we refocused the company towards using the data that tracking systems generate to provide higher order benefits.
The first embodiment of that strategy was the creation of the Driver-base, a comprehensive set of road speeds and road conditions automatically rolled into our master file, leveraging the latest tracking, wireless, and database technologies. We felt the Driver-base was the breakthrough development necessary to create and maintain dynamic or time-expanded networks (networks where road speed assumptions change by time of day). Dynamic networks necessarily produce more accurate and precise vehicle location estimates, thus allowing transportation firms to remove dead time out of their schedules and dramatically improve return on assets.
We chose to go to market by partnering with existing routing software vendors who would license our database via an ASP model to enhance the functionality of their products. However, subsequent industry discussions revealed that many routing algorithms currently in use are ill-suited to handle the demands of time-expanded networks under any commercially reasonable processing time requirement.
This insight led us back to the labs where we researched and worked the algorithm issues aggressively. The result was our patent pending EP (Estimate-Pruning) algorithm. EP provides two important contributions: 1) It allows for quick optimization in networks where road speed estimates change by time of day, and 2) it creates a practical solution for optimization based on a new set of routing characteristics, such as accident avoidance, standard deviation reduction, and profitability optimization in operations where random, spontaneous pick-ups have highly variable prices. In 2003, PATH received important validation for EP from the IEEE who refereed and published our first seminal paper describing the algorithm.
In early fall 2003, PATH moved its headquarters to Pittsburgh, Pennsylvania, from California to be closer to our client base and to leverage the vibrant logistics and transportation communities of Pennsylvania and the Midwest.
We are currently assembling an industry alliance of transportation companies, insurance companies and logistics firms to prove on the road what we have shown in the lab. We will use the PATH System with thought-leader trucking firms large enough to rack up the necessary miles to statistically document the efficacy of the PATH system.
PRODUCTS & SERVICES
PATH's core product is the database that allows users to a) predict a series of trip durations under a variety of conditions and b) identify and document operational inefficiencies. Depending on the type of client and their particular needs, the information database can be packaged in a number of ways:
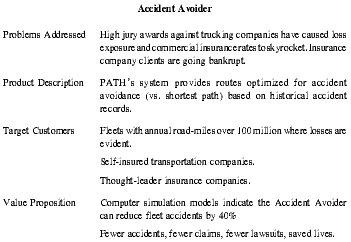
| Problems Addressed | High jury awards against trucking companies have caused loss exposure and commercial insurance rates to skyrocket. Insurance company clients are going bankrupt. |
| Product Description | PATH's system provides routes optimized for accident avoidance (vs. shortest path) based on historical accident records. |
| Target Customers | Fleets with annual road-miles over 100 million where losses are evident. |
| Self-insured transportation companies. | |
| Thought-leader insurance companies. | |
| Value Proposition | Computer simulation models indicate the Accident Avoider can reduce fleet accidents by 40% |
| Fewer accidents, fewer claims, fewer lawsuits, saved lives. |
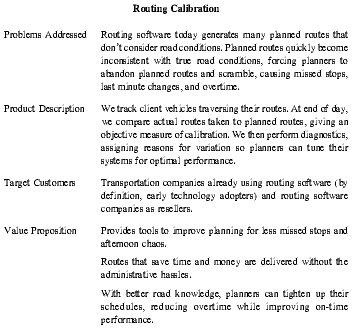
| Problems Addressed | Routing software today generates many planned routes that don't consider road conditions. Planned routes quickly become inconsistent with true road conditions, forcing planners to abandon planned routes and scramble, causing missed stops, last minute changes, and overtime. |
| Product Description | We track client vehicles traversing their routes. At end of day, we compare actual routes taken to planned routes, giving an objective measure of calibration. We then perform diagnostics, assigning reasons for variation so planners can tune their systems for optimal performance. |
| Target Customers | Transportation companies already using routing software (by definition, early technology adopters) and routing software companies as resellers. |
| Value Proposition | Provides tools to improve planning for less missed stops and afternoon chaos. |
| Routes that save time and money are delivered without the administrative hassles. | |
| With better road knowledge, planners can tighten up their schedules, reducing overtime while improving on-time performance. |
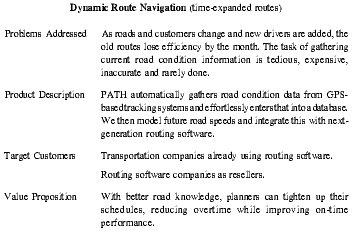
| Problems Addressed | As roads and customers change and new drivers are added, the old routes lose efficiency by the month. The task of gathering current road condition information is tedious, expensive, inaccurate and rarely done. |
| Product Description | PATH automatically gathers road condition data from GPS-based tracking systems and effortlessly enters that into a database. We then model future road speeds and integrate this with next-generation routing software. |
| Target Customers | Transportation companies already using routing software. |
| Routing software companies as resellers. | |
| Value Proposition | With better road knowledge, planners can tighten up their schedules, reducing overtime while improving on-time performance. |
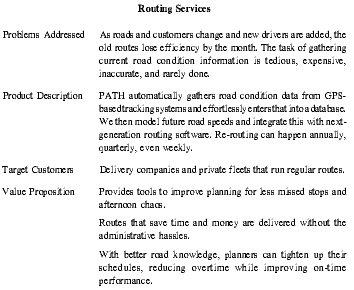
| Problems Addressed | As roads and customers change and new drivers are added, the old routes lose efficiency by the month. The task of gathering current road condition information is tedious, expensive, inaccurate, and rarely done. |
| Product Description | PATH automatically gathers road condition data from GPS-based tracking systems and effortlessly enters that into a database. We then model future road speeds and integrate this with next-generation routing software. Re-routing can happen annually, quarterly, even weekly. |
| Target Customers | Delivery companies and private fleets that run regular routes. |
| Value Proposition | Provides tools to improve planning for less missed stops and afternoon chaos. |
| Routes that save time and money are delivered without the administrative hassles. | |
| With better road knowledge, planners can tighten up their schedules, reducing overtime while improving on-time performance. |
All of the above will be priced based on a monthly revenue per rig model. In addition, PATH charges fees for installation, consulting, and engineering customization at an hourly rate.
Products & Services Description
PATH is introducing the next generation in routing and navigation software. PATH's technology measures road speeds under a variety of conditions using GPS and other sensors to create future road speed estimates based on proprietary databases and analytics. We then relay directions to the vehicles using next-generation routing software that we have developed in conjunction with several technology partners.
PATH answers the question, "How long will it take to get there?" and extends that knowledge into more efficient and safer routes. We measure actual road speeds under a variety of conditions using GPS and other devices to create future road speed estimates based on a set of protected, proprietary databases and analytics. We then feed those estimates into our next-generation routing software to generate an optimal route based on the conditions the vehicle is expected to encounter. In so doing, we are codifying all the traffic information that humans have imperfectly tried to keep in their heads and are providing significantly more route choices by giving access to other drivers' trip experiences.
Routing software today grossly simplifies road condition assumptions: road speeds are assumed to be the same across all roads in a "class," the road speed assumptions don't change by the time of day, and all intersections are assumed to clear at the same rate. For example, if a delivery vehicle is routed to make 15 drop-offs per day using standard routing software, the routes will become grossly uncalibrated with road conditions by sometime mid-morning. The estimated times of arrivals do not take into account the time of day/evening the vehicle is traveling, road construction, weather delays, or traffic accidents. As a result, they are rarely calibrated with the actual events on the road, and they are only optimized for sequential considerations such as distance and time versus more randomly occurring events such as safety, standard deviation, and profitability. PATH meticulously catalogs the traffic patterns associated with such everyday incidents, so that future trips can be routed to best navigate around trouble spots.
PATH has solved the problem by developing a set of algorithms that 1) optimize in consideration of a large set of road conditions that change by time of day ("time-expanded networks"), and 2) optimize based on user preference including nonsequential events such as safety. PATH meticulously catalogs the traffic patterns associated with such everyday incidents so that future trips can be routed to best navigate around trouble spots.
Networks where the road speeds change by time of day—called dynamic networks—have long enjoyed acceptance at academic logistics citadels such as Georgia Tech, Virginia Polytechnic, and others. Yet, there are few real-world implementations due to 1) the complexity of gathering the huge amount of data required, and 2) the computer science challenges of generating optimized routes within reasonable computer run times. To solve the run-time problem, routing companies have resorted to a simplifying assumption referred to as FIFO (First-In, First-Out), which allows run times to be short, but disallows optimization of variables such as accident avoidance, standard deviation of road speeds and profitability of jobs. PATH Systems has solved both of these problems:
1) our patent pending method of automatically gathering, storing, and integrating road condition data with next-generation routing software allows for practical implementation of time expanded networks, and 2) our EP algorithm (also patent pending) solves the computer science problem of quick run-time solutions for large, time-expanded networks without the imposition of the FIFO simplification.
With non-FIFO algorithms, the following optimization routines are possible:
- Routes with fewest incidence of accidents
- Routes with lowest overall standard deviation
- Routes that avoid speed traps
- Routes that consider variable dock times by time of day
- Multi-stop routes that optimize on overall profitability
- Inter-modal planning problems where the cost of transit changes by time of day
While the concept of easily implemented time-expanded networks under non-FIFO conditions had great appeal among the logistic elite, such language sent many practicing transportation managers packing for the hills. We reduced that large concept down to two bite-sized products: 1) Accident Avoider and 2) Routing Calibration.
Product Benefits
Implementing PATH's vehicle routing and navigation solution provides a variety of benefits:
Boost Productivity
- Serve more customers in less time
- Increase your bottom line by better utilizing your fleet assets
- Increase the number of profitable turns on your vehicles each day
- Send your drivers on the most efficient, safest, and most predictable routes available
- Reduce the number of hours your drivers spend being unloaded and loaded
Reduce Operating and Maintenance Costs
- Reduce fuel costs through improved scheduling
- Cut down on wear and tear of your vehicles
Improve Safety
- Reduce accidents, claims, lawsuits
- Save lives
Enhance Customer Service
- Increase on-time deliveries
- Provide more accurate predictions of arrival time
- Dispatch closest vehicle for faster pickups and deliveries
Key characteristics of PATH Next-Generation Routes:
- Routes reflect actual road conditions
-
Road speeds and recommended routes change by:
- Time of day
- Day of week/year
- Known construction zones
- Weather
-
Routes can be optimized to:
- Deliver safer routes, avoiding accident areas
- Reduce travel times (without speeding)
- Reduce variations in trip length (lower standard deviation of route times)
Professional Services
PATH's deep team of transportation industry veterans and business professionals can help solve transportation problems. Our senior team has over 215 years of combined management and transportation experience.
Services include:
- Analysis of current routing software and routing processes
- Evaluation/analysis of your fleet's operations
- Integration of mobile resource management tools with legacy applications
- Develop a mobile asset management program that is right for you
- Implementation of the specially-designed technology solution
TECHNOLOGY
The PATH technology platform is highly reliable, scalable, and flexible. PATH combines proven technologies with proprietary, innovative processes to deliver unparalleled service.
Key Characteristics of the PATH Technology Platform:
Easy-to-Use
- Digital maps that are easy to read and navigate
Flexible
- PATH software and services are built on industry-leading and open standards
- Linux operating system, JAVA-based software, Internet protocol communication standards
- Integrates easily with existing software applications and legacy systems
- Agnostic approach to wireless networks and GPS hardware—PATH works with any network or device
Reliable
- PATH leverages multiple data center server facilities to ensure 24x7x365 service
- Industry-leading data storage and management practices
- Data is protected through redundant locations and automatic backup twice per day
Scalable
- State-of-the-art database software to manage diverse data collection and analysis
- Industry-leading data storage and data management practices
PATH is Network Agnostic
While networks and standards change continually, PATH retains the flexibility to work with any wireless data network available. We are not tied to one technology, platform or data network.
The combustive growth in the technology sector during the late 1990s delivered several powerful new tools that have yet to be harnessed together for the Geographic Information Systems (GIS) task:
- Global Positional Satellites (GPS) allow us to track the paths and speeds of individual vehicles
- Wireless communication networks allow us to communicate those paths and speeds in fast and economical ways
- Database and storage technologies allow us to warehouse and retrieve terabytes of information with little manual intervention
- Internet technologies provide a universal platform through which we may communicate broadly
PATH Systems was founded to make road travel more efficient, safer, and more predictable. We studied the problem and began implementing a solution that models the considerable complexity of the traveling world, using empirical data that is gathered automatically, stored, processed, and redistributed in a format that a traveler can use to make timely navigation decisions.
Specifically, the innovations we introduce are:
- Concept of systematically gathering voluminous quantities of precise road and trip history data
- Cross referencing and building that data record to enhance its explanatory power using, for example, weather conditions, vehicle profile, driver profile, emergency conditions, etc.
- Maintaining a complete record of actual observations as well as creating a highly available predictive layer of data for use in time-expanded optimization systems
- A set of stochastic models that translate historical observations into expected road conditions
- The creation of optimized routes using today's CPU processing power, that can realistically handle time-expanded routes
- The creation of optimized routes that consider nonsequential (a.k.a. post-FIFO) events, such as the incidence of accidents, standard deviation, and the preponderance of different drivers traveling across the same road at different speeds
- The development of preference profiles where drivers can choose to optimize routes based on a weighting of efficiency, distance, safety, standard deviation, avoidance of speed traps, and other considerations
- The gathering of a subset of road condition data in real time that has proven to have significant and far-reaching impact (so-called "Flashpoint" data) using satellite and other technologies
- The re-processing of expected navigation paths based on the flashpoint data and the communication of updated navigation suggestions to drivers in real time
These solutions are protected with three pending patents.
Patented Technology
- Business Process —Gathering, managing, and analyzing event-based data on road conditions/experiences
- Optimization Algorithms —Multi-variable optimization algorithms for routing decisions
- Database Technology —Storing large volumes of road condition data and making that data available for high-speed applications
COMPETITION
PATH's competitive advantage lies in the ability to generate dynamic routes by time of day that also consider external attributes such as high-accident areas, construction zones, and weather. Our routes are superior to those that are calculated solely on shortest-path.
PATH's core asset is our intellectual property protected by three pending patents. Those technologies include knowledge of how to precisely gather data in complex networks, how to store that data, how to make that data available for high-speed applications and how to optimize future trips under a very flexible set of conditions.
We know of no other company building a database using GPS devices to be integrated with routing software. There are two sets of competitors in adjacent industries: 1) Tracking companies and 2) Routing software companies. PATH retains the flexibility to compete with these companies or partner with them. Each set of competitors can benefit from the PATH database service.
Although tracking isn't the core focus of PATH, we do compete with many companies to provide fleet management and tracking solutions. These companies are focused on reliable tracking and communication with drivers. These competitors typically lack the capability to do database analysis, and none possess the expertise to deliver next-generation routes.
The leading tracking companies are Magellan, Garmin, Altec, TravelWell, and StreetWise. None of these companies has decided to build a database necessary for this application and we are in discussions with them and their customers regarding appending our services onto theirs to deliver our higher order benefits.
We are decidedly not in the GPS tracking business although our products use the data gathered from such products. Rather we will get finders' fees from placing their units into service.
Likewise, we know of no other company offering routing calibration services or routes optimized to avoid accidents. Conceivably a routing software company could acquire a tracking system and develop such a service, but they would be in violation of our first patent, and we would seek a royalty stream from them. The leading routing software companies are Smithson, Philips, and Panasonic. We are in discussions with them as well.
There are two commercial companies who understand dynamic networks and could potentially develop a product: UPS/Roadway and BMT Systems. We've discussed our method of building dynamic networks with UPS. They have provided strong validation saying they are in the process of developing a similar system and have invited us in to discuss these kinds of systems. We also have had discussions with BMT Systems about our range of services. They have the understanding, expertise, and desire to create a calibration product and possibly an Accident Avoider product in violation of our pending patents. We are attempting to partner with them versus compete.
There are scores of small logistics re-routing services consulting outfits that offer re-routes for $250,000 to $600,000 using highly labor intensive methods. We feel our tracking services will allow us to significantly undercut their pricing while maintaining high margins.
Finally, there are numerous Geographical Information System (GIS) software vendors that provide visual maps for use in navigation, including GDT, iiMap, Navtech, Telcontar, and Tele Atlas. PATH's technology can interface with any of them, and we are in discussions with several of the vendors.
THE MARKET
Two broad application markets are targeted by PATH: the logistics/transportation market and the data packet/networking market. PATH's core has been in the transportation space, and this plan primarily covers transportation. Still, we have identified opportunities to apply our collection methods and optimization algorithms to the data packet market as well. That opportunity will be pursued by a dedicated division and will be the focus of an additional forthcoming business plan.
Market Needs
Why the need for Next-Generation Routing and Navigation Software? Congestion—both on the road and at the dock—is a major problem...and it's getting worse.
Road Congestion
- Traffic jams have increased by 350% in the last 16 years (source: 1999 Mobility Report)
- Trucking traffic will grow by 83% by 2020 (source: 10/3/02 DOT Study)
- Road congestion annually costs U.S. business $72 billion (source: 1999 Mobility Report)
- 6.6 billion gallons in wasted fuel
- Cost per driver in Los Angeles is $1,370 per year
Dock Congestion
- Average driver spends 37.5 hours per week waiting to be loaded or unloaded (source: TCA Study 2000)
- Docks at port are in crisis. California legislature is countering with the Lowenthal Bill, assessing $250 for each incidence of a 30+ minute wait
- Unpredictable trips make backhauls difficult. 24% of trucks on road are rolling empty (source: The Logistics Institute at Georgia Tech—January 2002 Study)
- Congestion is a serious problem for freight transportation. It contributes to making transit times longer and more unpredictable. Unpredictability can hamper just-in-time inventory management and hinder some production processes. As a result, shippers and carriers assign a value to increases in travel time, ranging from $25 to almost $200 per hour, depending on the product carried. The value of reliability (i.e., the cost of unexpected delay) for trucks is another 50 percent to 250 percent higher (2001 USDOT FHWA). Hence, congestion increases the cost of freight and therefore has an effect on the U.S. economy.
Market Trends
The market for PATH's services is developing very rapidly, as the transportation/trucking industry rushes to reap the benefits of technology that manufacturing has already demonstrated. U.S. trucking revenues total more than $550 billion annually (~6% of GDP), yet the market remains highly fragmented. No trucking company has captured more than 1 percent of the market. The main reason for this is that operations remain primarily manual and there has been under-investment in automation and value-added software applications. We anticipate this being a large and growing market for the next 10 to 15 years. If the Trucking Industry would invest like other more efficient industries, then the potential market for external software could total approximately $24 billion:
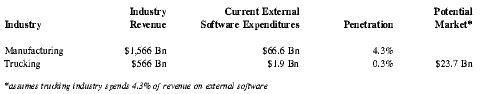
| Industry | Industry Revenue | Current External Software Expenditures | Penetration | Potential Market* |
| *assumes trucking industry spends 4.3% of revenue on external software | ||||
| Manufacturing | $1,566 Bn | $66.6 Bn | 4.3% | |
| Trucking | $566 Bn | $1.9 Bn | 0.3% | $23.7 Bn |
The Manufacturing vertical spent $804 million on Transportation Management Systems (TMS) in 2001, and that is projected to increase to $1.7 billion by 2006 (source: ARC Advisory Group).
Every day in the U.S. an estimated—
- 21 million trucks,
- make 245 million stops,
- delivering 750,000 tons of product,
- after traveling 2 billion miles,
- under constantly changing conditions.
Yet, trucking operations are primarily manual. 72 percent of route planning operations are still done manually (source: The Logistics Institute at Georgia Tech—January 2002). Key reasons for this phenomenon are that it is too difficult to gather trip data accurately and organize for computerized planning, and it is easier to just rely on the experience base of dispatchers. Current software for the trucking market simply does not work.
Current Routing Software
Current routing and navigation software was developed to reduce congestion, but it has several limitations:
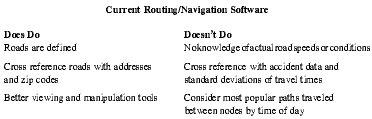
| Does Do | Doesn't Do |
| Roads are defined | No knowledge of actual road speeds or conditions |
| Cross reference roads with addresses and zip codes | Cross reference with accident data and standard deviations of travel times |
| Better viewing and manipulation tools | Consider most popular paths traveled between nodes by time of day |
Early software usefulness has been limited:
- Primary impact has been to reduce amount of time planning for a trip before initiating
- Travel time hasn't been significantly reduced
How is PATH different from other vehicle tracking services?
- PATH delivers faster, safer, and more predictable routes for your fleet
- PATH utilizes event-based data to create an ever-growing, road history database
- PATH databases and analytics grow and improve with your enterprise; PATH data is never out of date
- We create custom solutions for unique requirements, such as providing objective, detailed location reports when required for law enforcement and dispute resolution, or exception reports that flag speeding vehicles, errant vehicles, and detained vehicles
MANAGEMENT & BOARD
PATH has assembled a world-class team of experienced senior-level personnel with proven track records for innovation, product marketing, Internet operations, and sales to business customers.
Key Executives
Philip Moon, Founder, Chairman and CEO
Philip is a seasoned general manager with speed-oriented, entrepreneurial expertise built on a solid traditional foundation. Most recently Philip served as Chairman and Chief Executive Officer for Fairways.com, the leading online golf retailer and manufacturer of mass customized clubs. There he managed a team of 200 people, raised $30 million, recruited a senior management team, acquired a subsidiary, and created an award-winning website. Prior to Fairways.com, he was General Manager, Consumer Division and Vice President of Marketing at Skye.com, the leading online software retailer. There he created the Skye brand and built the core disciplines and team that grew the company from $16 million in sales to $120 million in sales. Prior positions include Vice President of Sales and Marketing at CNN, launched BlueDress.com, and Vice President of Marketing and Sales, IBM Corporation, where he pioneered IBM's handheld product line and launched IBM's first website. He has also served as Brand Manager at Pfizer and MIS Director for Boeing Corporation. Philip received his M.B.A. from Harvard Graduate School of Business and his M.A. in Economics from the University of Michigan.
Daniel O'Day, Vice President of Client Services and Administration
Daniel is a Certified Public Accountant with a broad financial, retail, and consulting career. Daniel has extensive experience with business systems and applications involving large scale ERP systems design and implementation for mid- to large-sized organizations. As Vice President of BMI Group, a retail management consulting firm, he directed numerous systems projects, managing project teams comprised of consultants, vendors, and client resources.
Consulting clients included: Heartfelt Greetings, Coleman, Adidas, Trek, and Apple Corporation. Prior to BMI, Daniel consulted for Peters & James's management consulting division. Prior positions include Business Analyst at State Farm Insurance, and Financial Systems Analyst/Accountant at Ryder Transportation. Daniel received his Master's in Accounting and Information Systems from the University of Virginia and his B.S. in Accounting from Columbia University.
Board Members
Philip Moon, Chairman
Michael Belle, Director
Michael Belle is experienced in logistics and supply chain efficiency, having served thirty-one years with UPS. Among other jobs, he served as President and CEO of Consolidated Freightways, Trailways Freight, and General Trucking Industries, where he successfully implemented a dramatic turnaround. He led the strategic planning effort resulting in the creation of Roadway, one of the world's most profitable trucking companies. He also participated in the creation of and served as the first president of Jordan Logistics, one of the world's fastest growing and most profitable logistics companies.
Jane Smith, Director
Jane Smith has almost 30 years of experience in the trucking industry, representing the trucking industry in Washington, D.C., both as a Senior Vice President for the General Truck Associations and the president of the Semitruck Association. She is currently the Principal in Smith and Associates, a transportation consulting firm that specializes in bringing new technology products to the trucking industry. Ms. Smith earned a B.A. in Political Science from the University of Wyoming and an M.A. in Politics and Public Affairs from the University of North Carolina. She has been president of the Transportation Research Forum and was named Person of the Year by the Women's Transportation Seminar. She serves on the Board of Directors of TravelWays, Truckitonline, TravelWell Communications, and the Cost-Effective Transport.
Borden Jackson, Director
Mr. Jackson has more than 30 years of experience as CFO, consultant, and serial entrepreneur. He spent the first 18 years of his career with Johnson and Marks, serving for seven years as Partner-in-Charge of the San Francisco office's Emerging Business Department. In that role, he assisted scores of start-up companies from inception to IPO. Grant was Senoir Vice President and CFO at Finders, Inc., a publicly traded company. He was one of the first employees at the Arena Management Corporation. In addition, he has held senior roles in a variety of companies, including Morningstar, Financial Times, Yahoo!, and Fairways.com. He has participated in over $700 million of corporate financings. Grant holds a B.B.A. in accounting from St. Louis University and an M.B.A. in finance from Bowling Green University. He also is the author of a seminal book on international trade.
Technical Team
Our technical team is largely drawn from Harvard's legendarily prolific Electrical Engineering and Computer Science departments. Students from these departments have created past engineering miracles such as Alta Vista, Reuters, and most recently, Yahoo! There, we met Jason Schmidt, a Ph.D. candidate in Electrical Engineering. Jason liked Philip's vision and signed on immediately. Shortly after, Philip found Monty Fresard, a seasoned software wizard whose resume includes the Amiga operating system, the first SIMS launch, and several Internet platforms. Monty attracted Kevin Stringer, a seasoned web author versed in the ways of Velocity, to join PATH as well. The team developed code and created the new PATH platform. In February 2002, the Harvard team recruited several other trusted Harvard classmates to pick up the mantle. Over the next six months, Sanja Patel and Ali Ulakonda joined PATH. In addition to writing code, each new member brought some cutting-edge talent to PATH. Sanja is a wireless communications expert; Ali's special insight lies in optimization.
Advisory Board
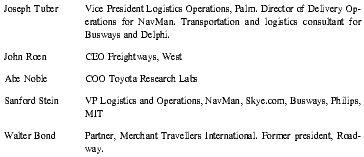
| Joseph Tuber | Vice President Logistics Operations, Palm. Director of Delivery Operations for NavMan. Transportation and logistics consultant for Busways and Delphi. |
| John Roen | CEO Freightways, West |
| Abe Noble | COO Toyota Research Labs |
| Sanford Stein | VP Logistics and Operations, NavMan, Skye.com, Busways, Philips, MIT |
| Walter Bond | Partner, Merchant Travellers International. Former president, Road-way. |
Personnel Resources
PATH plans to staff the following positions to round out our development and management team. Hiring will be at market rates, and we don't anticipate any shortage of marketable candidates in the region.
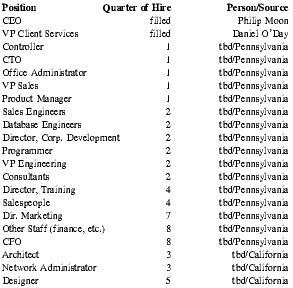
| Position | Quarter of Hire | Person/Source |
| CEO | filled | Philip Moon |
| VP Client Services | filled | Daniel O'Day |
| Controller | 1 | tbd/Pennsylvania |
| CTO | 1 | tbd/Pennsylvania |
| Office Administrator | 1 | tbd/Pennsylvania |
| VP Sales | 1 | tbd/Pennsylvania |
| Product Manager | 1 | tbd/Pennsylvania |
| Sales Engineers | 2 | tbd/Pennsylvania |
| Database Engineers | 2 | tbd/Pennsylvania |
| Director, Corp. Development | 2 | tbd/Pennsylvania |
| Programmer | 2 | tbd/Pennsylvania |
| VP Engineering | 2 | tbd/Pennsylvania |
| Consultants | 2 | tbd/Pennsylvania |
| Director, Training | 4 | tbd/Pennsylvania |
| Salespeople | 4 | tbd/Pennsylvania |
| Dir. Marketing | 7 | tbd/Pennsylvania |
| Other Staff (finance, etc.) | 8 | tbd/Pennsylvania |
| CFO | 8 | tbd/Pennsylvania |
| Architect | 3 | tbd/California |
| Network Administrator | 3 | tbd/California |
| Designer | 5 | tbd/California |
Project Management
The most important component of a successful engagement is a clearly defined plan. A good plan that is achievable and understood by individual participants can serve as the "roadmap" to enhance communication and gain consensus in defining how the group anticipates achieving its goals. In addition, it can facilitate improved understanding of coordination of roles, interdependency of responsibilities, and the importance of completion dates.
PATH will work with our alliance members in developing the detailed development plan for the initial phases of the engagement and measuring progress against the plan. The plan will outline the engagement activities and tasks, responsibilities, start date, end date, and deliverables. PATH will also lead the alliance team in developing a summary-level work plan for the rollout phases of the project.
PATH will direct the alliance team in producing the following:
- Confirmation of Project Scope (i.e., features to be developed, interfaces required, phases, etc.)
- Detailed Engagement Plan for the initial project development and testing phases
- Summary-Level Project Plan for remainder of the engagement rollout
- Status Reports (produced bi-weekly, outlining progress against the Engagement Plan, issues, etc.)
PATH Systems will act as the project lead for all phases. Specifically, Daniel O'Day will perform as Project Director, directing project management, identifying and resolving issues, maintaining project work plans, conducting management and status meetings, and reviewing all important work product.
SALES STRATEGY & MARKETING PLAN
PATH Systems provides two products: 1) an Accident Avoider product which generates routes optimized to avoid accident times/areas (versus shortest-path routes), and 2) a Routing Calibration product that allows existing users of routing software to easily tune their operations to significantly higher levels of efficiency.
We intend to commercialize our Accident Avoider technology by forming an industry alliance of top transportation companies who will split the development costs during a field test period. We will then use those companies as reference accounts as we introduce the proven product though insurance companies and logistics providers.
To date, PATH has developed the Accident Avoider product using computer simulation models. At Harvard's EE/Computer Science department we invented the EP algorithm which uniquely optimizes routes to be the safest possible using past accident times/locations as predictors of future trouble areas. We have filed three patents on various aspects of this technology and have submitted our academic paper describing the EP algorithm to IEEE/ITS (Institute of Electrical and Electronics Engineers; the division we're working with is the Intelligent Transportation Systems group) and have been invited to publish it and present it at their worldwide conference in Hong Kong in the fall of 2005. This provides strong validation.
In order to prove on the road what we've proven in the lab, we are joining leading transportation, logistics, and insurance companies into an industry alliance to test the product. As part of the PSAASA (PATH System Accident Avoider Safety Alliance), the member companies will pool their safety and speed data to create routes to guide the member trucking companies away from known trouble times/locations. Together we will measure the rate of accidents during the trial period compared to 1) previous years and 2) where the vehicles would have gone without our routes. The alliance members will subsidize PATH's costs during the trial period. In exchange the trucking companies will get the product at cost for a 3-5 year period of time after the field trials, and insurance/logistics companies will receive a 3-year exclusive on marketing the product in conjunction with a reduced insurance rate. Following the exclusivity period, we continue to license the product to aggressive resellers and will consider expanding our own sales force as well.
We have identified several target industries that can immediately benefit from our products:
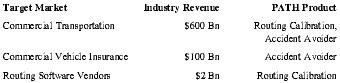
| Target Market | Industry Revenue | PATH Product |
| Commercial Transportation | $600 Bn | Routing Calibration, Accident Avoider |
| Commercial Vehicle Insurance | $100 Bn | Accident Avoider |
| Routing Software Vendors | $2 Bn | Routing Calibration |
We have approached over 20 companies regarding partnership opportunities to develop, road test, and introduce these products:
- Routing Software —We have strong interest from Trailways, Telecommute, GLOBAL, and the Travellers regarding the Routing Calibration product.
- Insurance —We have strong interest from Mutual of Omaha and Progressive Insurance for the Accident Avoider product.
- Transportation —Collier's National (one of the largest trucking companies in the U.S.) has agreed to become our first charter member in the alliance. We have strong interest from Freightways Custom Critical in the Accident Avoider product.
- Tracking Companies —We have strong interest from Magellan, Altec, and TravelWell about co-marketing PATH's extensions to their platforms.
We are scheduling meetings to follow up with this broad set of leads and others over the next few months. This is a great deal for them, as they get a compelling money saver/earner for some fraction of the development costs, while PATH avoids the need to raise large amounts of capital.
Beyond the industry categories above, we also are targeting the following:
- Leverage our database product with established Third Party Logistics (3PL) providers who already have established relationships with medium and large trucking companies. Companies such as Smithson Systems Group, Penske Logistics, and Ryder logistics already have large customer bases. Here, PATH is another value-added product to sell to these customers to further improve their operations. Further, those logistics companies typically have the large staffs required to effect a complicated installation.
- Form technology partnerships with the smartest people in the transportation business. PATH's EP algorithm is a true scientific breakthrough in network management. Transportation companies with large fleets such as UPS and Federal Express will disproportionately benefit from employing it. We are in discussions with these companies about structuring a technology enhancement project that will build out the capabilities of EP.
The PATH marketing plan will focus on trade advertising, industry conferences, and public relations activities. These tactics have the greatest impact in generating sales leads and pre-qualifying the early adopters in the commercial market.
BUSINESS/PRICING MODEL
PATH's core product is the database that allows users to a) predict a series of trip durations under a variety of conditions and b) identify and document operational inefficiencies. Depending on the type of client and their particular needs, the information database can be packaged in a number of ways:
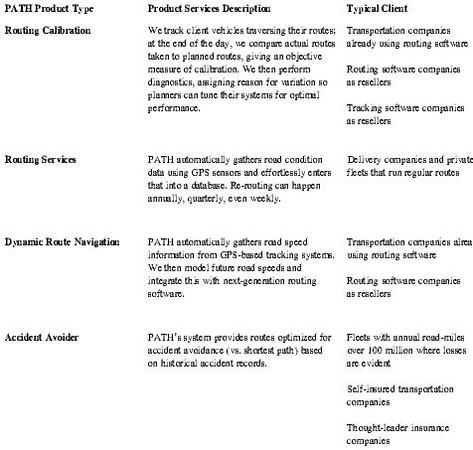
| PATH Product Type | Product Services Description | Typical Client |
| Routing Calibration | We track client vehicles traversing their routes; at the end of the day, we compare actual routes taken to planned routes, giving an objective measure of calibration. We then perform diagnostics, assigning reason for variation so planners can tune their systems for optimal performance. | Transportation companies already using routing software |
| Routing software companies as resellers | ||
| Tracking software companies as resellers | ||
| Routing Services | PATH automatically gathers road condition data using GPS sensors and effortlessly enters that into a database. Re-routing can happen annually, quarterly, even weekly. | Delivery companies and private fleets that run regular routes |
| Dynamic Route Navigation | PATH automatically gathers road speed information from GPS-based tracking systems. We then model future road speeds and integrate this with next-generation routing software. | Transportation companies already using routing software |
| Routing software companies as resellers | ||
| Accident Avoider | PATH's system provides routes optimized for accident avoidance (vs. shortest path) based on historical accident records. | Fleets with annual road-miles over 100 million where losses are evident |
| Self-insured transportation companies | ||
| Thought-leader insurance companies |
All of the above will be priced based on a monthly revenue per rig model. In addition, PATH charges fees for installation, consulting, and engineering customization at an hourly rate.
INVESTMENT & FINANCING STRATEGY
PATH Systems has achieved its current position with internal financing from Philip Moon and sweat equity from the employees and option holders who have contributed services at rates well below their value. We are seeking wherever possible to minimize dilution by leveraging government funding. We are in the process of closing a $250,000 loan from the city of Pittsburgh and have applied to several state programs.
There is a need and an appetite for equity financing in the near term to supplement the other sources while we drive the company toward cash flow break-even. Those funds—ranging from $250,000-$750,000—will be used to finish prototypes and fund sales call activities with customers. Since we feel our early customers will get us to cash flow break-even and we don't intend to grow any faster than we can internally finance, this may be the last time we seek financing. There is a possibility, however, that following a successful trial and the expiration of the exclusivity of our charter partners that we may return for financing in the $5 million range to build a sales force and sell our proven products into the industry. This is only one of several options we will consider and isn't expected to occur until 2008 when we will likely have a significant valuation to support such an offering with minimal dilution.
This investment shares many of the qualities of a venture capital investment:
- We can enjoy high growth potential in a large overlooked market
- We are introducing new proprietary technology with significant value add
- As an enterprise software provider, we expect to enjoy high levels of profit
We also have two areas where we differ from traditional venture investments:
- We are not designed for a quick liquidity event (or a "flip"). We are slavishly devoted to creating the best value for our customers. We will not roll out a product until our beta customers tell us it's ready for the market.
- We do not have voracious cash needs. Unlike many venture-funded companies that require $15-$25 million or more to break even, we expect to do so with $1 million.
As such we are seeking an investor who is knowledgeable about transportation, technology, and logistics who can comfortably invest $100,000-$250,000. This investor will consider a $25 million company with 80 percent gross margins a success. Regarding liquidity, we may choose to pursue some traditional methods such as an Initial Public Offering or a sale to a number of large strategic partners, but we also intend to keep dividend payments as an option as well. In any event, the earliest an investor should expect a return is following the field trials (in Q4 2005).
Exit Strategy
We expect to offer investors a liquidity event through a sale of the company, probably to one of the key partners with whom we will build the business. It also is possible the IPO market will recover in a reasonable time frame, providing an alternative liquidity vehicle.
FINANCIAL PLAN
PATH Systems was developed with a sound business model and efficient capital use in mind. The primary goal of the business is to make money. Each PATH product and service line is designed and priced to generate profits for the business. The PATH Financial Plan includes detailed financial projections for the first two years and summary information/assumptions for years three through five.
Key Financial Characteristics
- Recurring Revenues
- Attractive and Sustainable Gross Profit Margins
- Scalable Sales and Distribution Plan
- Low labor and capital requirements
Assets Required
The majority of our assets are technology-based, such as database servers and communications equipment. Where it makes sense for control and security purposes, we will purchase and host the necessary equipment which is easily sourced. For database and web server facilities, PATH plans to lease equipment and hosting services from reputable providers.
Accounts Receivables
Our budget calculates accounts receivables being paid within 45 days.
Management Compensation
Per the Headcount spreadsheet in the financial statement section below, PATH will gradually ramp up management salaries, from 50 percent in year one to 100 percent by the end of year two.
Cash Strategy
To cover any short-term cash shortfalls, PATH will look to personal funds from the owner and/or refinancing of any current debt agreements.
Financial Statements
- Model Drivers, Assumptions
- Income Statement
- Balance Sheet
- Cash Flow
- Breakeven Analysis
This page left intentionally blank to accommodate tabular matter following.
Model Drivers, Assumptions
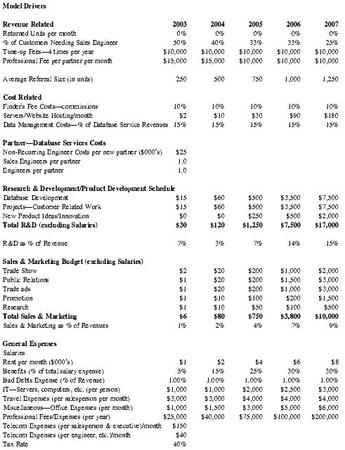
| Revenue Related | 2003 | 2004 | 2005 | 2006 | 2007 |
| Returned Units per month | 0% | 0% | 0% | 0% | 0% |
| % of Customers Needing Sales Engineer | 50% | 40% | 33% | 33% | 25% |
| Tune-up Fees—4 times per year | $10,000 | $10,000 | $10,000 | $10,000 | $10,000 |
| Professional Fee per partner per month | $15,000 | $15,000 | $10,000 | $10,000 | $10,000 |
| Average Referral Size (in units) | 250 | 500 | 750 | 1,000 | 1,250 |
| Cost Related | |||||
| Finder's Fee Costs—commissions | 10% | 10% | 10% | 10% | 10% |
| Servers/Website Hosting/month | $2 | $10 | $30 | $90 | $180 |
| Data Management Costs—% of Database Service Revenues | 15% | 15% | 15% | 15% | 15% |
| Partner—Database Services Costs | |||||
| Non-Recurring Engineer Costs per new partner ($000's) | $25 | ||||
| Sales Engineers per partner | 1.0 | ||||
| Engineers per partner | 1.0 | ||||
| Research & Development/Product Development Schedule | |||||
| Database Development | $15 | $60 | $500 | $3,500 | $7,500 |
| Projects—Customer Related Work | $15 | $60 | $500 | $3,500 | $7,500 |
| New Product Ideas/Innovation | $0 | $0 | $250 | $500 | $2,000 |
| Total R&D (excluding Salaries) | $30 | $120 | $1,250 | $7,500 | $17,000 |
| R&D as % of Revenue | 7% | 3% | 7% | 14% | 15% |
| Sales & Marketing Budget (excluding Salaries) | |||||
| Trade Show | $2 | $20 | $200 | $1,000 | $2,000 |
| Public Relations | $1 | $20 | $200 | $1,500 | $3,000 |
| Trade ads | $1 | $20 | $200 | $1,000 | $3,000 |
| Promotion | $1 | $10 | $100 | $200 | $1,500 |
| Research | $1 | $10 | $50 | $100 | $500 |
| Total Sales & Marketing | $6 | $80 | $750 | $3,800 | $10,000 |
| Sales & Marketing as % of Revenues | 1% | 2% | 4% | 7% | 9% |
| General Expenses | |||||
| Salaries | |||||
| Rent per month ($000's) | $1 | $2 | $4 | $6 | $8 |
| Benefits (% of total salary expense) | 5% | 15% | 25% | 30% | 30% |
| Bad Debts Expense (% of Revenue) | 1.00% | 1.00% | 1.00% | 1.00% | 1.00% |
| IT—Servers, computers, etc. (per person) | $1,000 | $1,000 | $2,000 | $2,500 | $3,000 |
| Travel Expenses (per salesperson per month) | $3,000 | $3,000 | $4,000 | $4,000 | $4,000 |
| Miscellaneous—Office Expenses (per month) | $1,000 | $1,500 | $3,000 | $5,000 | $6,000 |
| Professional Fees/Expenses (per year) | $25,000 | $40,000 | $75,000 | $100,000 | $200,000 |
| Telecom Expenses (per salesperson & executive)/month | $150 | ||||
| Telecom Expenses (per engineer, etc.)/month | $40 | ||||
| Tax Rate | 40% | ||||
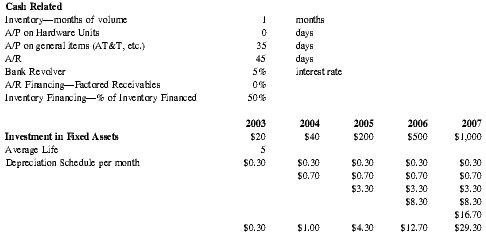
| Cash Related | |||||
| Inventory—months of volume | 1 | months | |||
| A/P on Hardware Units | 0 | days | |||
| A/P on general items (AT&T, etc.) | 35 | days | |||
| A/R | 45 | days | |||
| Bank Revolver | 5% | interest rate | |||
| A/R Financing—Factored Receivables | 0% | ||||
| Inventory Financing—% of Inventory Financed | 50% | ||||
| 2003 | 2004 | 2005 | 2006 | 2007 | |
| Investment in Fixed Assets | $20 | $40 | $200 | $500 | $1,000 |
| Average Life | 5 | ||||
| Depreciation Schedule per month | $0.30 | $0.30 | $0.30 | $0.30 | $0.30 |
| $0.70 | $0.70 | $0.70 | $0.70 | ||
| $3.30 | $3.30 | $3.30 | |||
| $8.30 | $8.30 | ||||
| $16.70 | |||||
| $0.30 | $1.00 | $4.30 | $12.70 | $29.30 | |
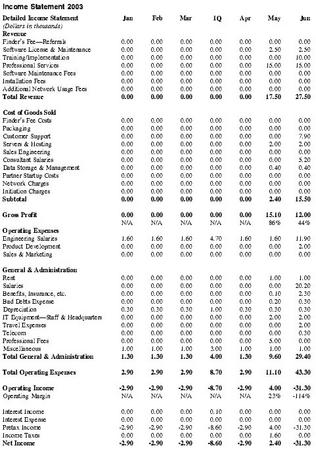
| Detailed Income Statement (Dollars in thousands) | Jan | Feb | Mar | 1Q | Apr | May | Jun |
| Revenue | |||||||
| Finder's Fee—Referrals | 0.00 | 0.00 | 0.00 | 0.00 | 0.00 | 0.00 | 0.00 |
| Software License & Maintenance | 0.00 | 0.00 | 0.00 | 0.00 | 0.00 | 2.50 | 2.50 |
| Training/Implementation | 0.00 | 0.00 | 0.00 | 0.00 | 0.00 | 0.00 | 10.00 |
| Professional Services | 0.00 | 0.00 | 0.00 | 0.00 | 0.00 | 15.00 | 15.00 |
| Software Maintenance Fees | 0.00 | 0.00 | 0.00 | 0.00 | 0.00 | 0.00 | 0.00 |
| Installation Fees | 0.00 | 0.00 | 0.00 | 0.00 | 0.00 | 0.00 | 0.00 |
| Additional Network Usage Fees | 0.00 | 0.00 | 0.00 | 0.00 | 0.00 | 0.00 | 0.00 |
| Total Revenue | 0.00 | 0.00 | 0.00 | 0.00 | 0.00 | 17.50 | 27.50 |
| Cost of Goods Sold | |||||||
| Finder's Fee Costs | 0.00 | 0.00 | 0.00 | 0.00 | 0.00 | 0.00 | 0.00 |
| Packaging | 0.00 | 0.00 | 0.00 | 0.00 | 0.00 | 0.00 | 0.00 |
| Customer Support | 0.00 | 0.00 | 0.00 | 0.00 | 0.00 | 0.00 | 7.90 |
| Servers & Hosting | 0.00 | 0.00 | 0.00 | 0.00 | 0.00 | 2.00 | 2.00 |
| Sales Engineering | 0.00 | 0.00 | 0.00 | 0.00 | 0.00 | 0.00 | 0.00 |
| Consultant Salaries | 0.00 | 0.00 | 0.00 | 0.00 | 0.00 | 0.00 | 5.20 |
| Data Storage & Management | 0.00 | 0.00 | 0.00 | 0.00 | 0.00 | 0.40 | 0.40 |
| Partner Startup Costs | 0.00 | 0.00 | 0.00 | 0.00 | 0.00 | 0.00 | 0.00 |
| Network Charges | 0.00 | 0.00 | 0.00 | 0.00 | 0.00 | 0.00 | 0.00 |
| Initiation Charges | 0.00 | 0.00 | 0.00 | 0.00 | 0.00 | 0.00 | 0.00 |
| Subtotal | 0.00 | 0.00 | 0.00 | 0.00 | 0.00 | 2.40 | 15.50 |
| Gross Profit | 0.00 | 0.00 | 0.00 | 0.00 | 0.00 | 15.10 | 12.00 |
| N/A | N/A | N/A | N/A | N/A | 86% | 44% | |
| Operating Expenses | |||||||
| Engineering Salaries | 1.60 | 1.60 | 1.60 | 4.70 | 1.60 | 1.60 | 11.90 |
| Product Development | 0.00 | 0.00 | 0.00 | 0.00 | 0.00 | 0.00 | 2.00 |
| Sales & Marketing | 0.00 | 0.00 | 0.00 | 0.00 | 0.00 | 0.00 | 0.00 |
| General & Administration | |||||||
| Rent | 0.00 | 0.00 | 0.00 | 0.00 | 0.00 | 1.00 | 1.00 |
| Salaries | 0.00 | 0.00 | 0.00 | 0.00 | 0.00 | 0.00 | 20.20 |
| Benefits, Insurance, etc. | 0.00 | 0.00 | 0.00 | 0.00 | 0.00 | 0.10 | 2.30 |
| Bad Debts Expense | 0.00 | 0.00 | 0.00 | 0.00 | 0.00 | 0.20 | 0.30 |
| Depreciation | 0.30 | 0.30 | 0.30 | 1.00 | 0.30 | 0.30 | 0.30 |
| IT Equipment—Staff & Headquarters | 0.00 | 0.00 | 0.00 | 0.00 | 0.00 | 2.00 | 2.00 |
| Travel Expenses | 0.00 | 0.00 | 0.00 | 0.00 | 0.00 | 0.00 | 2.00 |
| Telecom | 0.00 | 0.00 | 0.00 | 0.00 | 0.00 | 0.00 | 0.30 |
| Professional Fees | 0.00 | 0.00 | 0.00 | 0.00 | 0.00 | 5.00 | 0.00 |
| Miscellaneous | 1.00 | 1.00 | 1.00 | 3.00 | 1.00 | 1.00 | 1.00 |
| Total General & Administration | 1.30 | 1.30 | 1.30 | 4.00 | 1.30 | 9.60 | 29.40 |
| Total Operating Expenses | 2.90 | 2.90 | 2.90 | 8.70 | 2.90 | 11.10 | 43.30 |
| Operating Income | -2.90 | -2.90 | -2.90 | -8.70 | -2.90 | 4.00 | -31.30 |
| Operating Margin | N/A | N/A | N/A | N/A | N/A | 23% | -114% |
| Interest Income | 0.00 | 0.00 | 0.00 | 0.10 | 0.00 | 0.00 | 0.00 |
| Interest Expense | 0.00 | 0.00 | 0.00 | 0.00 | 0.00 | 0.00 | 0.00 |
| Pretax Income | -2.90 | -2.90 | -2.90 | -8.60 | -2.90 | 4.00 | -31.30 |
| Income Taxes | 0.00 | 0.00 | 0.00 | 0.00 | 0.00 | 1.60 | 0.00 |
| Net Income | -2.90 | -2.90 | -2.90 | -8.60 | -2.90 | 2.40 | -31.30 |
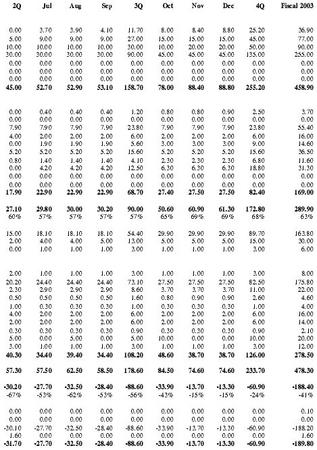
| 2Q | Jul | Aug | Sep | 3Q | Oct | Nov | Dec | 4Q | Fiscal 2003 |
| 0.00 | 3.70 | 3.90 | 4.10 | 11.70 | 8.00 | 8.40 | 8.80 | 25.20 | 36.90 |
| 5.00 | 9.00 | 9.00 | 9.00 | 27.00 | 15.00 | 15.00 | 15.00 | 45.00 | 77.00 |
| 10.00 | 10.00 | 10.00 | 10.00 | 30.00 | 10.00 | 20.00 | 20.00 | 50.00 | 90.00 |
| 30.00 | 30.00 | 30.00 | 30.00 | 90.00 | 45.00 | 45.00 | 45.00 | 135.00 | 255.00 |
| 0.00 | 0.00 | 0.00 | 0.00 | 0.00 | 0.00 | 0.00 | 0.00 | 0.00 | 0.00 |
| 0.00 | 0.00 | 0.00 | 0.00 | 0.00 | 0.00 | 0.00 | 0.00 | 0.00 | 0.00 |
| 0.00 | 0.00 | 0.00 | 0.00 | 0.00 | 0.00 | 0.00 | 0.00 | 0.00 | 0.00 |
| 45.00 | 52.70 | 52.90 | 53.10 | 158.70 | 78.00 | 88.40 | 88.80 | 255.20 | 458.90 |
| 0.00 | 0.40 | 0.40 | 0.40 | 1.20 | 0.80 | 0.80 | 0.90 | 2.50 | 3.70 |
| 0.00 | 0.00 | 0.00 | 0.00 | 0.00 | 0.00 | 0.00 | 0.00 | 0.00 | 0.00 |
| 7.90 | 7.90 | 7.90 | 7.90 | 23.80 | 7.90 | 7.90 | 7.90 | 23.80 | 55.40 |
| 4.00 | 2.00 | 2.00 | 2.00 | 6.00 | 2.00 | 2.00 | 2.00 | 6.00 | 16.00 |
| 0.00 | 1.90 | 1.90 | 1.90 | 5.60 | 3.00 | 3.00 | 3.00 | 9.00 | 14.60 |
| 5.20 | 5.20 | 5.20 | 5.20 | 15.60 | 5.20 | 5.20 | 5.20 | 15.60 | 36.50 |
| 0.80 | 1.40 | 1.40 | 1.40 | 4.10 | 2.30 | 2.30 | 2.30 | 6.80 | 11.60 |
| 0.00 | 4.20 | 4.20 | 4.20 | 12.50 | 6.30 | 6.30 | 6.30 | 18.80 | 31.30 |
| 0.00 | 0.00 | 0.00 | 0.00 | 0.00 | 0.00 | 0.00 | 0.00 | 0.00 | 0.00 |
| 0.00 | 0.00 | 0.00 | 0.00 | 0.00 | 0.00 | 0.00 | 0.00 | 0.00 | 0.00 |
| 17.90 | 22.90 | 22.90 | 22.90 | 68.70 | 27.40 | 27.50 | 27.50 | 82.40 | 169.00 |
| 27.10 | 29.80 | 30.00 | 30.20 | 90.00 | 50.60 | 60.90 | 61.30 | 172.80 | 289.90 |
| 60% | 57% | 57% | 57% | 57% | 65% | 69% | 69% | 68% | 63% |
| 15.00 | 18.10 | 18.10 | 18.10 | 54.40 | 29.90 | 29.90 | 29.90 | 89.70 | 163.80 |
| 2.00 | 4.00 | 4.00 | 5.00 | 13.00 | 5.00 | 5.00 | 5.00 | 15.00 | 30.00 |
| 0.00 | 1.00 | 1.00 | 1.00 | 3.00 | 1.00 | 1.00 | 1.00 | 3.00 | 6.00 |
| 2.00 | 1.00 | 1.00 | 1.00 | 3.00 | 1.00 | 1.00 | 1.00 | 3.00 | 8.00 |
| 20.20 | 24.40 | 24.40 | 24.40 | 73.10 | 27.50 | 27.50 | 27.50 | 82.50 | 175.80 |
| 2.30 | 2.90 | 2.90 | 2.90 | 8.60 | 3.70 | 3.70 | 3.70 | 11.00 | 22.00 |
| 0.50 | 0.50 | 0.50 | 0.50 | 1.60 | 0.80 | 0.90 | 0.90 | 2.60 | 4.60 |
| 1.00 | 0.30 | 0.30 | 0.30 | 1.00 | 0.30 | 0.30 | 0.30 | 1.00 | 4.00 |
| 4.00 | 2.00 | 2.00 | 2.00 | 6.00 | 2.00 | 2.00 | 2.00 | 6.00 | 16.00 |
| 2.00 | 2.00 | 2.00 | 2.00 | 6.00 | 2.00 | 2.00 | 2.00 | 6.00 | 14.00 |
| 0.30 | 0.30 | 0.30 | 0.30 | 0.90 | 0.30 | 0.30 | 0.30 | 0.90 | 2.10 |
| 5.00 | 0.00 | 5.00 | 0.00 | 5.00 | 10.00 | 0.00 | 0.00 | 10.00 | 20.00 |
| 3.00 | 1.00 | 1.00 | 1.00 | 3.00 | 1.00 | 1.00 | 1.00 | 3.00 | 12.00 |
| 40.30 | 34.40 | 39.40 | 34.40 | 108.20 | 48.60 | 38.70 | 38.70 | 126.00 | 278.50 |
| 57.30 | 57.50 | 62.50 | 58.50 | 178.60 | 84.50 | 74.60 | 74.60 | 233.70 | 478.30 |
| -30.20 | -27.70 | -32.50 | -28.40 | -88.60 | -33.90 | -13.70 | -13.30 | -60.90 | -188.40 |
| -67% | -53% | -62% | -53% | -56% | -43% | -15% | -15% | -24% | -41% |
| 0.00 | 0.00 | 0.00 | 0.00 | 0.00 | 0.00 | 0.00 | 0.00 | 0.00 | 0.10 |
| 0.00 | 0.00 | 0.00 | 0.00 | 0.00 | 0.00 | 0.00 | 0.00 | 0.00 | 0.00 |
| -30.10 | -27.70 | -32.50 | -28.40 | -88.60 | -33.90 | -13.70 | -13.30 | -60.90 | -188.20 |
| 1.60 | 0.00 | 0.00 | 0.00 | 0.00 | 0.00 | 0.00 | 0.00 | 0.00 | 1.60 |
| -31.70 | -27.70 | -32.50 | -28.40 | -88.60 | -33.90 | -13.70 | -13.30 | -60.90 | -189.80 |
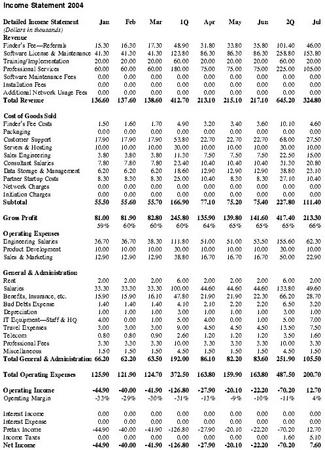
| Detailed Income Statement (Dollars in thousands) | Jan | Feb | Mar | 1Q | Apr | May | Jun | 2Q | Jul |
| Revenue | |||||||||
| Finder's Fee—Referrals | 15.30 | 16.30 | 17.30 | 48.90 | 31.80 | 33.80 | 35.80 | 101.40 | 46.00 |
| Software License & Maintenance | 41.30 | 41.30 | 41.30 | 123.80 | 86.30 | 86.30 | 86.30 | 258.80 | 153.80 |
| Training/Implementation | 20.00 | 20.00 | 20.00 | 60.00 | 20.00 | 20.00 | 20.00 | 60.00 | 20.00 |
| Professional Services | 60.00 | 60.00 | 60.00 | 180.00 | 75.00 | 75.00 | 75.00 | 225.00 | 105.00 |
| Software Maintenance Fees | 0.00 | 0.00 | 0.00 | 0.00 | 0.00 | 0.00 | 0.00 | 0.00 | 0.00 |
| Installation Fees | 0.00 | 0.00 | 0.00 | 0.00 | 0.00 | 0.00 | 0.00 | 0.00 | 0.00 |
| Additional Network Usage Fees | 0.00 | 0.00 | 0.00 | 0.00 | 0.00 | 0.00 | 0.00 | 0.00 | 0.00 |
| Total Revenue | 136.60 | 137.60 | 138.60 | 412.70 | 213.10 | 215.10 | 217.10 | 645.20 | 324.80 |
| Cost of Goods Sold | |||||||||
| Finder's Fee Costs | 1.50 | 1.60 | 1.70 | 4.90 | 3.20 | 3.40 | 3.60 | 10.10 | 4.60 |
| Packaging | 0.00 | 0.00 | 0.00 | 0.00 | 0.00 | 0.00 | 0.00 | 0.00 | 0.00 |
| Customer Support | 17.90 | 17.90 | 17.90 | 53.80 | 22.70 | 22.70 | 22.70 | 68.00 | 27.50 |
| Servers & Hosting | 10.00 | 10.00 | 10.00 | 30.00 | 10.00 | 10.00 | 10.00 | 30.00 | 10.00 |
| Sales Engineering | 3.80 | 3.80 | 3.80 | 11.30 | 7.50 | 7.50 | 7.50 | 22.50 | 15.00 |
| Consultant Salaries | 7.80 | 7.80 | 7.80 | 23.40 | 10.40 | 10.40 | 10.40 | 31.30 | 20.80 |
| Data Storage & Management | 6.20 | 6.20 | 6.20 | 18.60 | 12.90 | 12.90 | 12.90 | 38.80 | 23.10 |
| Partner Startup Costs | 8.30 | 8.30 | 8.30 | 25.00 | 10.40 | 8.30 | 8.30 | 27.10 | 10.40 |
| Network Charges | 0.00 | 0.00 | 0.00 | 0.00 | 0.00 | 0.00 | 0.00 | 0.00 | 0.00 |
| Initiation Charges | 0.00 | 0.00 | 0.00 | 0.00 | 0.00 | 0.00 | 0.00 | 0.00 | 0.00 |
| Subtotal | 55.50 | 55.60 | 55.70 | 166.90 | 77.10 | 75.20 | 75.40 | 227.80 | 111.40 |
| Gross Profit | 81.00 | 81.90 | 82.80 | 245.80 | 135.90 | 139.80 | 141.60 | 417.40 | 213.30 |
| 59% | 60% | 60% | 60% | 64% | 65% | 65% | 65% | 66% | |
| Operating Expenses | |||||||||
| Engineering Salaries | 36.70 | 36.70 | 38.30 | 111.80 | 51.00 | 51.00 | 53.50 | 155.60 | 62.30 |
| Product Development | 10.00 | 10.00 | 10.00 | 30.00 | 10.00 | 10.00 | 10.00 | 30.00 | 10.00 |
| Sales & Marketing | 12.90 | 12.90 | 12.90 | 38.80 | 16.70 | 16.70 | 16.70 | 50.00 | 22.90 |
| General & Administration | |||||||||
| Rent | 2.00 | 2.00 | 2.00 | 6.00 | 2.00 | 2.00 | 2.00 | 6.00 | 2.00 |
| Salaries | 33.30 | 33.30 | 33.30 | 100.00 | 44.60 | 44.60 | 44.60 | 133.80 | 49.60 |
| Benefits, Insurance, etc. | 15.90 | 15.90 | 16.10 | 47.80 | 21.90 | 21.90 | 22.30 | 66.20 | 28.70 |
| Bad Debts Expense | 1.40 | 1.40 | 1.40 | 4.10 | 2.10 | 2.20 | 2.20 | 6.50 | 3.20 |
| Depreciation | 1.00 | 1.00 | 1.00 | 3.00 | 1.00 | 1.00 | 1.00 | 3.00 | 1.00 |
| IT Equipment—Staff & HQ | 4.00 | 0.00 | 1.00 | 5.00 | 4.00 | 0.00 | 1.00 | 5.00 | 7.00 |
| Travel Expenses | 3.00 | 3.00 | 3.00 | 9.00 | 4.50 | 4.50 | 4.50 | 13.50 | 7.50 |
| Telecom | 0.80 | 0.80 | 0.90 | 2.60 | 1.20 | 1.20 | 1.20 | 3.50 | 1.60 |
| Professional Fees | 3.30 | 3.30 | 3.30 | 10.00 | 3.30 | 3.30 | 3.30 | 10.00 | 3.30 |
| Miscellaneous | 1.50 | 1.50 | 1.50 | 4.50 | 1.50 | 1.50 | 1.50 | 4.50 | 1.50 |
| Total General & Administration | 66.20 | 62.20 | 63.50 | 192.00 | 86.10 | 82.20 | 83.60 | 251.90 | 105.50 |
| Total Operating Expenses | 125.90 | 121.90 | 124.70 | 372.50 | 163.80 | 159.90 | 163.80 | 487.50 | 200.70 |
| Operating Income | -44.90 | -40.00 | -41.90 | -126.80 | -27.90 | -20.10 | -22.20 | -70.20 | 12.70 |
| Operating Margin | -33% | -29% | -30% | -31% | -13% | -9% | -10% | -11% | 4% |
| Interest Income | 0.00 | 0.00 | 0.00 | 0.00 | 0.00 | 0.00 | 0.00 | 0.00 | 0.00 |
| Interest Expense | 0.00 | 0.00 | 0.00 | 0.00 | 0.00 | 0.00 | 0.00 | 0.00 | 0.00 |
| Pretax Income | -44.90 | -40.00 | -41.90 | -126.80 | -27.90 | -20.10 | -22.20 | -70.20 | 12.70 |
| Income Taxes | 0.00 | 0.00 | 0.00 | 0.00 | 0.00 | 0.00 | 0.00 | 1.60 | 5.10 |
| Net Income | -44.90 | -40.00 | -41.90 | -126.80 | -27.90 | -20.10 | -22.20 | -70.20 | 7.60 |

| Aug | Sep | 3Q | Oct | Nov | Dec | 4Q | Fiscal 2004 | Fiscal 2005 | Fiscal 2006 | Fiscal 2007 |
| 49.20 | 52.40 | 147.60 | 64.40 | 68.40 | 72.40 | 205.20 | 801.00 | 2,333.40 | 4,307.40 | 7,566.00 |
| 153.80 | 153.80 | 461.30 | 243.80 | 243.80 | 243.80 | 731.30 | 2,418.80 | 11,565.00 | 44,220.00 | 101,820.00 |
| 20.00 | 20.00 | 60.00 | 30.00 | 30.00 | 30.00 | 90.00 | 450.00 | 920.00 | 1,400.00 | 1,800.00 |
| 105.00 | 105.00 | 315.00 | 135.00 | 135.00 | 135.00 | 405.00 | 1,845.00 | 2,040.00 | 3,240.00 | 4,440.00 |
| 0.00 | 0.00 | 0.00 | 0.00 | 0.00 | 0.00 | 0.00 | 0.00 | 0.00 | 0.00 | 0.00 |
| 0.00 | 0.00 | 0.00 | 0.00 | 0.00 | 0.00 | 0.00 | 0.00 | 0.00 | 0.00 | 0.00 |
| 0.00 | 0.00 | 0.00 | 0.00 | 0.00 | 0.00 | 0.00 | 0.00 | 0.00 | 0.00 | 0.00 |
| 328.00 | 331.20 | 983.90 | 473.20 | 477.20 | 481.20 | 1,431.50 | 5,514.80 | 16,858.40 | 53,167.40 | 115,626.00 |
| 4.90 | 5.20 | 14.80 | 6.40 | 6.80 | 7.20 | 20.50 | 50.30 | 233.30 | 430.70 | 756.60 |
| 0.00 | 0.00 | 0.00 | 0.00 | 0.00 | 0.00 | 0.00 | 0.00 | 0.00 | 0.00 | 0.00 |
| 27.50 | 27.50 | 82.50 | 30.80 | 30.80 | 30.80 | 92.50 | 296.80 | 850.00 | 1,250.00 | 1,650.00 |
| 10.00 | 10.00 | 30.00 | 10.00 | 10.00 | 10.00 | 30.00 | 120.00 | 360.00 | 1,080.00 | 2,160.00 |
| 15.00 | 15.00 | 45.00 | 15.00 | 15.00 | 15.00 | 45.00 | 123.80 | 450.00 | 900.00 | 1,350.00 |
| 20.80 | 20.80 | 62.50 | 31.30 | 31.30 | 31.30 | 93.80 | 210.90 | 1,125.00 | 1,750.00 | 2,375.00 |
| 23.10 | 23.10 | 69.20 | 36.60 | 36.60 | 36.60 | 109.70 | 236.30 | 1,734.80 | 6,633.00 | 15,273.00 |
| 10.40 | 10.40 | 31.30 | 12.50 | 12.50 | 12.50 | 37.50 | 120.80 | 200.00 | 250.00 | 250.00 |
| 0.00 | 0.00 | 0.00 | 0.00 | 0.00 | 0.00 | 0.00 | 0.00 | 0.00 | 0.00 | 0.00 |
| 0.00 | 0.00 | 0.00 | 0.00 | 0.00 | 0.00 | 0.00 | 0.00 | 0.00 | 0.00 | 0.00 |
| 111.70 | 112.10 | 335.20 | 142.60 | 143.00 | 143.40 | 429.00 | 1,158.80 | 4,953.10 | 12,293.70 | 23,814.60 |
| 216.20 | 219.10 | 648.70 | 330.60 | 334.20 | 337.80 | 1,002.50 | 2,314.30 | 11,905.30 | 40,873.70 | 91,811.40 |
| 66% | 66% | 66% | 70% | 70% | 70% | 70% | 42% | 71% | 77% | 79% |
| 62.30 | 62.30 | 186.90 | 71.00 | 71.00 | 71.00 | 213.10 | 667.40 | 1,250.00 | 2,210.00 | 3,020.00 |
| 10.00 | 10.00 | 30.00 | 10.00 | 10.00 | 10.00 | 30.00 | 120.00 | 1,250.00 | 7,500.00 | 17,000.00 |
| 22.90 | 22.90 | 68.80 | 22.90 | 22.90 | 22.90 | 68.80 | 226.30 | 1,155.00 | 4,280.00 | 10,555.00 |
| 2.00 | 2.00 | 6.00 | 2.00 | 2.00 | 2.00 | 6.00 | 24.00 | 48.00 | 72.00 | 96.00 |
| 49.60 | 49.60 | 148.80 | 49.60 | 49.60 | 49.60 | 148.80 | 531.30 | 865.00 | 1,115.00 | 1,355.00 |
| 28.70 | 28.70 | 86.20 | 32.10 | 32.10 | 32.10 | 96.30 | 296.40 | 1,236.30 | 2,311.50 | 3,091.50 |
| 3.30 | 3.30 | 9.80 | 4.70 | 4.80 | 4.80 | 14.30 | 34.70 | 168.60 | 531.70 | 1,156.30 |
| 1.00 | 1.00 | 3.00 | 1.00 | 1.00 | 1.00 | 3.00 | 12.00 | 52.00 | 152.00 | 352.00 |
| 0.00 | 0.00 | 7.00 | 3.00 | 0.00 | 0.00 | 3.00 | 20.00 | 32.00 | 38.00 | 36.00 |
| 7.50 | 7.50 | 22.50 | 7.50 | 7.50 | 7.50 | 22.50 | 67.50 | 192.00 | 240.00 | 288.00 |
| 1.60 | 1.60 | 4.80 | 1.70 | 1.70 | 1.70 | 5.10 | 16.00 | 40.50 | 60.10 | 78.70 |
| 3.30 | 3.30 | 10.00 | 3.30 | 3.30 | 3.30 | 10.00 | 40.00 | 75.00 | 100.00 | 200.00 |
| 1.50 | 1.50 | 4.50 | 1.50 | 1.50 | 1.50 | 4.50 | 18.00 | 36.00 | 60.00 | 72.00 |
| 98.50 | 98.50 | 302.50 | 106.50 | 103.50 | 103.50 | 313.50 | 1,059.90 | 2,745.30 | 4,680.20 | 6,725.40 |
| 193.70 | 193.70 | 588.10 | 210.40 | 207.50 | 207.50 | 625.40 | 2,073.50 | 6,400.30 | 18,670.20 | 37,300.40 |
| 22.50 | 22.40 | 60.50 | 120.20 | 126.70 | 130.30 | 377.10 | 240.70 | 5,505.00 | 22,203.40 | 54,511.00 |
| 7% | 8% | 6% | 25% | 27% | 27% | 26% | 4% | 33% | 42% | 47% |
| 0.00 | 0.00 | 0.00 | 0.00 | 0.00 | 0.00 | 0.00 | 0.00 | 0.00 | 42.30 | 245.20 |
| 0.00 | 0.00 | 0.00 | 0.00 | 0.00 | 0.00 | 0.00 | 0.00 | 0.00 | 0.00 | 0.00 |
| 22.50 | 25.40 | 60.50 | 120.20 | 126.70 | 130.30 | 377.10 | 240.70 | 5,505.00 | 22,245.80 | 54,756.20 |
| 9.00 | 10.10 | 24.20 | 48.10 | 50.70 | 52.10 | 150.90 | 175.10 | 2,202.00 | 8,898.30 | 21,902.50 |
| 13.50 | 15.20 | 36.30 | 72.10 | 76.00 | 78.20 | 226.30 | 65.70 | 3,303.00 | 13,347.50 | 32,853.70 |
Balance Sheet
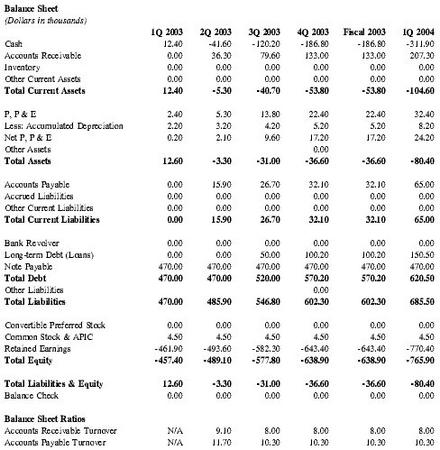
| 1Q 2003 | 2Q 2003 | 3Q 2003 | 4Q 2003 | Fiscal 2003 | 1Q 2004 | |
| Cash | 12.40 | -41.60 | -120.20 | -186.80 | -186.80 | -311.90 |
| Accounts Receivable | 0.00 | 36.30 | 79.60 | 133.00 | 133.00 | 207.30 |
| Inventory | 0.00 | 0.00 | 0.00 | 0.00 | 0.00 | 0.00 |
| Other Current Assets | 0.00 | 0.00 | 0.00 | 0.00 | 0.00 | 0.00 |
| Total Current Assets | 12.40 | -5.30 | -40.70 | -53.80 | -53.80 | -104.60 |
| P, P & E | 2.40 | 5.30 | 13.80 | 22.40 | 22.40 | 32.40 |
| Less: Accumulated Depreciation | 2.20 | 3.20 | 4.20 | 5.20 | 5.20 | 8.20 |
| Net P, P & E | 0.20 | 2.10 | 9.60 | 17.20 | 17.20 | 24.20 |
| Other Assets | 0.00 | |||||
| Total Assets | 12.60 | -3.30 | -31.00 | -36.60 | -36.60 | -80.40 |
| Accounts Payable | 0.00 | 15.90 | 26.70 | 32.10 | 32.10 | 65.00 |
| Accrued Liabilities | 0.00 | 0.00 | 0.00 | 0.00 | 0.00 | 0.00 |
| Other Current Liabilities | 0.00 | 0.00 | 0.00 | 0.00 | 0.00 | 0.00 |
| Total Current Liabilities | 0.00 | 15.90 | 26.70 | 32.10 | 32.10 | 65.00 |
| Bank Revolver | 0.00 | 0.00 | 0.00 | 0.00 | 0.00 | 0.00 |
| Long-term Debt (Loans) | 0.00 | 0.00 | 50.00 | 100.20 | 100.20 | 150.50 |
| Note Payable | 470.00 | 470.00 | 470.00 | 470.00 | 470.00 | 470.00 |
| Total Debt | 470.00 | 470.00 | 520.00 | 570.20 | 570.20 | 620.50 |
| Other Liabilities | 0.00 | |||||
| Total Liabilities | 470.00 | 485.90 | 546.80 | 602.30 | 602.30 | 685.50 |
| Convertible Preferred Stock | 0.00 | 0.00 | 0.00 | 0.00 | 0.00 | 0.00 |
| Common Stock & APIC | 4.50 | 4.50 | 4.50 | 4.50 | 4.50 | 4.50 |
| Retained Earnings | -461.90 | -493.60 | -582.30 | -643.40 | -643.40 | -770.40 |
| Total Equity | -457.40 | -489.10 | -577.80 | -638.90 | -638.90 | -765.90 |
| Total Liabilities & Equity | 12.60 | -3.30 | -31.00 | -36.60 | -36.60 | -80.40 |
| Balance Check | 0.00 | 0.00 | 0.00 | 0.00 | 0.00 | 0.00 |
| Balance Sheet Ratios | ||||||
| Accounts Receivable Turnover | N/A | 9.10 | 8.00 | 8.00 | 8.00 | 8.00 |
| Accounts Payable Turnover | N/A | 11.70 | 10.30 | 10.30 | 10.30 | 10.30 |
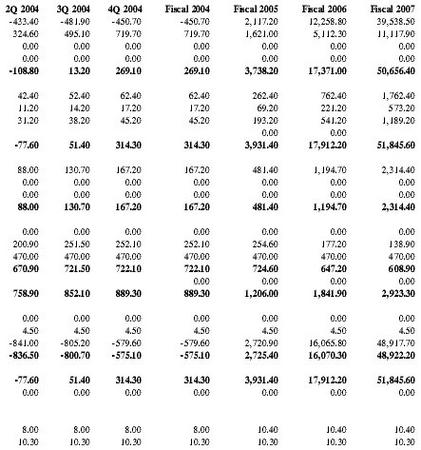
| 2Q 2004 | 3Q 2004 | 4Q 2004 | Fiscal 2004 | Fiscal 2005 | Fiscal 2006 | Fiscal 2007 |
| -433.40 | -481.90 | -450.70 | -450.70 | 2,117.20 | 12,258.80 | 39,538.50 |
| 324.60 | 495.10 | 719.70 | 719.70 | 1,621.00 | 5,112.30 | 11,117.90 |
| 0.00 | 0.00 | 0.00 | 0.00 | 0.00 | 0.00 | 0.00 |
| 0.00 | 0.00 | 0.00 | 0.00 | 0.00 | 0.00 | 0.00 |
| -108.80 | 13.20 | 269.10 | 269.10 | 3,738.20 | 17,371.00 | 50,656.40 |
| 42.40 | 52.40 | 62.40 | 62.40 | 262.40 | 762.40 | 1,762.40 |
| 11.20 | 14.20 | 17.20 | 17.20 | 69.20 | 221.20 | 573.20 |
| 31.20 | 38.20 | 45.20 | 45.20 | 193.20 | 541.20 | 1,189.20 |
| 0.00 | 0.00 | |||||
| -77.60 | 51.40 | 314.30 | 314.30 | 3,931.40 | 17,912.20 | 51,845.60 |
| 88.00 | 130.70 | 167.20 | 167.20 | 481.40 | 1,194.70 | 2,314.40 |
| 0.00 | 0.00 | 0.00 | 0.00 | 0.00 | 0.00 | 0.00 |
| 0.00 | 0.00 | 0.00 | 0.00 | 0.00 | 0.00 | 0.00 |
| 88.00 | 130.70 | 167.20 | 167.20 | 481.40 | 1,194.70 | 2,314.40 |
| 0.00 | 0.00 | 0.00 | 0.00 | 0.00 | 0.00 | 0.00 |
| 200.90 | 251.50 | 252.10 | 252.10 | 254.60 | 177.20 | 138.90 |
| 470.00 | 470.00 | 470.00 | 470.00 | 470.00 | 470.00 | 470.00 |
| 670.90 | 721.50 | 722.10 | 722.10 | 724.60 | 647.20 | 608.90 |
| 0.00 | 0.00 | 0.00 | 0.00 | |||
| 758.90 | 852.10 | 889.30 | 889.30 | 1,206.00 | 1,841.90 | 2,923.30 |
| 0.00 | 0.00 | 0.00 | 0.00 | 0.00 | 0.00 | 0.00 |
| 4.50 | 4.50 | 4.50 | 4.50 | 4.50 | 4.50 | 4.50 |
| -841.00 | -805.20 | -579.60 | -579.60 | 2,720.90 | 16,065.80 | 48,917.70 |
| -836.50 | -800.70 | -575.10 | -575.10 | 2,725.40 | 16,070.30 | 48,922.20 |
| -77.60 | 51.40 | 314.30 | 314.30 | 3,931.40 | 17,912.20 | 51,845.60 |
| 0.00 | 0.00 | 0.00 | 0.00 | 0.00 | 0.00 | 0.00 |
| 8.00 | 8.00 | 8.00 | 8.00 | 10.40 | 10.40 | 10.40 |
| 10.30 | 10.30 | 10.30 | 10.30 | 10.30 | 10.30 | 10.30 |
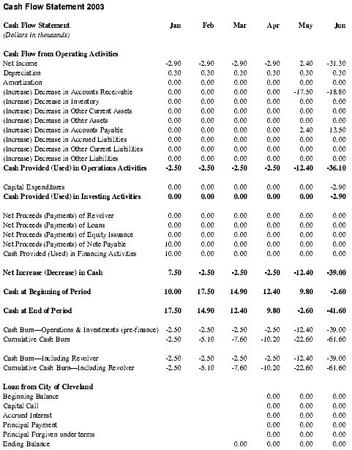
| Cash Flow Statement (Dollars in thousands) | Jan | Feb | Mar | Apr | May | Jun |
| Cash Flow from Operating Activities | ||||||
| Net Income | -2.90 | -2.90 | -2.90 | -2.90 | 2.40 | -31.30 |
| Depreciation | 0.30 | 0.30 | 0.30 | 0.30 | 0.30 | 0.30 |
| Amortization | 0.00 | 0.00 | 0.00 | 0.00 | 0.00 | 0.00 |
| (Increase) Decrease in Accounts Receivable | 0.00 | 0.00 | 0.00 | 0.00 | -17.50 | -18.80 |
| (Increase) Decrease in Inventory | 0.00 | 0.00 | 0.00 | 0.00 | 0.00 | 0.00 |
| (Increase) Decrease in Other Current Assets | 0.00 | 0.00 | 0.00 | 0.00 | 0.00 | 0.00 |
| (Increase) Decrease in Other Assets | 0.00 | 0.00 | 0.00 | 0.00 | 0.00 | 0.00 |
| (Increase) Decrease in Accounts Payable | 0.00 | 0.00 | 0.00 | 0.00 | 2.40 | 13.50 |
| (Increase) Decrease in Accrued Liabilities | 0.00 | 0.00 | 0.00 | 0.00 | 0.00 | 0.00 |
| (Increase) Decrease in Other Current Liabilities | 0.00 | 0.00 | 0.00 | 0.00 | 0.00 | 0.00 |
| (Increase) Decrease in Other Liabilities | 0.00 | 0.00 | 0.00 | 0.00 | 0.00 | 0.00 |
| Cash Provided (Used) in Operations Activities | -2.50 | -2.50 | -2.50 | -2.50 | -12.40 | -36.10 |
| Capital Expenditures | 0.00 | 0.00 | 0.00 | 0.00 | 0.00 | -2.90 |
| Cash Provided (Used) in Investing Activities | 0.00 | 0.00 | 0.00 | 0.00 | 0.00 | -2.90 |
| Net Proceeds (Payments) of Revolver | 0.00 | 0.00 | 0.00 | 0.00 | 0.00 | 0.00 |
| Net Proceeds (Payments) of Loans | 0.00 | 0.00 | 0.00 | 0.00 | 0.00 | 0.00 |
| Net Proceeds (Payments) of Equity Issuance | 0.00 | 0.00 | 0.00 | 0.00 | 0.00 | 0.00 |
| Net Proceeds (Payments) of Note Payable | 10.00 | 0.00 | 0.00 | 0.00 | 0.00 | 0.00 |
| Cash Provided (Used) in Financing Activities | 10.00 | 0.00 | 0.00 | 0.00 | 0.00 | 0.00 |
| Net Increase (Decrease) in Cash | 7.50 | -2.50 | -2.50 | -2.50 | -12.40 | -39.00 |
| Cash at Beginning of Period | 10.00 | 17.50 | 14.90 | 12.40 | 9.80 | -2.60 |
| Cash at End of Period | 17.50 | 14.90 | 12.40 | 9.80 | -2.60 | -41.60 |
| Cash Burn—Operations & Investments (pre-finance) | -2.50 | -2.50 | -2.50 | -2.50 | -12.40 | -39.00 |
| Cumulative Cash Burn | -2.50 | -5.10 | -7.60 | -10.20 | -22.60 | -61.60 |
| Cash Burn—Including Revolver | -2.50 | -2.50 | -2.50 | -2.50 | -12.40 | -39.00 |
| Cumulative Cash Burn—Including Revolver | -2.50 | -5.10 | -7.60 | -10.20 | -22.60 | -61.60 |
| Loan from City of Cleveland | ||||||
| Beginning Balance | 0.00 | 0.00 | 0.00 | |||
| Capital Call | 0.00 | 0.00 | 0.00 | |||
| Accrued Interest | 0.00 | 0.00 | 0.00 | |||
| Principal Payment | 0.00 | 0.00 | 0.00 | |||
| Principal Forgiven under terms | 0.00 | 0.00 | 0.00 | |||
| Ending Balance | 0.00 | 0.00 | 0.00 | 0.00 | ||
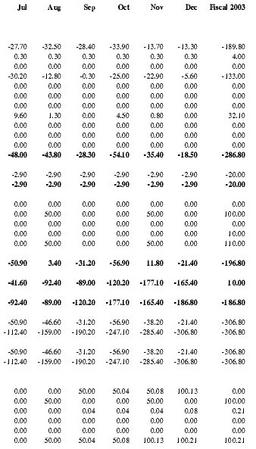
| Jul | Aug | Sep | Oct | Nov | Dec | Fiscal 2003 |
| -27.70 | -32.50 | -28.40 | -33.90 | -13.70 | -13.30 | -189.80 |
| 0.30 | 0.30 | 0.30 | 0.30 | 0.30 | 0.30 | 4.00 |
| 0.00 | 0.00 | 0.00 | 0.00 | 0.00 | 0.00 | 0.00 |
| -30.20 | -12.80 | -0.30 | -25.00 | -22.90 | -5.60 | -133.00 |
| 0.00 | 0.00 | 0.00 | 0.00 | 0.00 | 0.00 | 0.00 |
| 0.00 | 0.00 | 0.00 | 0.00 | 0.00 | 0.00 | 0.00 |
| 0.00 | 0.00 | 0.00 | 0.00 | 0.00 | 0.00 | 0.00 |
| 9.60 | 1.30 | 0.00 | 4.50 | 0.80 | 0.00 | 32.10 |
| 0.00 | 0.00 | 0.00 | 0.00 | 0.00 | 0.00 | 0.00 |
| 0.00 | 0.00 | 0.00 | 0.00 | 0.00 | 0.00 | 0.00 |
| 0.00 | 0.00 | 0.00 | 0.00 | 0.00 | 0.00 | 0.00 |
| -48.00 | -43.80 | -28.30 | -54.10 | -35.40 | -18.50 | -286.80 |
| -2.90 | -2.90 | -2.90 | -2.90 | -2.90 | -2.90 | -20.00 |
| -2.90 | -2.90 | -2.90 | -2.90 | -2.90 | -2.90 | -20.00 |
| 0.00 | 0.00 | 0.00 | 0.00 | 0.00 | 0.00 | 0.00 |
| 0.00 | 50.00 | 0.00 | 0.00 | 50.00 | 0.00 | 100.00 |
| 0.00 | 0.00 | 0.00 | 0.00 | 0.00 | 0.00 | 0.00 |
| 0.00 | 0.00 | 0.00 | 0.00 | 0.00 | 0.00 | 10.00 |
| 0.00 | 50.00 | 0.00 | 0.00 | 50.00 | 0.00 | 110.00 |
| -50.90 | 3.40 | -31.20 | -56.90 | 11.80 | -21.40 | -196.80 |
| -41.60 | -92.40 | -89.00 | -120.20 | -177.10 | -165.40 | 10.00 |
| -92.40 | -89.00 | -120.20 | -177.10 | -165.40 | -186.80 | -186.80 |
| -50.90 | -46.60 | -31.20 | -56.90 | -38.20 | -21.40 | -306.80 |
| -112.40 | -159.00 | -190.20 | -247.10 | -285.40 | -306.80 | -306.80 |
| -50.90 | -46.60 | -31.20 | -56.90 | -38.20 | -21.40 | -306.80 |
| -112.40 | -159.00 | -190.20 | -247.10 | -285.40 | -306.80 | -306.80 |
| 0.00 | 0.00 | 50.00 | 50.04 | 50.08 | 100.13 | 0.00 |
| 0.00 | 50.00 | 0.00 | 0.00 | 50.00 | 0.00 | 100.00 |
| 0.00 | 0.00 | 0.04 | 0.04 | 0.04 | 0.08 | 0.21 |
| 0.00 | 0.00 | 0.00 | 0.00 | 0.00 | 0.00 | 0.00 |
| 0.00 | 0.00 | 0.00 | 0.00 | 0.00 | 0.00 | 0.00 |
| 0.00 | 50.00 | 50.04 | 50.08 | 100.13 | 100.21 | 100.21 |
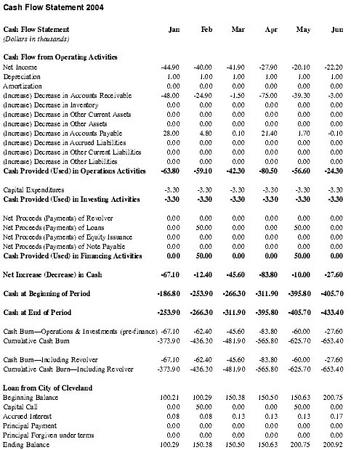
| Cash Flow Statement (Dollars in thousands) | Jan | Feb | Mar | Apr | May | Jun |
| Cash Flow from Operating Activities | ||||||
| Net Income | -44.90 | -40.00 | -41.90 | -27.90 | -20.10 | -22.20 |
| Depreciation | 1.00 | 1.00 | 1.00 | 1.00 | 1.00 | 1.00 |
| Amortization | 0.00 | 0.00 | 0.00 | 0.00 | 0.00 | 0.00 |
| (Increase) Decrease in Accounts Receivable | -48.00 | -24.90 | -1.50 | -75.00 | -39.30 | -3.00 |
| (Increase) Decrease in Inventory | 0.00 | 0.00 | 0.00 | 0.00 | 0.00 | 0.00 |
| (Increase) Decrease in Other Current Assets | 0.00 | 0.00 | 0.00 | 0.00 | 0.00 | 0.00 |
| (Increase) Decrease in Other Assets | 0.00 | 0.00 | 0.00 | 0.00 | 0.00 | 0.00 |
| (Increase) Decrease in Accounts Payable | 28.00 | 4.80 | 0.10 | 21.40 | 1.70 | -0.10 |
| (Increase) Decrease in Accrued Liabilities | 0.00 | 0.00 | 0.00 | 0.00 | 0.00 | 0.00 |
| (Increase) Decrease in Other Current Liabilities | 0.00 | 0.00 | 0.00 | 0.00 | 0.00 | 0.00 |
| (Increase) Decrease in Other Liabilities | 0.00 | 0.00 | 0.00 | 0.00 | 0.00 | 0.00 |
| Cash Provided (Used) in Operations Activities | -63.80 | -59.10 | -42.30 | -80.50 | -56.60 | -24.30 |
| Capital Expenditures | -3.30 | -3.30 | -3.30 | -3.30 | -3.30 | -3.30 |
| Cash Provided (Used) in Investing Activities | -3.30 | -3.30 | -3.30 | -3.30 | -3.30 | -3.30 |
| Net Proceeds (Payments) of Revolver | 0.00 | 0.00 | 0.00 | 0.00 | 0.00 | 0.00 |
| Net Proceeds (Payments) of Loans | 0.00 | 50.00 | 0.00 | 0.00 | 50.00 | 0.00 |
| Net Proceeds (Payments) of Equity Issuance | 0.00 | 0.00 | 0.00 | 0.00 | 0.00 | 0.00 |
| Net Proceeds (Payments) of Note Payable | 0.00 | 0.00 | 0.00 | 0.00 | 0.00 | 0.00 |
| Cash Provided (Used) in Financing Activities | 0.00 | 50.00 | 0.00 | 0.00 | 50.00 | 0.00 |
| Net Increase (Decrease) in Cash | -67.10 | -12.40 | -45.60 | -83.80 | -10.00 | -27.60 |
| Cash at Beginning of Period | -186.80 | -253.90 | -266.30 | -311.90 | -395.80 | -405.70 |
| Cash at End of Period | -253.90 | -266.30 | -311.90 | -395.80 | -405.70 | -433.40 |
| Cash Burn—Operations & Investments (pre-finance) | -67.10 | -62.40 | -45.60 | -83.80 | -60.00 | -27.60 |
| Cumulative Cash Burn | -373.90 | -436.30 | -481.90 | -565.80 | -625.70 | -653.40 |
| Cash Burn—Including Revolver | -67.10 | -62.40 | -45.60 | -83.80 | -60.00 | -27.60 |
| Cumulative Cash Burn—Including Revolver | -373.90 | -436.30 | -481.90 | -565.80 | -625.70 | -653.40 |
| Loan from City of Cleveland | ||||||
| Beginning Balance | 100.21 | 100.29 | 150.38 | 150.50 | 150.63 | 200.75 |
| Capital Call | 0.00 | 50.00 | 0.00 | 0.00 | 50.00 | 0.00 |
| Accrued Interest | 0.08 | 0.08 | 0.13 | 0.13 | 0.13 | 0.17 |
| Principal Payment | 0.00 | 0.00 | 0.00 | 0.00 | 0.00 | 0.00 |
| Principal Forgiven under terms | 0.00 | 0.00 | 0.00 | 0.00 | 0.00 | 0.00 |
| Ending Balance | 100.29 | 150.38 | 150.50 | 150.63 | 200.75 | 200.92 |
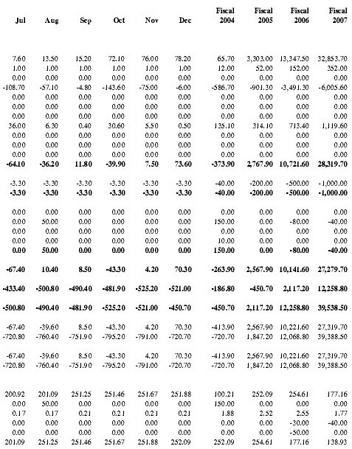
| Jul | Aug | Sep | Oct | Nov | Dec | Fiscal 2004 | Fiscal 2005 | Fiscal 2006 | Fiscal 2007 |
| 7.60 | 13.50 | 15.20 | 72.10 | 76.00 | 78.20 | 65.70 | 3,303.00 | 13,347.50 | 32,853.70 |
| 1.00 | 1.00 | 1.00 | 1.00 | 1.00 | 1.00 | 12.00 | 52.00 | 152.00 | 352.00 |
| 0.00 | 0.00 | 0.00 | 0.00 | 0.00 | 0.00 | 0.00 | 0.00 | 0.00 | 0.00 |
| -108.70 | -57.10 | -4.80 | -143.60 | -75.00 | -6.00 | -586.70 | -901.30 | -3,491.30 | -6,005.60 |
| 0.00 | 0.00 | 0.00 | 0.00 | 0.00 | 0.00 | 0.00 | 0.00 | 0.00 | 0.00 |
| 0.00 | 0.00 | 0.00 | 0.00 | 0.00 | 0.00 | 0.00 | 0.00 | 0.00 | 0.00 |
| 0.00 | 0.00 | 0.00 | 0.00 | 0.00 | 0.00 | 0.00 | 0.00 | 0.00 | 0.00 |
| 36.00 | 6.30 | 0.40 | 30.60 | 5.50 | 0.50 | 135.10 | 314.10 | 713.40 | 1,119.60 |
| 0.00 | 0.00 | 0.00 | 0.00 | 0.00 | 0.00 | 0.00 | 0.00 | 0.00 | 0.00 |
| 0.00 | 0.00 | 0.00 | 0.00 | 0.00 | 0.00 | 0.00 | 0.00 | 0.00 | 0.00 |
| 0.00 | 0.00 | 0.00 | 0.00 | 0.00 | 0.00 | 0.00 | 0.00 | 0.00 | 0.00 |
| -64.10 | -36.20 | 11.80 | -39.90 | 7.50 | 73.60 | -373.90 | 2,767.90 | 10,721.60 | 28,319.70 |
| -3.30 | -3.30 | -3.30 | -3.30 | -3.30 | -3.30 | -40.00 | -200.00 | -500.00 | -1,000.00 |
| -3.30 | -3.30 | -3.30 | -3.30 | -3.30 | -3.30 | -40.00 | -200.00 | -500.00 | -1,000.00 |
| 0.00 | 0.00 | 0.00 | 0.00 | 0.00 | 0.00 | 0.00 | 0.00 | 0.00 | 0.00 |
| 0.00 | 50.00 | 0.00 | 0.00 | 0.00 | 0.00 | 150.00 | 0.00 | -80.00 | -40.00 |
| 0.00 | 0.00 | 0.00 | 0.00 | 0.00 | 0.00 | 0.00 | 0.00 | 0.00 | 0.00 |
| 0.00 | 0.00 | 0.00 | 0.00 | 0.00 | 0.00 | 10.00 | 0.00 | 0.00 | 0.00 |
| 0.00 | 50.00 | 0.00 | 0.00 | 0.00 | 0.00 | 150.00 | 0.00 | -80.00 | -40.00 |
| -67.40 | 10.40 | 8.50 | -43.30 | 4.20 | 70.30 | -263.90 | 2,567.90 | 10,141.60 | 27,279.70 |
| -433.40 | -500.80 | -490.40 | -481.90 | -525.20 | -521.00 | -186.80 | -450.70 | 2,117.20 | 12,258.80 |
| -500.80 | -490.40 | -481.90 | -525.20 | -521.00 | -450.70 | -450.70 | 2,117.20 | 12,258.80 | 39,538.50 |
| -67.40 | -39.60 | 8.50 | -43.30 | 4.20 | 70.30 | -413.90 | 2,567.90 | 10,221.60 | 27,319.70 |
| -720.80 | -760.40 | -751.90 | -795.20 | -791.00 | -720.70 | -720.70 | 1,847.20 | 12,068.80 | 39,388.50 |
| -67.40 | -39.60 | 8.50 | -43.30 | 4.20 | 70.30 | -413.90 | 2,567.90 | 10,221.60 | 27,319.70 |
| -720.80 | -760.40 | -751.90 | -795.20 | -791.00 | -720.70 | -720.70 | 1,847.20 | 12,068.80 | 39,388.50 |
| 200.92 | 201.09 | 251.25 | 251.46 | 251.67 | 251.88 | 100.21 | 252.09 | 254.61 | 177.16 |
| 0.00 | 50.00 | 0.00 | 0.00 | 0.00 | 0.00 | 150.00 | 0.00 | 0.00 | 0.00 |
| 0.17 | 0.17 | 0.21 | 0.21 | 0.21 | 0.21 | 1.88 | 2.52 | 2.55 | 1.77 |
| 0.00 | 0.00 | 0.00 | 0.00 | 0.00 | 0.00 | 0.00 | 0.00 | -30.00 | -40.00 |
| 0.00 | 0.00 | 0.00 | 0.00 | 0.00 | 0.00 | 0.00 | 0.00 | -50.00 | 0.00 |
| 201.09 | 251.25 | 251.46 | 251.67 | 251.88 | 252.09 | 252.09 | 254.61 | 177.16 | 138.93 |
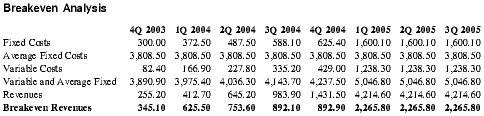
| 4Q 2003 | 1Q 2004 | 2Q 2004 | 3Q 2004 | 4Q 2004 | 1Q 2005 | 2Q 2005 | 3Q 2005 | |
| Fixed Costs | 300.00 | 372.50 | 487.50 | 588.10 | 625.40 | 1,600.10 | 1,600.10 | 1,600.10 |
| Average Fixed Costs | 3,808.50 | 3,808.50 | 3,808.50 | 3,808.50 | 3,808.50 | 3,808.50 | 3,808.50 | 3,808.50 |
| Variable Costs | 82.40 | 166.90 | 227.80 | 335.20 | 429.00 | 1,238.30 | 1,238.30 | 1,238.30 |
| Variable and Average Fixed | 3,890.90 | 3,975.40 | 4,036.30 | 4,143.70 | 4,237.50 | 5,046.80 | 5,046.80 | 5,046.80 |
| Revenues | 255.20 | 412.70 | 645.20 | 983.90 | 1,431.50 | 4,214.60 | 4,214.60 | 4,214.60 |
| Breakeven Revenues | 345.10 | 625.50 | 753.60 | 892.10 | 892.90 | 2,265.80 | 2,265.80 | 2,265.80 |
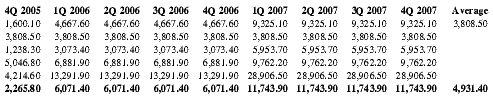
| 4Q 2005 | 1Q 2006 | 2Q 2006 | 3Q 2006 | 4Q 2006 | 1Q 2007 | 2Q 2007 | 3Q 2007 | 4Q 2007 | Average |
| 1,600.10 | 4,667.60 | 4,667.60 | 4,667.60 | 4,667.60 | 9,325.10 | 9,325.10 | 9,325.10 | 9,325.10 | 3,808.50 |
| 3,808.50 | 3,808.50 | 3,808.50 | 3,808.50 | 3,808.50 | 3,808.50 | 3,808.50 | 3,808.50 | 3,808.50 | |
| 1,238.30 | 3,073.40 | 3,073.40 | 3,073.40 | 3,073.40 | 5,953.70 | 5,953.70 | 5,953.70 | 5,953.70 | |
| 5,046.80 | 6,881.90 | 6,881.90 | 6,881.90 | 6,881.90 | 9,762.20 | 9,762.20 | 9,762.20 | 9,762.20 | |
| 4,214.60 | 13,291.90 | 13,291.90 | 13,291.90 | 13,291.90 | 28,906.50 | 28,906.50 | 28,906.50 | 28,906.50 | |
| 2,265.80 | 6,071.40 | 6,071.40 | 6,071.40 | 6,071.40 | 11,743.90 | 11,743.90 | 11,743.90 | 11,743.90 | 4,931.40 |
APPENDIX
Systems Overview
This section provides an overview of the PATH Systems processes. First is the construction of the predictive database which is built and characterized by gathering empirical observations in a quasi-batch mode as those events occur. At the other end of the process, end users request routes through the website or other means. Such requests are handled on a very fast, real-time basis.
- GPS —U.S. Department of Defense network of 28 Global Positioning Satellites in geosynchronous orbit 11,000 miles above the earth. Global Positioning Satellites shower the earth with precise time stamps. When three or more are within range, those signals can be triangulated to calculate precise speed, location, heading, and altitude observations. The satellites were launched for military purposes by the U.S. government, but they've become available for reliable civilian use in May 2000 when SA (Selective Availability) scrambling was stopped. These signals are free and one-way; it isn't possible to transmit to a GPS satellite.
- Hardware Tracking/Communication Unit —There are a variety of tracking devices employed, many requiring no driver interaction, featuring a GPS receiver, wireless transponder, memory cache, and RAM processor attached to the vehicle's 12-volt power supply. PATH can harvest data from a wide variety of tracking vendors. Popular tracking systems are offered by Magellan, StreetWise, Garmin, TravelWell, and Altec. We also anticipate many more sources of data coming online very soon, e.g., every cell phone will soon be a location-aware, data-gathering device to be captured.
- Wireless, Communication Methods —A key component to making the database accumulation process feasible is effortlessly communicating large sets of data back to our Operations Centers. PATH is wireless-agnostic, meaning we utilize whatever the best wireless solution is at the time. We have practical experience with LMPD (our current platform) and Microblast (from NetComm). We are exploring GPRS, satellite (as needed) and other flavors of the WiFi.
- External, 3rd Party Data —Historical accident data, current construction data, and current/predicted weather data can be obtained from DOT, FARS, MCMAS, individual States' speed, accident, and construction data, and National weather data.
- PATH's Driver-base —However acquired, the raw observation data is then stored in PATH's large database dubbed the Driver-base. The raw observations including latitude/longitude, vehicle identity, speed, heading, altitude, and timestamp are recorded. We will never discard a valid observation from this database.
- Translation to Road Segments —On some regular schedule, the raw latitude/longitude data will be translated to road segment data for the purposes of updating the stochastic model. Map vendors describe the roads using defined "road segments" or "links." The two broad classes of links are intersections and road segments between intersections. North America has about 30 million links. Links are pieced together to form a path in the algorithm/routing process.
- Stochastic Modeling —The stochastic model considers the history of road conditions to generate predictions of what speeds and other cost elements are expected to be under the conditions projected for the roads in the planning period.
- Creation of the NOW-base —The real-time demands of a responsive routing system require a highly available simplified database describing the conditions of each road segment under the possible conditions expected to be encountered during the planning process. Although smaller than the Driver-base, the NOW-base is still scoped to be approximately 4 terabytes in size. Availability is maintained by segmenting it into logical geographic modules.
- Post-FIFO, Time Expanded Algorithm —PATH has developed the next-generation optimization algorithm.
- GIS —There are numerous Geographical Information System software vendors that provide visual maps for use in navigation, including GDT, iiMap, Navtech, Telcontar, and Tele Atlas. PATH's technology can interface with any of them, and we are in discussions with several of the vendors.
- Input/Output Methods —Finally, we have a variety of ways to deliver the route information to the end user. Our initial implementation is web-based using PCs. In addition to web delivery, PATH anticipates several delivery modules when they're commercially available including in-vehicle displays, in-vehicle voice commands, and server-resident application to name just three. It is not our intent to create the means for delivering these platforms, but rather to use them as they emerge.
Comment about this article, ask questions, or add new information about this topic: