Structural Genomics Software Provider

BUSINESS PLAN
PHARMATECH GENOMICS
14001 South Lincoln Boulevard
San Diego, California 92101
Pharmatech Genomics is a license provider and application service provider (ASP) of structural genomics software. Structural genomics software helps scientists turn data from the Human Genome Project into drugs and cures for disease. Specifically, our technology enables the biotechnology industry to rapidly discover patentable lead compounds from unclassified gene sequences. We intend to capture a dominant market share by supplying an economical, yet powerful, analysis platform.
- MISSION
- BUSINESS MODEL
- WHY STRUCTURAL GENOMICS IS IMPORTANT
- INTELLECTUAL PROPERTY
- LICENSING & CORPORATE PARTNERSHIP
- MARKET
- FINANCE
- FOUNDER PROFILES
- KEYS TO SUCCESS
MISSION
Pharmatech Genomics is a license provider and application service provider (ASP) of structural genomics software. Structural genomics software helps scientists turn data from the Human Genome Project into drugs and cures for disease. Specifically, our technology enables the biotechnology industry to rapidly discover patentable lead compounds from unclassified gene sequences. The platform consists of an online computing environment designed specifically to address every step of the post-genomic drug development path, from data visualization to structural analysis and protein engineering. We intend to capture a dominant market share by supplying an economical, yet powerful, analysis platform.
BUSINESS MODEL
Pharmatech Genomics has a technology platform for structural genomics research that can be deployed within an enterprise network, over the Internet, or in a Virtual Private Network (VPN). Structural genomics is a field of research that is integral to the drug discovery and development process and promises to reduce the cost and time to market for drugs. However, the problem of maintaining and using the existing solutions is costly and time consuming. Pharmatech Genomics has a unique, cost-effective, integrative, and easy-to-use platform to address this problem. The platform consists of an "operating environment" and integrated software modules. Users can either license or subscribe to our technology and services in the following ways:
- The platform will be licensed as an integrative operating environment with software modules (primarily for enterprise networks or VPNs in biotech/pharmacuetical companies)
- The core operating environment can be licensed to customers wishing to integrate proprietary software (primarily for enterprise networks or VPNs in biotech/pharmaceutical companies with proprietary software)
- Users can subscribe to use the platform over the Internet (primarily small to mid-sized biotech/pharmaceutical companies desiring ASP service, i.e., lacking informatics infrastructure and personnel)
- Users can subscribe to use the core operating environment with integrated proprietary software over the Internet (primarily small to mid-sized biotech/pharmaceutical companies desiring ASP service with proprietary software)
Our structural genomics platform will attract customers for the following reasons:
- Integrative "operating environment" will allow interoperability between previously disparate software
- Easy-to-use interface will solve usability issues with software
- Internet-deployed platform will allow users to access previously platform-dependent software through any Internet browser, regardless of client platform
-
Secure application and data hosting will free the customer from:
- needing to build a costly informatics infrastructure and personnel
- needing expensive servers and storage arrays to run software
- maintenance of software, hardware, and upgrades
- Flexible and customizable subscription rates
- Competitive pricing
We will attract corporate partnerships for the following reasons:
- We make their software available to a wider market through low-cost pricing (small to mid-sized biotech companies with limited resources or informatics expertise)
- We will train novice users on our easy-to-use platform and retain them with powerful licensed software modules
- We host and integrate their proprietary software and data
Similar to how the now multi-billion-dollar, electronic CAD industry began, Pharmatech Genomics provides a way for cryptic, unfriendly, yet powerful software tools to reach a mass audience in the biotech industry. Many of these tools reside in university labs, where once developed, do not reach the biotech industry. Pharmatech Genomics provides interfaces to unfriendly structural analysis software and creates a channel of distribution for the software to reach a mass audience of users. We have first-to-market advantage in this area of biotechnology.
Revenue flows from direct subscription to online services including access to the technology platform and data hosting services. As an application service provider, Pharmatech Genomics prices services according to each user, enabling them to balance their financial and scientific needs. The base subscription includes use of the structural genomics platform, its core software modules, and basic data-hosting services. Upgrades are available for use of additional software modules and data-hosting. As integration experts, we work closely with customers should they prefer to use their own "in-house" software in an integrative platform. For a nominal integration and consulting fee, Pharmatech Genomics will integrate and host the customer's proprietary software within our "operating environment" for the sole use of the customer. Additional revenue streams include licensing fees for use of the platform in-house, custom consulting services, and Internet banner advertising. Pharmatech Genomics markets services through a direct sales force, focusing first on under-served sectors of the market. Long term, we have the domain expertise to develop proprietary software modules for use within the operating environment or for licensing outside. Through ongoing research, Pharmatech Genomics will remain at the forefront of structural genomics.
WHY STRUCTURAL GENOMICS IS IMPORTANT
The Human Genome Project is nearly complete. Scientists are "mining" vast amounts of genetic information to identify disease-related genes. Sequencing the data, however, is only a small part of the research process. Once a gene has been identified, researchers are faced with the task of determining the structure and function of the protein product(s) encoded by the gene. It is the behavior of these proteins within the body that ultimately affects a person's health, and understanding its 3-D structure and function is the key to structural genomics. This "post-mining" phase is, and will continue to be, the bottleneck of most drug development efforts. By 2002, this process will cost pharmaceutical companies $32 billion per year, a 25 percent increase in spending from 1998 (Burrill & Company annual report, 1999).
The field of structural genomics describes the relationship between genomic sequences and 3-D protein structure and function. Using structural genomics software will significantly reduce the time and costs of development of new therapeutics by drug companies. Pharmatech Genomics' goal is to provide a computing environment that gives scientists the tools to efficiently and seamlessly go from sequence to lead compound.
Services Description
- Custom Integration and Consulting Services
- Secure Application Service, Data Storage, and Archiving
- Online Training Environment and Technical Support
The Pharmatech Genomics' platform offers researchers a very high degree of flexibility in analysis tools and service. This flexibility enables customers to balance their scientific and financial needs. We will work with customers to integrate their proprietary software into our operating environment, thus allowing interoperability among proprietary and available software modules. The proprietary platform can be installed and maintained on an enterprise network or a virtual private network (VPN). Custom consulting services are available to organizations that request specific changes to the standard platform to meet internal infrastructure needs.
Pharmatech Genomics' customers have the option to securely perform analyses and then store the data on our systems. We have partnered with a software company whose unique approach to the ASP market space offers ASPs a privately-branded, turnkey solution that enables them to deliver applications over the Internet through any web browser. The company's proprietary, state-of-the-art technologies provide the ASP infrastructure and application service capabilities required for creating and launching application-service businesses in weeks. As an ASP hosting service, New Moon provides us with the following abilities:
- Network directory servers
- Load-balancing servers
- Powerful ASP management tools
- Secure network services
These services remove the burden of having to maintain an in-house database, eases the flow of data from one site to another, and allows the users to access their data from any geographic location.
Through our online training environment, a technical support staff will be available to answer user questions at any time. Technical support and consultants will be available to customers using our platform or operating environment offline.
Technology Description
Our company's technology platform consists of a computing environment designed specifically to address every step of this post-genomic drug development path. The environment will perform the following tasks through integrated software modules.
- Data Visualization (sequence, structure, and pathway information)
- Discovering Similarities to Known Sequences (homology modeling and multiple alignment)
- Developing a 3-dimensional Model (threading, secondary, and tertiary prediction)
- Pathway (Functional) Analysis
- Structural Analysis
- Discovering Lead Compounds (searching of virtual drug libraries, de novo drug design)
- Protein Engineering
A key feature is an integrated visualization interface to our operating environment deployable through a web browser. This interface allows the user to view multiple data types, provides necessary instruction and assistance, seamlessly connects the currently disjointed aspects of structural genomics analysis, and provides computer platform independence for the user. Further, our system allows the user to define the work environment according to their level of expertise by offering a variety of individual programs and interfaces. If the user is a neophyte to structural genomics analysis, the system will "walk" them through all the steps, setting defaults for noncritical variables and coaching them on how to set the critical variables in their analyses. If a user is an experienced structural genomicist, the system will provide them all the comfort of being able to manipulate every variable in the environment to their content.
The interface will also be highly customizable to meet the personalized demands of individual users. For example, an X-ray crystallographer might be interested in predicting potential lead compounds from a solved structure. For example, they may not need tools for building multiple alignments, so these tools, while available, would not maintain a high profile in their personal interface.
We are building an Internet-deployable operating environment that facilitates communication between independent software applications, the interface, and the user. The user is seamlessly provided with the tools needed to perform structural genomics research and will be free from the burdens of software, hardware, and database management. Building the packages into modules obviates the need to move between different file formats, interfaces, and platforms—increasing the overall efficiency of the drug development timeline and eliminating the need to build and maintain a large in-house bioinformatics infrastructure.
Not until recently did technology exist that enabled researchers to perform each of these individual steps. Currently, each step is independent and tenuously linked, using disparate interfaces and data output. Visualization of the module output is a key component of the user interface. The interface will be tailored for all ability levels from the novice to the expert.
Pharmatech Genomics' user interface will communicate with independent software modules developed by and licensed from various industrial and academic institutions. Tools will translate each module's data requirements into a common language and present them to the user through a single interface. With tools that translate the software's proprietary interface into a common language, the modules will be harnessed together to perform powerful structural genomic analysis. For example, starting from a DNA sequence, the interface will find related sequences from genomic data, model the structure of the resulting protein, and predict lead drug compounds using the modeled structure. Pharmatech Genomics' environment will have all the modules necessary for performing the tasks outlined in the previous section.
The environment has the following key features:
- Users enter any data format (sequence, multiple alignment, structure, etc.) into the system
- The technology offers a platform independent of visualization and analysis tools
- The tool set covers every step in the drug development pathway
- Users enter and exit at any stage of the pathway, leaving with a data format supported by the entire biotechnology industry
INTELLECTUAL PROPERTY
Our intellectual property revolves around the ability to seamlessly integrate the independent programs into a single package, as well as build a common language that allows module technologies to communicate with each other. While the environment is built around the idea of developing a sequence of unknown function into a profitable drug or something else of patentable value, the user can enter the analysis pathway at any point in the process with the guarantee that their needs will be met with our environment.
LICENSING & CORPORATE PARTNERSHIP
During discussions with the Office of Technology Management (OTM) at UCSD, Pharmatech Genomics has established favorable, but informal, licensing terms for our "core" software modules. Once a formal agreement is reached, Pharmatech Genomics expects to deploy the platform on the Internet in six to eight months. The licensing of these "core" modules from UCSD is necessary for a timely launch. Additionally, we will actively pursue strategic partnerships with commercial software vendors to obtain mutually agreeable licensing terms for their software modules.
MARKET
We estimate the total number of people employed in biological research to be 1 million worldwide, with an active user base of 200,000. Research and Development personnel constitute roughly 40 percent of the total employees. Of all employees in R&D, about 50 percent will use structural genomics software. These users include protein engineers, computational biologists and chemists, structural biologists, chemists, organic chemists, geneticists, biophysicists, and bioinformaticists. These figures were obtained from the California Healthcare Institute's 1999 Report on Biotechnology and by directly polling the bioinformatics directors at several large pharmaceutical and biotech companies.
The revenue potential from this user base is $1.2 to $1.8 billion. This figure is derived by multiplying the cost of current applications (approximately $6,000/user/year; cost of a comparable software/service package) by the total estimated potential user base. Another measure of the market size was determined by evaluating the total amount spent on bioinformatics technologies by large pharmaceutical companies. In 1998, these large organizations spent $1.8 billion on enabling technologies (1998 Burrill & Company Biotechnology Report).
Market Segmentation
Our target market consists of biotechnology, pharmaceutical, and university organizations actively engaged in developing patentable drug-like compounds from unclassified gene sequences. The market can be divided into three sectors based on the number of employees per organization (these values are averages from five different biotech industry reports). Stratification according to the number of employees allows us to value the market and project our growth values according to the growth of the estimated user base. The figure below illustrates the current potential user base.
- Large pharmaceutical and biotechnology companies ( > 2,000 employees): These companies are often publicly traded and have large ($30-40 billion) R&D budgets—significant fractions of which are spent on enabling technologies. Percentage of R&D spending on outsourced technologies is steadily increasing ($15 billion in 1998). These companies demand cutting-edge and efficient applications. While the financial resources are usually not a constraining factor, location, number of concurrent users, security, maintenance, and upgrading are critical issues. The user base in this sector is projected to grow at a rate of 20 percent annually.
- Small to medium-sized companies ( < 2,000 employees): This market segment is currently underserved and is one of our primary target segments. Approximately 90 percent of all U.S. biotechnology companies (1,500 companies in 1999) lie in this sector. Seventy-five percent of all U.S. companies are private and have less than 50 employees. They represent a sizable potential market because of the increasing use of genetic data to find promising drug targets. While implementation issues do not necessarily constrain these users, the need for consistent access to economical yet functional analytical tools is important to these companies. Due to the increased need for visualization and analysis software in this segment, as well as the increase in the number of employees trained in structural genomics, it is expected that this sector will grow at 35 percent annually until 2005.
- Educational Institutions: The educational sector is a key to Pharmatech Genomics' success. Universities train and influence a large number of potential researchers but lack the unlimited funding of pharmaceutical companies. This situation demands that we meet their special needs for education and low-cost solutions. This sector will greatly benefit from a service that provides flexibility in the choice of analytical tools and pricing structures. The increased dependence and emphasis on structural genomics in both research and education will cause this sector to grow at a rapid rate (40% annually) until 2005.
Market Trends
The growing need for structural genomics applications is driven by several factors:
- The Genome project will provide companies with many putative drug targets. However, the rapid growth of potential targets causes a bottleneck in the development pipeline. Downstream processes have not been optimized to fully handle the deluge of information. Structural genomics will play a crucial role in optimizing downstream development processes, and increasing the flow of products through the drug development pipeline.
- Structural genomics is becoming part of every biologist's training, routinely used to analyze a protein at the structure and function level. They will expect that the analytical tools they use are customizable, easily deployable, and intuitive. By 2020, structural genomics analysis and molecular visualization is expected to be a routine aspect of research (from Base4 Informatics, Inc.). Structural genomics will become emphasized in the training of future generations of biologists. Structure—function analyses of genes, proteins, and pathways—will become part of the core skill sets in biologists.
- Genetic sequencing of infectious diseases is, and will continue to be, a focal point for drug development research. Structural genomics research is an essential aspect of developing drugs specific to certain infectious organisms.
We expect an overall growth of approximately 29 percent annually until 2005; this was estimated based on the United States Labor and Statistics Department and the California Healthcare Institute's growth projections for employment in the biotechnology and pharmaceutical sectors until 2004. In that year our total potential user base will be 720,000 users with a projected value of $4.4 billion.
Marketing Strategy
- Our first goal is to rapidly secure a significant market share of the under-served segments. We will focus our efforts on emphasizing the value our platform can add to the R&D pipeline relative to their costs.
- We will effectively compete in the larger market segment composed of large organizations.
- Through focused advertising in scientific journals, conferences, research institutions, and industry specific websites, we will target the structural genomics community.
- Direct sales staff will contact, recruit, and convert researchers to the Pharmatech Genomics' platform.
- Online training will ensure the Pharmatech Genomics' platform is easy-to-use and retained among future generations of researchers—meeting a serious need for bioinformatics education.
Distribution
Pharmatech Genomics will deploy over the Internet with universal browser compatibility. For in-house use of our platform or operating environment, software will be available via down-load or CD-ROM. Custom integration services will require on-site technical support and consulting. Our direct sales staff will contact interested researchers and negotiate the fee for services.
Competitive Analysis
The structural genomics applications industry is composed of several key corporations that provide competing software solutions. These providers sell their products to companies and university laboratories that can afford them or establish other types of cooperative agreements. More established solutions providers often partner, or are acquired by, pharmaceutical companies in order to obtain exclusive rights to critical software solutions, typified by Warner-Lambert's recent agreement to use Evos' discovery platform, or by U.S. Pharmacopeia's acquisition of Scientific Simulations, Inc. There is a substantial range in how these products are priced, and how cooperative research agreements are structured. At the simplest level, a customer can license copies of the software for their own use. Conversely, a software provider can allow a pharmaceutical or biotechnology company to license their software solution in exchange for shared royalties or intellectual property rights on commercially viable products that are discovered through its use.
Our competitors can be classified as non-ASP or ASP companies. Non-ASP competitors consist of companies that have an enterprise around building and distributing visualization and analysis software using traditional (softcopy) methods. These companies have necessary domain expertise to compete with us, but lack of flexibility in their software platforms, the inability to offer users economical and effective tools, and infrastructures incapable of supporting universal platform compatibility. ASP competitors have the necessary infrastructure to provide solutions, but lack the domain expertise to rapidly develop, market, and deploy a structural genomics platform. The table below illustrates each competitor's available toolset.
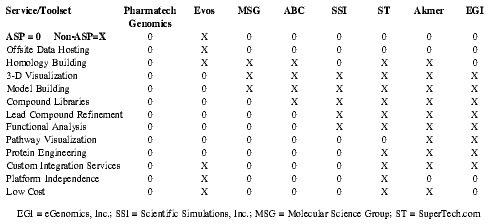
| Service/Toolset | Pharmatech Genomics | Evos | MSG | ABC | SSI | ST | Akmer | EGI |
| EGI = eGenomics, Inc.; SSI = Scientific Simulations, Inc.; MSG = Molecular Science Group; ST = SuperTech.com | ||||||||
| ASP = 0 Non-ASP=X | 0 | X | 0 | 0 | 0 | 0 | 0 | 0 |
| Offsite Data Hosting | 0 | X | 0 | 0 | 0 | 0 | 0 | 0 |
| Homology Building | 0 | X | X | X | 0 | X | X | 0 |
| 3-D Visualization | 0 | 0 | X | X | X | X | X | X |
| Model Building | 0 | 0 | X | X | X | X | X | X |
| Compound Libraries | 0 | 0 | 0 | X | X | X | X | X |
| Lead Compound Refinement | 0 | 0 | 0 | 0 | X | X | X | X |
| Functional Analysis | 0 | 0 | 0 | 0 | X | X | X | X |
| Pathway Visualization | 0 | 0 | 0 | 0 | 0 | 0 | X | X |
| Protein Engineering | 0 | 0 | 0 | 0 | 0 | X | X | X |
| Custom Integration Services | 0 | X | 0 | 0 | 0 | X | X | X |
| Platform Independence | 0 | X | 0 | 0 | 0 | X | 0 | 0 |
| Low Cost | 0 | X | 0 | 0 | 0 | X | X | 0 |
Competitive Edge
- Rapid Time to Market: Because all the modules for the computational backbone are built, we can release our system in six to eight months after obtaining the appropriate licenses.
- Unique Technology: Pharmatech Genomics' toolset contains key analysis tools which cannot be found in any other application.
- Universal Platform Compatibility: Unlike currently available software solutions, Pharmatech Genomics' technology is designed to deploy on any platform. We achieve universal compatibility by delivering our solutions over the Internet. With either Netscape 4+ or Internet Explorer 5+ anyone can use the software as they research.
- Flexible Pricing: As an ASP, Pharmatech Genomics' prices services in unique ways based on the individual module structure. We meet the needs of budget conscious start-ups, large pharmaceutical companies, and every researcher in between.
- Domain Expertise: With expertise in structural biology, computer science, drug development, and artificial intelligence, our team has the scientific and technical background to develop a platform that meets the needs of scientists of all levels.
- Flexibility and Scaleability of the ASP Model: As an ASP, our platform supports a variety of future services including collaborative teleconferencing, banner advertisments, and online informatics training and educational services.
Barriers to Entry
There are two dominant threats to Pharmatech Genomics' business model:
Current companies (SSI, Evos, etc.) might develop Internet deployable versions of their existing platforms.
- Pharmatech Genomics' built-in diversity of analytic tools gives users far more choices than any single competitor. As founding members of this project, we will develop many of these applications at the University of California, San Diego. As authors, we have first rights to license these applications for industry purposes. It is unlikely, therefore, that our competitors will be able to obtain these applications.
- There is significant first-mover advantage in this market. Our competitive edge (above) establishes natural barriers to secondary entrant into the market. In particular, the scaleability of the technology, the uniqueness of Pharmatech Genomics' toolset, and the short development times give the ability to rapidly adapt to any potential competitors. By the time a competitor moves into the space, Pharmatech Genomics will have obtained a dominant market share, established service-quality branding, and will retain it by continuously providing customers with the highest degree of flexibility in their choice of analysis tools.
- This is a scaleable business model in a number of ways. Pharmatech Genomics can rapidly increase its ability to serve larger numbers of users without incurring any redevelopment or infrastructure costs. We can also easily expand our service platform to include community-focused services (collaborative research portals, etc.) that would increase value to our users.
- All of the current systems are OS specific and are dependent on local hardware resources. It would require a large investment of time and personnel to re-engineer these systems to be web deployable.
- These competitors lack the infrastructure to develop themselves into an ASP. Current companies are built around systems that require local hardware support. Hence their sales, R&D, manufacturing, and support structures are built around distributing software in compact disc form, rather than deploying them over the Internet. We are not arguing that a shift from a traditional model to an ASP model is impossible, only that such a shift would require a significant restructuring and redevelopment time. Further, the company would have to split its resources into maintaining its legacy-based customer base and to attracting a new Internet user base.
New ASP competitors arise or current ASPs attempt to move into our space.
- Some of the applications included in this platform have been in development for over 20 years, while others have taken less than 2 or 3 years to develop. Once deployed, it would take a new entrant a long time to develop similar or stronger applications. Pharmatech Genomics would be the dominant application provider.
- We have an established domain expertise and the ability to rapidly update and develop user specific applications.
FINANCE
Pharmatech Genomics is seeking $5.1 million in first round funding. The majority of the funds would go toward developing proprietary technology, acquiring software licenses, and setting up infrastructure to deliver our services over the Internet. The following table details how the funds will be spent. Additional funding will be raised in the future.
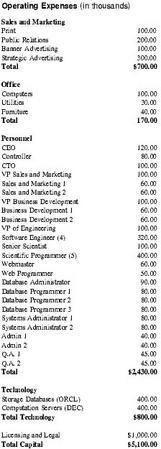
| Sales and Marketing | |
| 100.00 | |
| Public Relations | 200.00 |
| Banner Advertising | 100.00 |
| Strategic Advertising | 300.00 |
| Total | $700.00 |
| Office | |
| Computers | 100.00 |
| Utilities | 30.00 |
| Furniture | 40.00 |
| Total | 170.00 |
| Personnel | |
| CEO | 120.00 |
| Controller | 80.00 |
| CTO | 100.00 |
| VP Sales and Marketing | 100.00 |
| Sales and Marketing 1 | 60.00 |
| Sales and Marketing 2 | 60.00 |
| VP Business Development | 100.00 |
| Business Development 1 | 60.00 |
| Business Development 2 | 60.00 |
| VP of Engineering | 100.00 |
| Software Engineer (4) | 320.00 |
| Senior Scientist | 100.00 |
| Scientific Programmer (5) | 400.00 |
| Webmaster | 60.00 |
| Web Programmer | 50.00 |
| Database Administrator | 90.00 |
| Database Programmer 1 | 80.00 |
| Database Programmer 2 | 80.00 |
| Database Programmer 3 | 80.00 |
| Systems Administrator 1 | 80.00 |
| Systems Administrator 2 | 80.00 |
| Admin 1 | 40.00 |
| Admin 2 | 40.00 |
| Q.A. 1 | 45.00 |
| Q.A. 2 | 45.00 |
| Total | $2,430.00 |
| Technology | |
| Storage Databases (ORCL) | 400.00 |
| Computation Servers (DEC) | 400.00 |
| Total Technology | $800.00 |
| Licensing and Legal | $1,000.00 |
| Total Capital | $5,100.00 |
General Financial Assumptions
Our assumptions are listed in the following table.
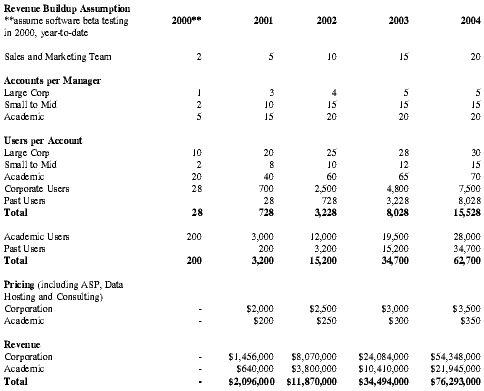
| Revenue Buildup Assumption | 2000** | 2001 | 2002 | 2003 | 2004 |
| **assume software beta testing in 2000, year-to-date | |||||
| Sales and Marketing Team | 2 | 5 | 10 | 15 | 20 |
| Accounts per Manager | |||||
| Large Corp | 1 | 3 | 4 | 5 | 5 |
| Small to Mid | 2 | 10 | 15 | 15 | 15 |
| Academic | 5 | 15 | 20 | 20 | 20 |
| Users per Account | |||||
| Large Corp | 10 | 20 | 25 | 28 | 30 |
| Small to Mid | 2 | 8 | 10 | 12 | 15 |
| Academic | 20 | 40 | 60 | 65 | 70 |
| Corporate Users | 28 | 700 | 2,500 | 4,800 | 7,500 |
| Past Users | 28 | 728 | 3,228 | 8,028 | |
| Total | 28 | 728 | 3,228 | 8,028 | 15,528 |
| Academic Users | 200 | 3,000 | 12,000 | 19,500 | 28,000 |
| Past Users | 200 | 3,200 | 15,200 | 34,700 | |
| Total | 200 | 3,200 | 15,200 | 34,700 | 62,700 |
| Pricing (including ASP, Data Hosting and Consulting) | |||||
| Corporation | - | $2,000 | $2,500 | $3,000 | $3,500 |
| Academic | - | $200 | $250 | $300 | $350 |
| Revenue | |||||
| Corporation | - | $1,456,000 | $8,070,000 | $24,084,000 | $54,348,000 |
| Academic | - | $640,000 | $3,800,000 | $10,410,000 | $21,945,000 |
| Total | - | $2,096,000 | $11,870,000 | $34,494,000 | $76,293,000 |
Key Assumptions
- Current market size is 200,000 users worldwide and will grow 29% annually through 2005
- Our market penetration will be 1% for year 1, 5% for year 2, 15% for year 3, 25% for year 4
- Our company will market aggressively in response to the demand growth
- Our income projections only reflect costs incurred from licensing academic software; we assume that we will establish strategic positioning with the corporate software developers
Financial Highlights
Based on the assumptions stated in the previous section, we note the following financial highlights. Please refer to the pro forma income statements, balance sheets, and cash flow statements for further detail.
- We expect to be RPI positive in 2003
- We expect to break even in 2005
- By Q4 2005, we expect to have earned $19.2 million
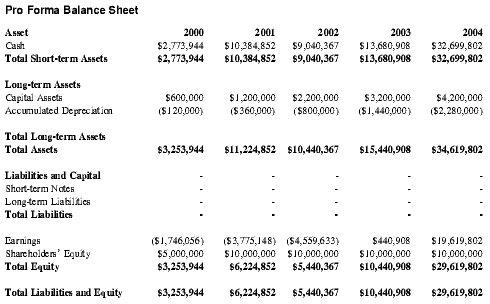
| Asset | 2000 | 2001 | 2002 | 2003 | 2004 |
| Cash | $2,773,944 | $10,384,852 | $9,040,367 | $13,680,908 | $32,699,802 |
| Total Short-term Assets | $2,773,944 | $10,384,852 | $9,040,367 | $13,680,908 | $32,699,802 |
| Long-term Assets | |||||
| Capital Assets | $600,000 | $1,200,000 | $2,200,000 | $3,200,000 | $4,200,000 |
| Accumulated Depreciation | ($120,000) | ($360,000) | ($800,000) | ($1,440,000) | ($2,280,000) |
| Total Long-term Assets | |||||
| Total Assets | $3,253,944 | $11,224,852 | $10,440,367 | $15,440,908 | $34,619,802 |
| Liabilities and Capital | - | - | - | - | - |
| Short-term Notes | - | - | - | - | - |
| Long-term Liabilities | - | - | - | - | - |
| Total Liabilities | - | - | - | - | - |
| Earnings | ($1,746,056) | ($3,775,148) | ($4,559,633) | $440,908 | $19,619,802 |
| Shareholders' Equity | $5,000,000 | $10,000,000 | $10,000,000 | $10,000,000 | $10,000,000 |
| Total Equity | $3,253,944 | $6,224,852 | $5,440,367 | $10,440,908 | $29,619,802 |
| Total Liabilities and Equity | $3,253,944 | $6,224,852 | $5,440,367 | $10,440,908 | $29,619,802 |
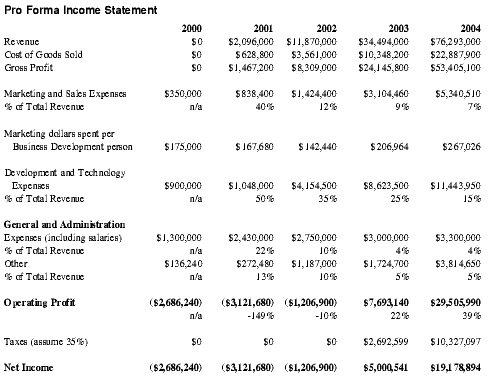
| 2000 | 2001 | 2002 | 2003 | 2004 | |
| Revenue | $0 | $2,096,000 | $11,870,000 | $34,494,000 | $76,293,000 |
| Cost of Goods Sold | $0 | $628,800 | $3,561,000 | $10,348,200 | $22,887,900 |
| Gross Profit | $0 | $1,467,200 | $8,309,000 | $24,145,800 | $53,405,100 |
| Marketing and Sales Expenses | $350,000 | $838,400 | $1,424,400 | $3,104,460 | $5,340,510 |
| % of Total Revenue | n/a | 40% | 12% | 9% | 7% |
| Marketing dollars spent per Business Development person | $175,000 | $167,680 | $142,440 | $206,964 | $267,026 |
| Development and Technology Expenses | $900,000 | $1,048,000 | $4,154,500 | $8,623,500 | $11,443,950 |
| % of Total Revenue | n/a | 50% | 35% | 25% | 15% |
| General and Administration | |||||
| Expenses (including salaries) | $1,300,000 | $2,430,000 | $2,750,000 | $3,000,000 | $3,300,000 |
| % of Total Revenue | n/a | 22% | 10% | 4% | 4% |
| Other | $136,240 | $272,480 | $1,187,000 | $1,724,700 | $3,814,650 |
| % of Total Revenue | n/a | 13% | 10% | 5% | 5% |
| Operating Profit | ($2,686,240) | ($3,121,680) | ($1,206,900) | $7,693,140 | $29,505,990 |
| n/a | -149% | -10% | 22% | 39% | |
| Taxes (assume 35%) | $0 | $0 | $0 | $2,692,599 | $10,327,097 |
| Net Income | ($2,686,240) | ($3,121,680) | ($1,206,900) | $5,000,541 | $19,178,894 |
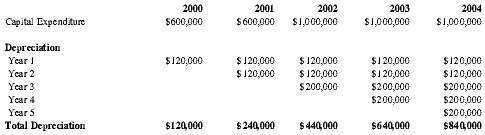
| 2000 | 2001 | 2002 | 2003 | 2004 | |
| Capital Expenditure | $600,000 | $600,000 | $1,000,000 | $1,000,000 | $1,000,000 |
| Depreciation | |||||
| Year 1 | $120,000 | $120,000 | $120,000 | $120,000 | $120,000 |
| Year 2 | $120,000 | $120,000 | $120,000 | $120,000 | |
| Year 3 | $200,000 | $200,000 | $200,000 | ||
| Year 4 | $200,000 | $200,000 | |||
| Year 5 | $200,000 | ||||
| Total Depreciation | $120,000 | $240,000 | $440,000 | $640,000 | $840,000 |
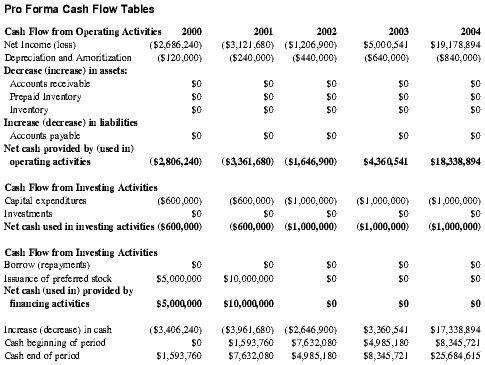
| Cash Flow from Operating Activities | 2000 | 2001 | 2002 | 2003 | 2004 |
| Net Income (loss) | ($2,686,240) | ($3,121,680) | ($1,206,900) | $5,000,541 | $19,178,894 |
| Depreciation and Amoritization | ($120,000) | ($240,000) | ($440,000) | ($640,000) | ($840,000) |
| Decrease (increase) in assets: | |||||
| Accounts receivable | $0 | $0 | $0 | $0 | $0 |
| Prepaid Inventory | $0 | $0 | $0 | $0 | $0 |
| Inventory | $0 | $0 | $0 | $0 | $0 |
| Increase (decrease) in liabilities | |||||
| Accounts payable | $0 | $0 | $0 | $0 | $0 |
| Net cash provided by (used in) operating activities | ($2,806,240) | ($3,361,680) | ($1,646,900) | $4,360,541 | $18,338,894 |
| Cash Flow from Investing Activities | |||||
| Capital expenditures | ($600,000) | ($600,000) | ($1,000,000) | ($1,000,000) | ($1,000,000) |
| Investments | $0 | $0 | $0 | $0 | $0 |
| Net cash used in investing activities | ($600,000) | ($600,000) | ($1,000,000) | ($1,000,000) | ($1,000,000) |
| Cash Flow from Investing Activities | |||||
| Borrow (repayments) | $0 | $0 | $0 | $0 | $0 |
| Issuance of preferred stock | $5,000,000 | $10,000,000 | $0 | $0 | $0 |
| Net cash (used in) provided by financing activities | $5,000,000 | $10,000,000 | $0 | $0 | $0 |
| Increase (decrease) in cash | ($3,406,240) | ($3,961,680) | ($2,646,900) | $3,360,541 | $17,338,894 |
| Cash beginning of period | $0 | $1,593,760 | $7,632,080 | $4,985,180 | $8,345,721 |
| Cash end of period | $1,593,760 | $7,632,080 | $4,985,180 | $8,345,721 | $25,684,615 |
FOUNDER PROFILES
Eugene R. Mantella
Mr. Mantella is a doctoral candidate and member of the Laboratory for Molecular Studies at UCSD. He is one of the primary architects behind the GAECS algorithm, and has a significant amount of experience working in the pharmaceutical and bioinformatics industries. He is a co-founder of the non-profit organization "Entrepreneurs in Healthcare and Biotechnology" at UCSD, and regularly acts as a domain consultant to several leading life science investment firms in New York and the San Diego area.
F. Ray Smythe
F. Ray Smythe is a doctoral candidate in bioinformatics at UCSD. As a member of the BioT Group at Harvard University, Mr. Smythe develops novel algorithms and visualization tools for analysis of macromolecular structure and function. Mr. Smythe received a B.A. in Biochemistry and Molecular Cell Biology from U.C. Irvine. He has worked for large pharmaceutical companies, biotech start-ups, as well as a government-backed research effort focusing on the genetics of multiple sclerosis. He is a co-founder of the "Entrepreneurs in Healthcare and Biotechnology" at UCSD.
Beverly Johnson
Beverly Johnson is in the UCSD Graduate Group in Biophysics. She has a significant amount of experience in structural biology and enzymology. She has recently completed the X-ray crystallographic structure of granzyme B, a serine protease involved in T-cell immune response. She graduated with a degree in physics from the University of California at San Diego. Ms. Johnson is a founding member of the "Entrepreneurs" and has served as the student representative planning UCSD's newest course—From Idea to IPO...and Beyond. Her perspective regarding the needs of experimental research will be a driving force behind the implementation of our technology platform.
George Jamison
George Jamison is the 2002 American Cancer Society Joseph P. Henry Postdoctoral Fellow at Harvard University in the Departments of Medicine and Genetics. He holds a Ph.D. in Pharmaceutical Chemistry from the University of California, San Diego, and a B.S. with distinction from the University of Michigan. He is a member of the Phi Kappa Phi and Phi Beta Kappa national honor societies and has won several awards for his work, including the Jacob N. Napier award for research in physical chemistry and the ARCS award for student scientists. As a researcher, he has worked at the National NMR Center in Madison, Wisconsin, the Computer Graphics Laboratory (now the Resource for Biocomputing, Visualization, and Informatics) at UCSD, and the Section on Medical Informatics at Harvard University.
KEYS TO SUCCESS
- Establish strategic partnerships with key software firms, and license necessary technology from universities
- Develop and deploy software tools through the Internet in six to eight months after obtaining the software licenses
- Target small- to medium-sized biotechnology and pharmaceutical companies and universities to establish a dominant market share in currently under-served sectors
- Target the growing use of outsourcing in the biotechnology industry to meet the needs of companies of all sizes
Why We Will Succeed
Pharmatech Genomics has proven domain expertise in developing structural genomics software. Our team members have advanced backgrounds in computer science, structure-based drug design, and structural biology. Software tools in our technology suite were developed by several of our team members. We have the necessary relationships within the structural genomics community to identify and license or build relevant technologies.
Pharmatech Genomics' scientific advisors include faculty at the University of California Irvine, the University of California, San Diego, and Harvard University. Other advisors include prominent venture capitalists, a seasoned equity analyst with a leading investment bank, and the CEO and CFO of a mid-sized biotechnology company. These individuals will continue to guide the development of this company through all stages of its growth.
Comment about this article, ask questions, or add new information about this topic: