PROGRAM EVALUATION AND REVIEW
TECHNIQUE AND CRITICAL
PATH METHOD
Program Evaluation and Review Technique (PERT) and Critical Path Method (CPM) are tools widely used in project scheduling. Both are based on network diagrams applicable for both the planning and control aspects of production. Visual display of the network enhances the communication and highlights the interdependency of the various activities required for project completion. Perhaps the greatest contribution of these tools is the identification of sequentially time-critical activities that require the closest monitoring.
BACKGROUND
In the early 1900s the Gantt chart was widely hailed as the reason that ships were built in record time. Developed by an engineer named Henry Gantt, this horizontal bar chart shows the scheduled times for individual jobs to be accomplished by specific resources. However, this tool is static in nature, and requires frequent manual updating, especially when activities are sequentially dependent.
In Figure 1, the Gantt chart shows the prospective times for five activities in a project, but does not show an underlying dependency of Activity D on the completion of Activity B.
In the 1950s, two groups independently developed what has become known as the PERT/CPM method of project scheduling. Each of these techniques improved on the Gantt chart by building into the tool the explicit sequencing of activities.
PERT was developed by the U.S. Navy, the Lockheed Corporation, and the consulting firm of Booz, Allen and Hamilton to facilitate the Polaris missile project. As time was a primary issue, this technique used statistical techniques to assess the probability of finishing the project within a given period of time.
By contrast, CPM was created in the environment of industrial projects, where costs were a major factor. In addition to the identification of the time-critical path of activities, representatives from the Du Pont Company and Sperry-Rand Corporation also developed a time-cost tradeoff analysis mechanism called crashing.
These two tools differ in the network diagram display. PERT historically uses the activity-on-arrow (AOA) convention, while CPM uses activity-on-node (AON). For most purposes, these two conventions are interchangeable; however some propriety software requires the logic of a specific convention. Both forms of network diagrams use arrows (lines implying direction) and nodes (circles or rectangles) to define the set of project activities or tasks. The flow of logic is from left to right. To simplify the diagram, letters are frequently used to represent individual activities. Figures 2 and 3 illustrate the differences for the same simple project.
Figure 2 illustrates the AOA convention, in which arrows depict activity requiring time and resources. The node represents an event, which requires neither time nor resources; this event is actually recognition that prior tasks are completed and the following tasks can begin. While the length of the arrow is not necessarily related to the duration of the task, there may be a tendency on the part of the analyst to sketch longer arrows for longer activities. To maintain the integrity of the network, there may be need for a dummy activity, as it is not acceptable to have two tasks that share the same beginning and ending nodes.
In Figure 3, the AON uses nodes to represent activities. The arrows have no implication of time, used only to indicate sequential flow. Since the AOA
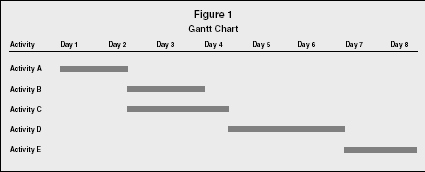
Gantt Chart
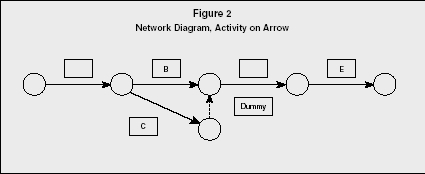
Network Diagram, Activity on Arrow
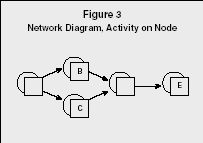
Network Diagram, Activity on Node
USING CPM TO SCHEDULE
AND CONTROL A PROJECT
Scheduling is an important part of the planning of any project. However, it is first necessary to develop a list of all the activities required, as listed in the work breakdown structure. Activities require both time and the use of resources. Typically, the list of activities is compiled with duration estimates and immediate predecessors.
To illustrate the use of CPM, we can imagine a simple cookie-baking project: the recipe provides the complete statement of work, from which the work breakdown structure can be developed. The resources available for this project are two cooks and one oven with limited capacity; the raw materials are the ingredients to be used in preparing the cookie dough. As listed in Table 1, the activities take a total of 80 minutes of resource time. Because some activities can run parallel, the cooks should complete the project in less than 80 minutes.
Table 1 displays some of the planning that will save time in the project. For example, once the oven is turned on, it heats itself, freeing the cooks to perform other activities. After the dough is mixed, both batches of cookies can be shaped; the shaping of the second batch does not have to wait until the first batch is complete. If both cooks are available, they can divide the dough in half and each cook can shape one batch in the same four-minute period. However, if the second cook is not available at this time, the project is not delayed because shaping of the second batch need not be completed until the first batch exits the oven.

List of Project Activities (CPM)
| Description of Activity | Duration (minutes) | Immediate Predecessor(s) |
| A. Preheat oven | 15 minutes | — |
| B. Assemble, measure ingredients | 8 minutes | — |
| C. Mix dough | 2 minutes | B |
| D. Shape first batch | 4 minutes | C |
| E. Bake first batch | 12 minutes | A, D |
| F. Cool first batch | 10 minutes | E |
| G. Shape second batch | 4 minutes | C |
| H. Bake second batch | 12 minutes | E, G |
| I. Cool second batch | 10 minutes | H |
| J. Store cookies | 3 minutes | F, I |
| Total time | 80 minutes |
Some expertise is required in the planning stage, as inexperienced cooks may not recognize the independence of the oven in heating or the divisibility of the dough for shaping. The concept of concurrent engineering makes the planning stage even more important, as enhanced expertise is needed to address which stages of the project can overlap, and how far this overlap can extend.
After beginning the project at 8:00 A.M., the first batch of dough is ready to go into the oven at 8:14, but the project cannot proceed until the oven is fully heated—at 8:15. The cooks actually have a one-minute cushion, called slack time. If measuring, mixing, or shaping actually take one additional minute, this will not delay the completion time of the overall project.
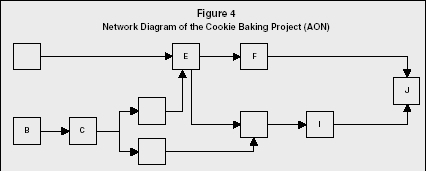
Network Diagram of the Cookie Baking Project (AON)
Figure 4 illustrates the network diagram associated with the cookie-baking
project. The set of paths through the system traces every possible route
from each beginning activity to each ending activity. In this simple
project, one can explicitly define all the paths through the system in
minutes as follows:
A-E-F-J = 15 + 12 + 10 + 3 = 40
A-E-H-I-J = 15 + 12 + 12 + 10 + 3 = 52
B-C-D-E-F-J = 8 + 2 + 4 + 12 + 10 + 3 = 39
B-C-D-E-H-I-J = 8 + 2 + 4 + 12 + 12 + 10 + 3 = 51
B-C-G-H-I-J = 8 + 2 + 4 + 12 + 10 + 3 = 39
The critical path is the longest path through the system, defining the minimum completion time for the overall project. The critical path in this project is A-E-H-I-J, determining that the project can be completed in 52 minutes (less than the 80-minute total of resource-usage time). These five activities must be done in sequence, and there is apparently no way to shorten these times. Note that this critical path is not dependent on the number of activities, but is rather dependent on the total time for a specific sequence of activities.
The managerial importance of this critical path is that any delay to the activities on this path will delay the project completion time, currently anticipated as 8:52 A.M. It is important to monitor this critical set of activities to prevent the missed due-date of the project. If the oven takes 16 minutes to heat (instead of the predicted 15 minutes), the project manager needs to anticipate how to get the project back on schedule. One suggestion is to bring in a fan (another resource) to speed the cooling process of the second batch of cookies; another is to split the storage process into first- and second-batch components.
Other paths tend to require less monitoring, as these sets of activities have slack, or a cushion, in which activities may be accelerated or delayed without penalty. Total slack for a given path is defined as the difference in the critical path time and the time for the given path. For example, the total slack for B-C-G-H-I-J is 13 minutes (52–39 minutes). And the slack for B-C-D-E-H-I-J is only one minute (52–51), making this path near critical. Since these paths share some of the critical path activities, it is obvious that the manager should look at the slack available to individual activities.
Table 2 illustrates the calculation of slack for individual activities. For projects more complex than the simplistic cookie project, this is the method used to identify the critical path, as those activities with zero slack time are critical path activities. The determination of early-start and early-finish times use a forward pass through the system to investigate how early in the project each activity could start and end, given the dependency on other activities.

Calculation of Slack Time
| Activity | Early Start | Early Finish | Late Start | Late Finish | Slack |
| A | 8:00 | 8:15 | 8:00 | 8:15 | 0 |
| B | 8:00 | 8:08 | 8:01 | 8:09 | 1 |
| C | 8:08 | 8:10 | 8:09 | 8:11 | 1 |
| D | 8:10 | 8:14 | 8:11 | 8:15 | 1 |
| E | 8:15 | 8:27 | 8:15 | 8:27 | 0 |
| F | 8:27 | 8:37 | 8:39 | 8:49 | 12 |
| G | 8:10 | 8:14 | 8:23 | 8:27 | 13 |
| H | 8:27 | 8:39 | 8:27 | 8:39 | 0 |
| I | 8:39 | 8:49 | 8:39 | 8:49 | 0 |
| J | 8:49 | 8:52 | 8:49 | 8:52 | 0 |
The late-time calculations use the finish time from the forward pass (8:52 A.M.) and employ a backward pass to determine at what time each activity must start to provide each subsequent activity with sufficient time to stay on track.
Slack for the individual activities is calculated by taking the difference between the late-start and early-start times (or, alternatively, between the late-finish and early-finish times) for each activity. If the difference is zero, then there is no slack; the activity is totally defined as to its time-position in the project and must therefore be a critical path activity. For other activities, the slack defines the flexibility in start times, but only assuming that no other activity on the path is delayed.
CPM was designed to address time-cost trade-offs, such as the use of the fan to speed the cooling process. Such crashing of a project requires that the project manager perform contingency planning early in the project to identify potential problems and solutions and the costs associated with employing extra resources. Cost-benefit analysis should be used to compare the missed due-date penalty, the availability and cost of the fan, and the effect of the fan on the required quality of the cookies.
This project ends with the successful delivery of the cookies to storage, which brings two questions to mind: First, should the oven be turned off? The answer to this depends on the scheduling of the oven resource at the end of this project. It might be impractical to cool the oven at this point if a following project is depending on the heating process to have been maintained. Second, who cleans up the kitchen? Project due dates are often frustrated by failure to take the closeout stages into account.
USING PERT TO SCHEDULE
AND CONTROL A PROJECT
In repetitive projects, or in projects employing well-known processes, the duration of a given activity may be estimated with relative confidence. In less familiar territory, however, it may be more appropriate to forecast a range of possible times for activity duration. Using the same cookie-baking project example, Figure 4 still accurately represents the sequencing of activities.
Table 3 illustrates the project with three time estimates for each activity. While m represents the most likely time for the activity, a suggests the optimistic estimate and b is the pessimistic estimate. The estimated time and or standard deviation for each activity ( E ) are calculated from the formula for the flexible beta distribution. With a reasonably large number of activities, summing the means tends to approximate a normal distribution, and statistical estimates of probability can be applied.
The mean is calculated as [( a + 4m + b ) ÷ 6 ], an average heavily weighted toward the most likely time, m. The standard deviation for an activity is [( b − a ) ÷ 6 ], or one-sixth of the range. Managers with a basic understanding of statistics may relate this to the concept of the standard deviation in the normal distribution. Since ±3 standard deviations comprise almost the entire area under the normal curve, then there is an intuitive comparison between a beta standard deviation and the normal standard deviation.
Using these new estimates for activity duration, the activity paths
through the system have not changed, but the estimates of total time (
T
) are as follows:
A-E-F-J = 40.66 minutes
A-E-H-I-J = 53 minutes
B-C-D-E-F-J = 40.66 minutes
B-C-D-E-H-I-J = 53 minutes
B-C-G-H-I-J = 40.66 minutes
There are two factors that should be considered coincidental to the comparison of PERT and CPM in the example. First, there are two critical paths of T = 53 minutes each in the PERT analysis. Second, all the other paths have the same duration of T = 40.66 minutes. These concepts are neither more nor less likely to happen under PERT as opposed to CPM; they are strictly a function of the numbers in the estimates. However, the serendipity of two critical paths allows us to address the issue of which would be considered the more important of the two.
In Table 4, each of the critical paths is considered. Relevant to this analysis is the sum of the variances on the critical path; note that summing variances

List of Project Activities (PERT)
| Duration (minutes) | ||||||
| Description of Activity | a | m | b | E t | V t | S t |
| A. Preheat oven | 12 | 15 | 18 | 15.00 | 1 | 1 |
| B. Assemble, measure ingredients | 6 | 8 | 12 | 8.33 | 1 | 1 |
| C. Mix dough | 2 | 2 | 2 | 2.00 | 0 | 0 |
| D. Shape first batch | 3 | 4 | 9 | 4.67 | 1 | 1 |
| E. Bake first batch | 10 | 12 | 16 | 12.33 | 1 | 1 |
| F. Cool first batch | 5 | 10 | 11 | 9.33 | 1 | 1 |
| G. Shape second batch | 3 | 4 | 9 | 4.67 | 1 | 1 |
| H. Bake second batch | 10 | 12 | 16 | 12.33 | 1 | 1 |
| I. Cool second batch | 5 | 10 | 11 | 9.33 | 1 | 1 |
| J. Store cookies | 2 | 3 | 10 | 4.00 | 1.78 | 1.33 |
| Total times | 58 | 90 | 114 | |||

Variability of Project Activities (PERT)
| Duration (minutes) | ||||||||
|
Path = A–E–H–I–J
Description of Activity |
||||||||
| a | m | b | E t | V t | S t | |||
| A. Preheat oven | 12 | 15 | 18 | 15.00 | 1 | 1 | ||
| E. Bake first batch | 10 | 12 | 16 | 12.33 | 1 | 1 | ||
| H. Bake second batch | 10 | 12 | 16 | 12.33 | 1 | 1 | ||
| I. Cool second batch | 5 | 10 | 11 | 9.33 | 1 | 1 | ||
| J. Store cookies | 2 | 3 | 10 | 4.00 | 1.78 | 1.33 | ||
| Total variance | 5.78 | |||||||
| Standard deviation | 2.40 | |||||||
| Duration (minutes) | ||||||||
|
Path = B–C–D–E–H–I–J
Description of Activity |
||||||||
| a | m | b | E t | V t | S t | |||
| B. Assemble, measure ingredients | 6 | 8 | 12 | 8.33 | 1 | 1 | ||
| C. Mix dough | 2 | 2 | 2 | 2.00 | 0 | 0 | ||
| D. Shape first batch | 3 | 4 | 9 | 4.67 | 1 | 1 | ||
| E. Bake first batch | 10 | 12 | 16 | 12.33 | 1 | 1 | ||
| H. Bake second batch | 10 | 12 | 16 | 12.33 | 1 | 1 | ||
| I. Cool second batch | 5 | 10 | 11 | 9.33 | 1 | 1 | ||
| J. Store cookies | 2 | 3 | 10 | 4.00 | 1.78 | 1.33 | ||
| Total variance | 6.78 | |||||||
| Standard deviation | 2.60 | |||||||
is mathematically valid, while summing standard deviations is not. Path A-E-H-I-J has a total variance of 5.78 minutes, while path B-C-D-E-H-I-J has a variance of 6.78. Thus, path B-C-D-E-H-I-J, with the larger variance, is considered the riskier of the two paths and should be the primary concern of the project manager. We assign the entire project a variance of 6.78 minutes, and the standard deviation (the square root of the project variance) is 2.60 minutes.
Armed with this project standard deviation, the next step is to estimate
the probability of finishing the project within a defined period. Applying
the critical path time of 53 minutes to the normal distribution, the
probability of finishing in exactly
T
= 53 minutes is 50/50. The relevant formula for calculating the number of
standard normal distributions is as follows:
where
T
= total time of the critical path (
T
= 53)
S
= standard deviation of the project (
S
= 2.60)
C
= arbitrary time for end of project
If C = 9:00 a.m., then Z = [(9:00 − 8:53) ÷2.60] = 7 ÷2.60 = 2.69 standard normal deviations. Referring to a cumulative standard normal table, we find that Z = 0.99632, or a 99.632 percent chance of finishing by 9:00 A.M.
If C = 8:50 A.M., then Z = [(8:50 − 8:53) ÷2.60] =−3 ÷2.60 = −1.15. In this case, we use (1 − table value) for the probability = 1 − 0.87493 = 0.1251, or a 12.51 percent chance of finishing 3 minutes earlier than predicted.
From a managerial viewpoint, it should be reiterated that there is only a 50/50 chance of completing the project within the sum of the activity-time estimates on the critical path ( T ). This perspective is not emphasized in the CPM analysis, but is likely relevant in that context also. Adding a buffer to the promised due date (where C > T ) enhances the probability that the project will be completed as promised.
There may be competitive advantages to bidding a project on the basis of a nearer-term completion date (where C < T ), but managers can assess the risks involved using PERT analysis. In the cookie example, there may be a promised delivery time riding on this project estimate, or the resources (cooks and oven) may be promised to other projects. By using PERT, managers can allocate the resources on a more informed basis.
Both PERT and CPM rely heavily on time estimates, as derived from local experts, to determine the overall project time. While the estimating process may intimidate local managers, this may suffice to produce an estimate that becomes a fait accompli, as managers strive to meet the goal rather than explain why they failed to do so.
These two project management tools, frequently used together, can assist the project manager in establishing contract dates for project completion, in estimating the risks and costs of contingencies, and in monitoring project progress. Many commercial software packages exist to support the project manager in tracking both costs and time incurred to date through-out the project duration.
SEE ALSO: Operations Scheduling ; Project Management
Karen L. Brown
Revised by Badie N. Farah
FURTHER READING:
Mantel, Samuel J., Jr., Jack R. Meredith, Scott M. Shafer, and Margaret M. Sutton. Core Concepts: Project Management in Practice. New York, NY: John Wiley & Sons, Inc., July 2004.
Meredith, Jack R., and Samuel J. Mantel, Jr. Project Management: A Managerial Approach. New York, NY: John Wiley & Sons, Inc., 2002.
Ragsdale, Cliff T. Spreadsheet Modeling and Decision Analysis. Cincinnati, OH: Thomson/South-Western College Publishing, 2004.
Stevenson, William J. Operations Management. Boston, MA: McGraw-Hill, 2005.
Taylor, Bernard W., III. Introduction to Management Science. Englewood Cliffs, NJ: Prentice-Hall, 2004.